Nufarm Limited: Weighted Average Cost of Capital and Gearing Analysis
VerifiedAdded on 2022/11/14
|15
|3358
|124
Report
AI Summary
This report presents a comprehensive financial analysis of Nufarm Limited, focusing on its capital structure for the financial year 2018. It begins with the calculation of the Weighted Average Cost of Capital (WACC) using the Capital Asset Pricing Model (CAPM) to estimate the cost of equity and incorporating the cost of debt. The report details the estimation of key components, including the risk-free rate, market risk premium, and beta, drawing data from the Reserve Bank of Australia, ASX200 index, and Morningstar. Following the WACC calculation, the report calculates and analyzes Nufarm Limited's gearing ratios, including the debt-to-equity and interest coverage ratios, providing insights into the company's financial leverage. The analysis then applies capital structure theory to interpret the findings and concludes with recommendations to the board for optimizing the capital structure. The report also includes a reflection on the overall work performed and is supported by relevant references.
1
Capital Structure of Nufarm Limited
Capital Structure of Nufarm Limited
Paraphrase This Document
Need a fresh take? Get an instant paraphrase of this document with our AI Paraphraser
2
Contents
Introduction......................................................................................................................................3
Task 1 and 2: Calculation of weighted average cost of capital through using appropriate method
(All the calculation and judgments have been properly explained)................................................3
Calculation of Weighted Average Cost of Capital.......................................................................3
Part 1: Estimation of cost of equity and cost of debt...................................................................4
Part 2: Estimation of weights of both equity and debt capital.....................................................8
Part 3: Calculation of Weighted Average Cost of Capital...........................................................9
Task 3: Calculation of gearing ratio of Nufarm Limited.................................................................9
Task 4: Use of capital structure theory to analyse the findings.....................................................10
Task 5: Recommendation given to the board to improve the current capital structure.................10
Task 6: Reflection of overall work................................................................................................11
Conclusion.....................................................................................................................................11
References......................................................................................................................................12
3
Introduction
The calculation of appropriate weighted average cost of capital of any company is the
complex task and it requires appropriate use of technique or method to estimate correct WACC.
In this regard, this report is developed for calculating the WACC of Nufarm Limited through use
of capital asset pricing model as it is best model to estimate the required WACC of the selected
company. Capital asset pricing is used estimate the cost of equity and it requires calculating of
three important components that are beta factor, risk free rate of return and market premium. In
addition to this, the report also depicts the calculation of gearing ratios for Nufarm Limited and
analyzes the findings with the use of capital structure theory. This is followed by providing
recommendations to the Board on the current capital structure of the firm and presents reflection
on overall work performed to process this report.
The company selected for analysis purpose is Nufarm Limited; an agricultural company
headquartered within Australia and traded on ASX. It is involved in manufacturing of
agrochemical products such as weeds and herbicides and various types of other diverse range of
crop protection products.
Task 1 and 2: Calculation of weighted average cost of capital through using appropriate
method (All the calculation and judgments have been properly explained)
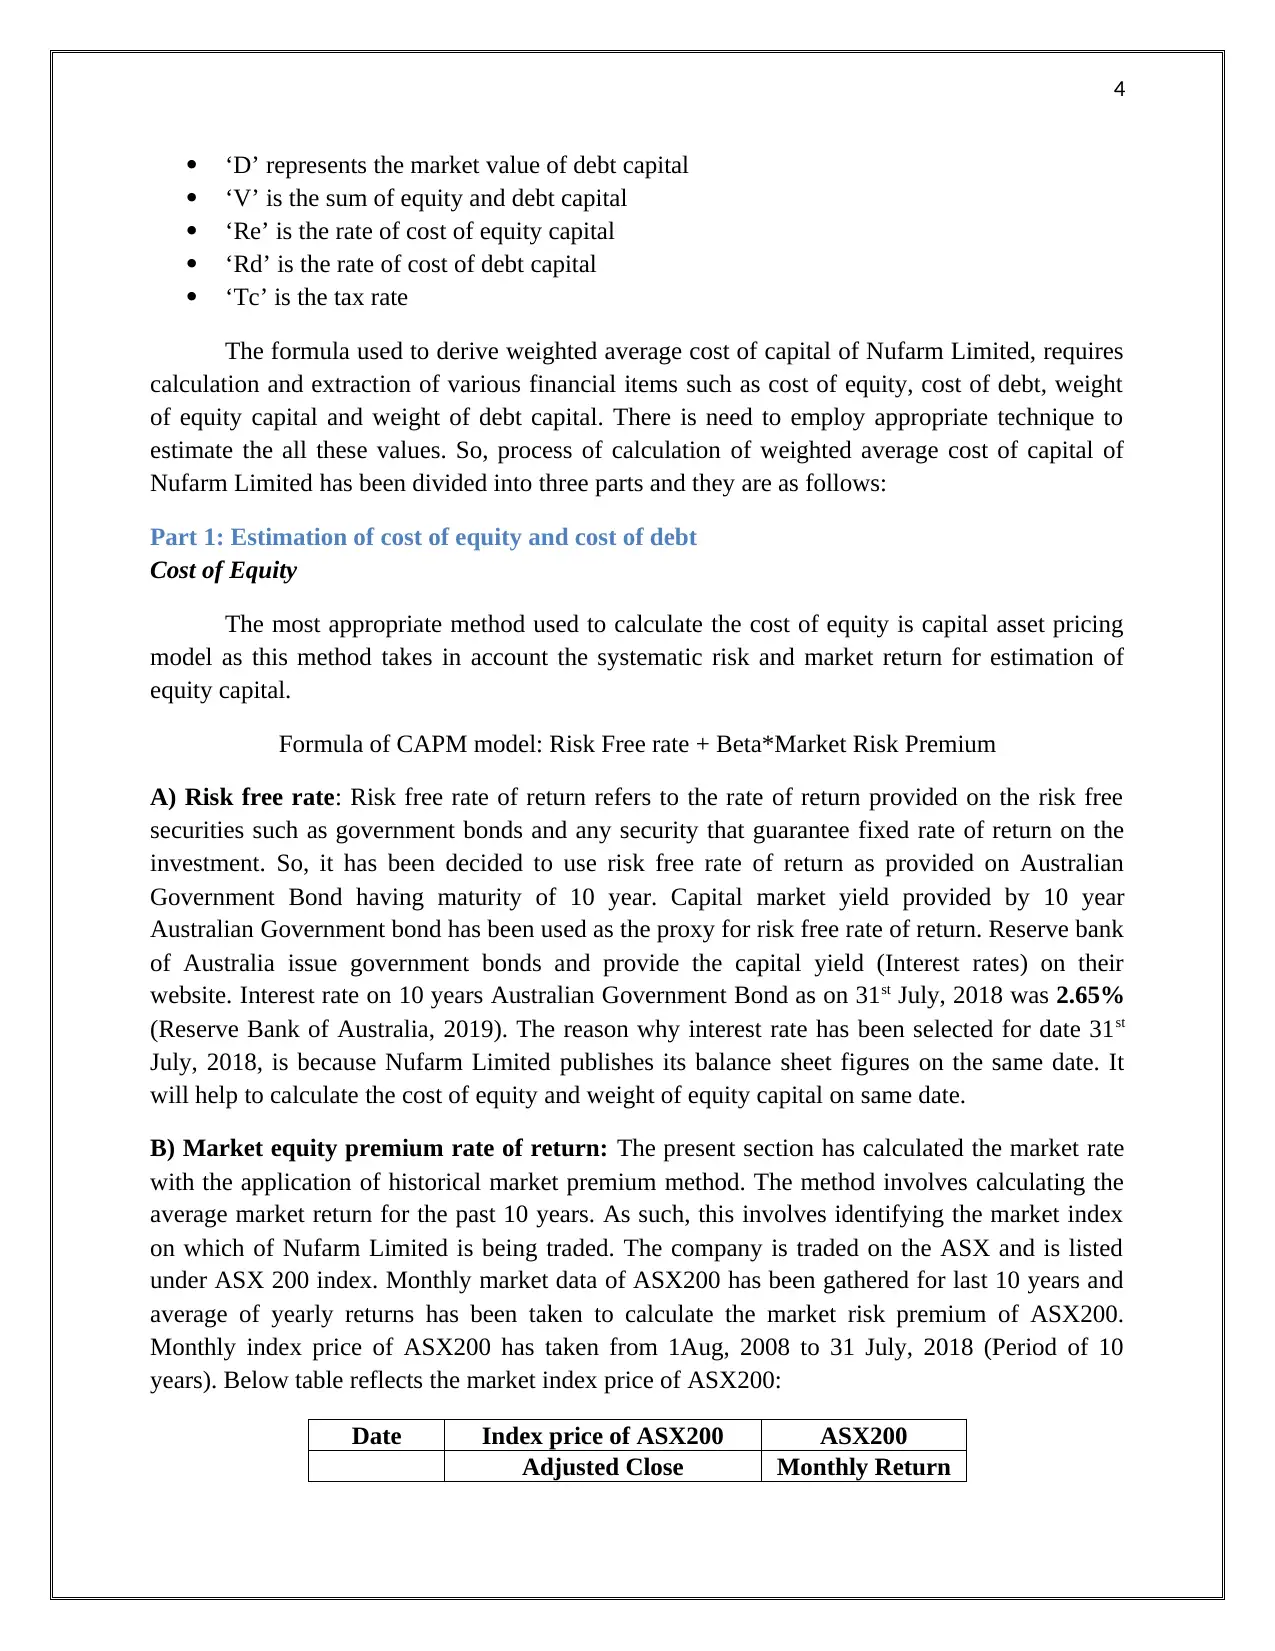
Calculation of Weighted Average Cost of Capital
This section of the report has been developed for calculating the weighted average cost of
capital for Nufarm Limited for the financial year 2018. The weighted average cost of capital is
regarded as the overall cost that is incurred by a company on its total capital. It is calculated by
weighing proportionally all the capitals employed by a company and the cost of each capital is
multiplied by weight for arriving at the weighted average cost of capital. The major type of
capital that is used by a company includes equity, debt, bonds, debentures, preferences and other
type of long-term debt. The weighted average cost of capital is dependent on the factors such as
risk free rate, beta, and rate of interest and market return. The cost of capital rise with the
increase in beta and the rate of return on equity. Thus, if there is increase in the WACC then it
reflects the rise in overall risk and decline in the valuation of capital. The formula for calculating
the weighted average cost of capital is stated as follows:
In the above formula:
‘E’ represents the equity value
Introduction
The calculation of appropriate weighted average cost of capital of any company is the
complex task and it requires appropriate use of technique or method to estimate correct WACC.
In this regard, this report is developed for calculating the WACC of Nufarm Limited through use
of capital asset pricing model as it is best model to estimate the required WACC of the selected
company. Capital asset pricing is used estimate the cost of equity and it requires calculating of
three important components that are beta factor, risk free rate of return and market premium. In
addition to this, the report also depicts the calculation of gearing ratios for Nufarm Limited and
analyzes the findings with the use of capital structure theory. This is followed by providing
recommendations to the Board on the current capital structure of the firm and presents reflection
on overall work performed to process this report.
The company selected for analysis purpose is Nufarm Limited; an agricultural company
headquartered within Australia and traded on ASX. It is involved in manufacturing of
agrochemical products such as weeds and herbicides and various types of other diverse range of
crop protection products.
Task 1 and 2: Calculation of weighted average cost of capital through using appropriate
method (All the calculation and judgments have been properly explained)
Calculation of Weighted Average Cost of Capital
This section of the report has been developed for calculating the weighted average cost of
capital for Nufarm Limited for the financial year 2018. The weighted average cost of capital is
regarded as the overall cost that is incurred by a company on its total capital. It is calculated by
weighing proportionally all the capitals employed by a company and the cost of each capital is
multiplied by weight for arriving at the weighted average cost of capital. The major type of
capital that is used by a company includes equity, debt, bonds, debentures, preferences and other
type of long-term debt. The weighted average cost of capital is dependent on the factors such as
risk free rate, beta, and rate of interest and market return. The cost of capital rise with the
increase in beta and the rate of return on equity. Thus, if there is increase in the WACC then it
reflects the rise in overall risk and decline in the valuation of capital. The formula for calculating
the weighted average cost of capital is stated as follows:
In the above formula:
‘E’ represents the equity value
⊘ This is a preview!⊘
Do you want full access?
Subscribe today to unlock all pages.
Trusted by 1+ million students worldwide
4
‘D’ represents the market value of debt capital
‘V’ is the sum of equity and debt capital
‘Re’ is the rate of cost of equity capital
‘Rd’ is the rate of cost of debt capital
‘Tc’ is the tax rate
The formula used to derive weighted average cost of capital of Nufarm Limited, requires
calculation and extraction of various financial items such as cost of equity, cost of debt, weight
of equity capital and weight of debt capital. There is need to employ appropriate technique to
estimate the all these values. So, process of calculation of weighted average cost of capital of
Nufarm Limited has been divided into three parts and they are as follows:
Part 1: Estimation of cost of equity and cost of debt
Cost of Equity
The most appropriate method used to calculate the cost of equity is capital asset pricing
model as this method takes in account the systematic risk and market return for estimation of
equity capital.
Formula of CAPM model: Risk Free rate + Beta*Market Risk Premium
A) Risk free rate: Risk free rate of return refers to the rate of return provided on the risk free
securities such as government bonds and any security that guarantee fixed rate of return on the
investment. So, it has been decided to use risk free rate of return as provided on Australian
Government Bond having maturity of 10 year. Capital market yield provided by 10 year
Australian Government bond has been used as the proxy for risk free rate of return. Reserve bank
of Australia issue government bonds and provide the capital yield (Interest rates) on their
website. Interest rate on 10 years Australian Government Bond as on 31st July, 2018 was 2.65%
(Reserve Bank of Australia, 2019). The reason why interest rate has been selected for date 31st
July, 2018, is because Nufarm Limited publishes its balance sheet figures on the same date. It
will help to calculate the cost of equity and weight of equity capital on same date.
B) Market equity premium rate of return: The present section has calculated the market rate
with the application of historical market premium method. The method involves calculating the
average market return for the past 10 years. As such, this involves identifying the market index
on which of Nufarm Limited is being traded. The company is traded on the ASX and is listed
under ASX 200 index. Monthly market data of ASX200 has been gathered for last 10 years and
average of yearly returns has been taken to calculate the market risk premium of ASX200.
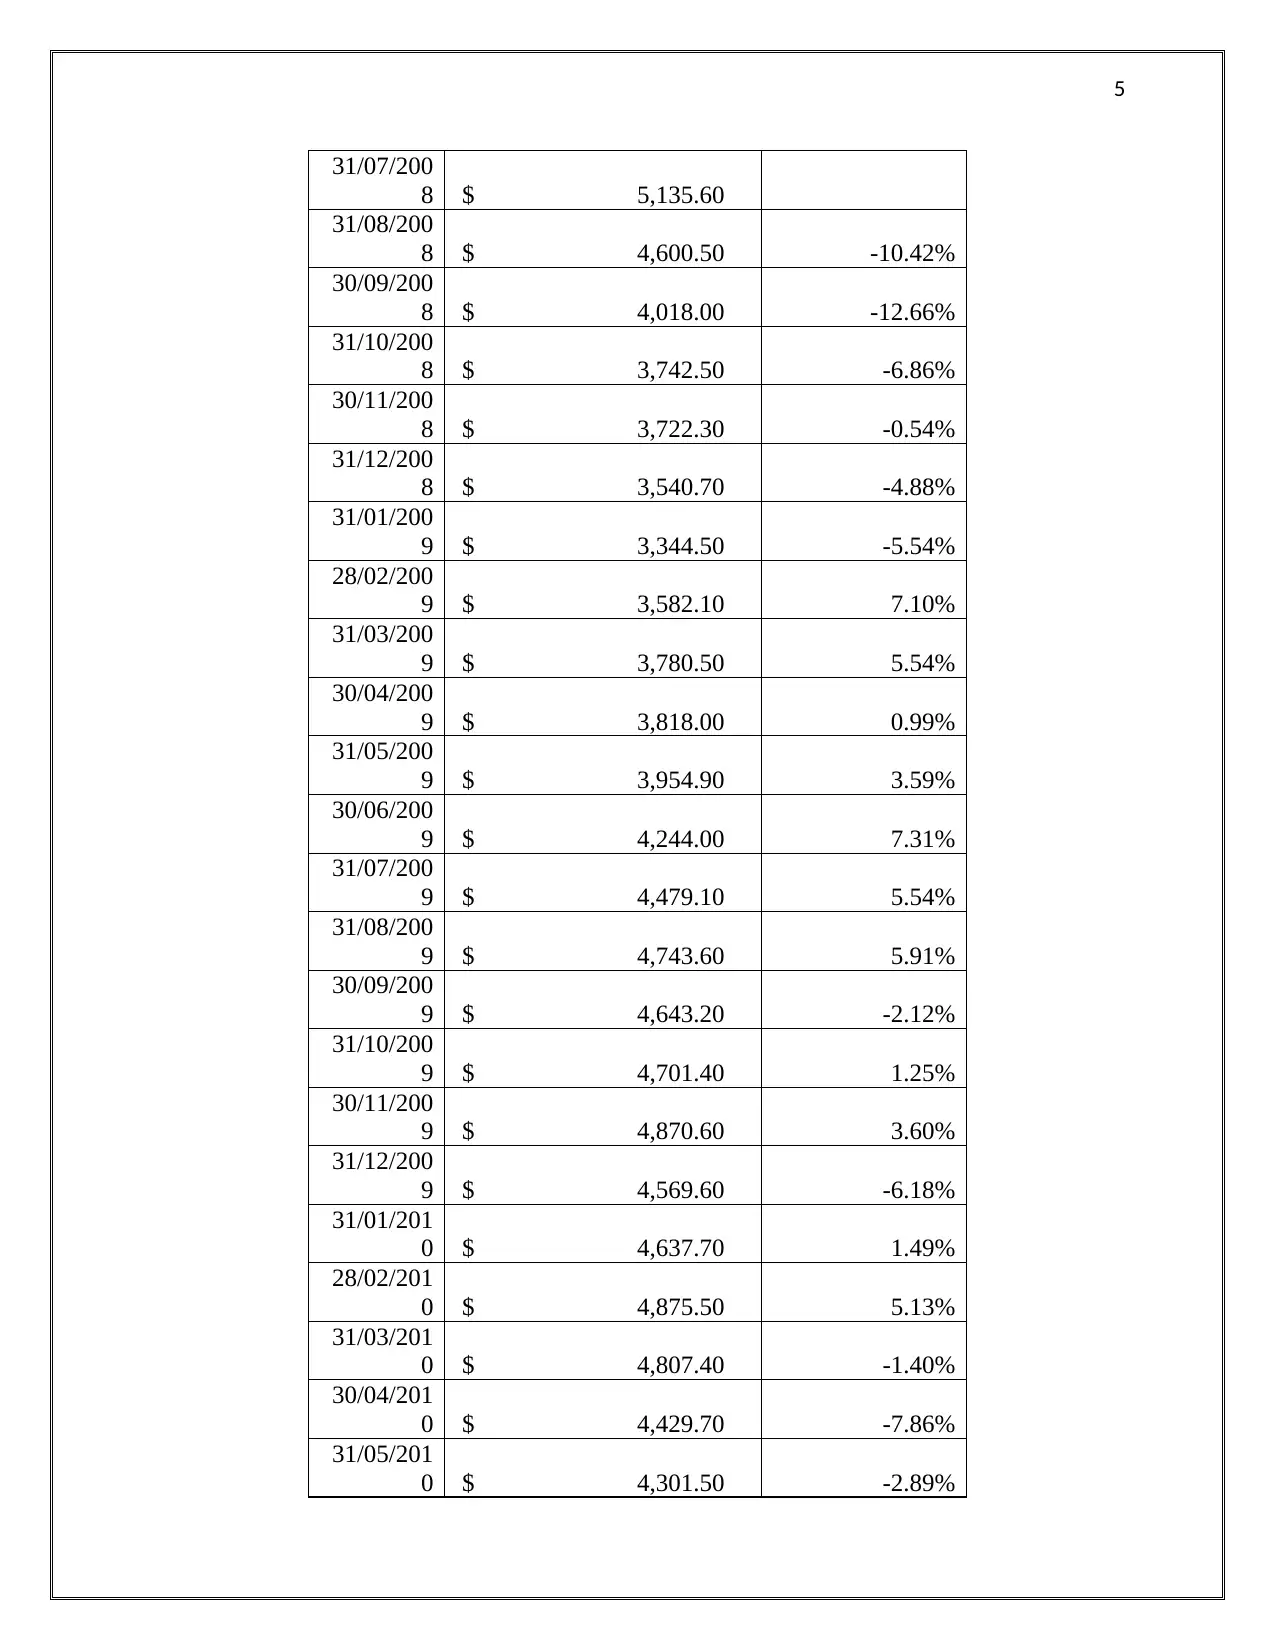
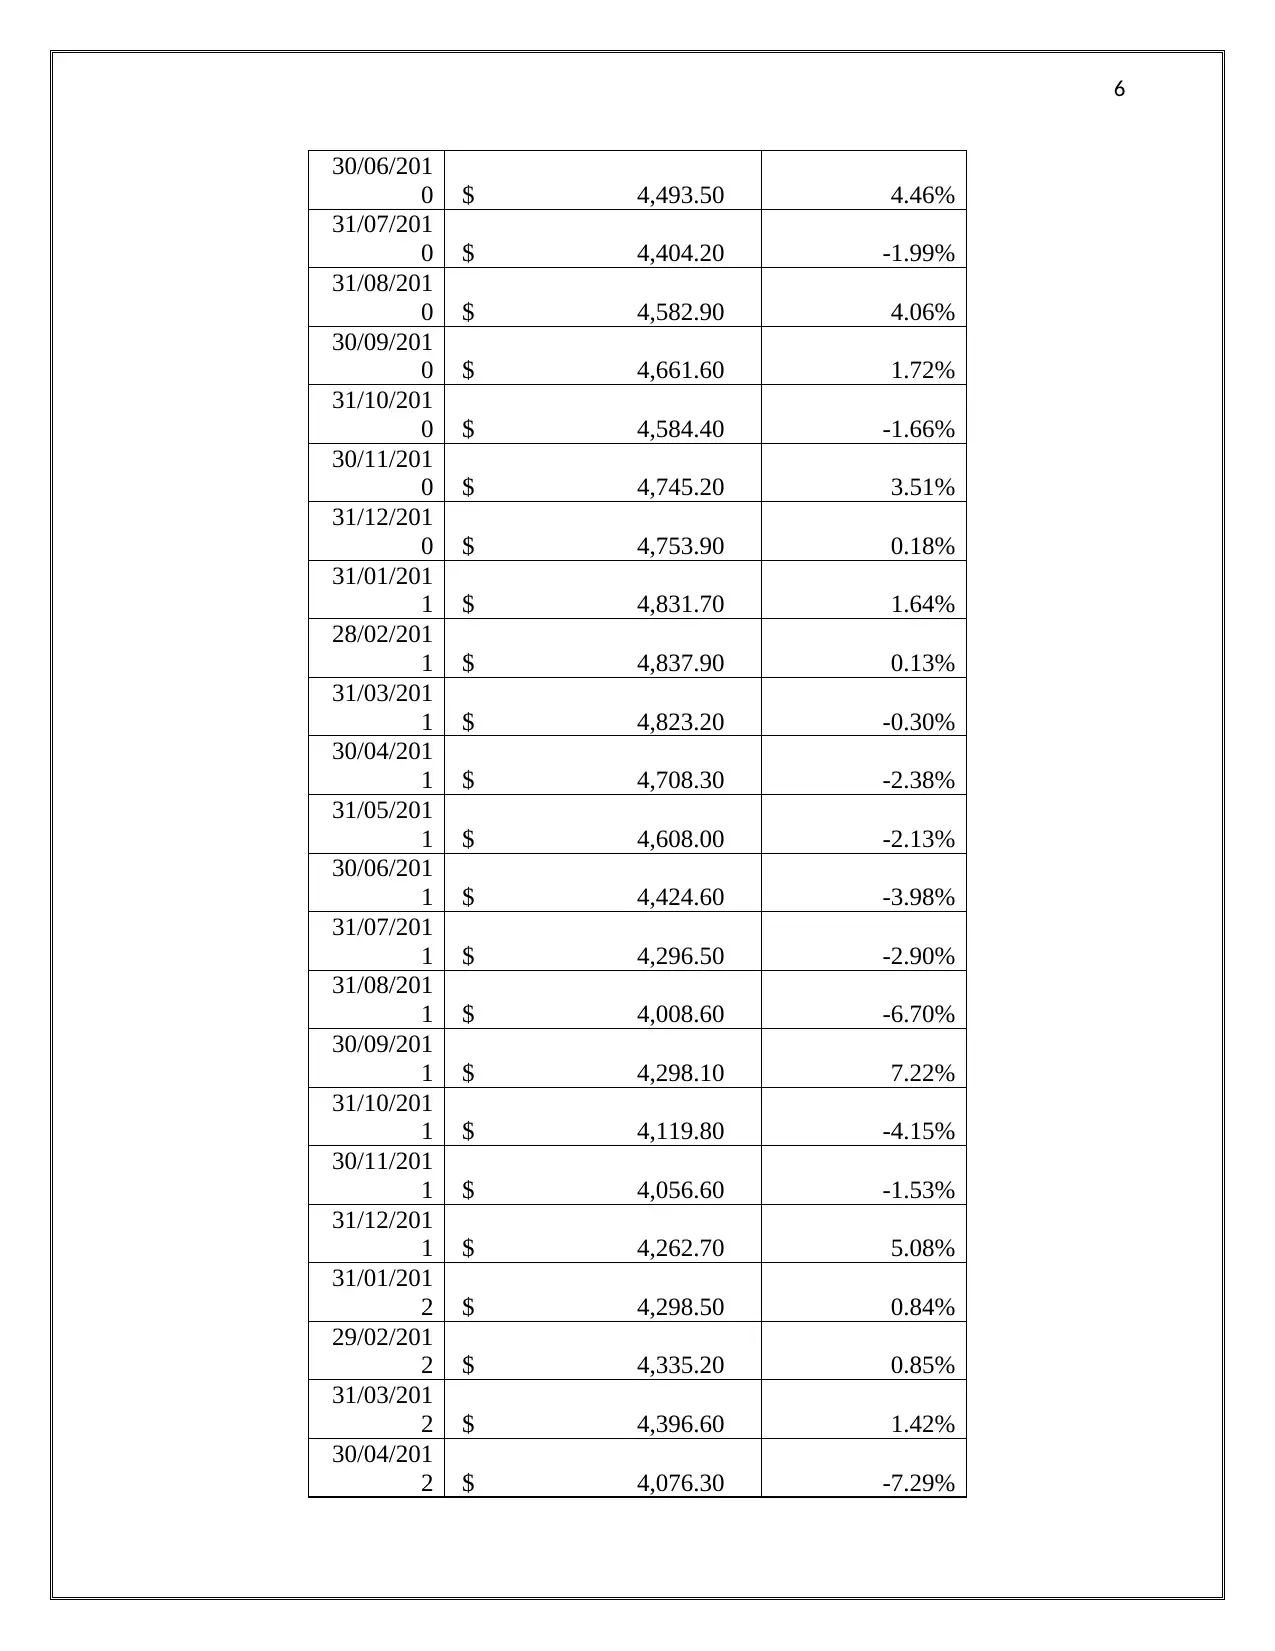
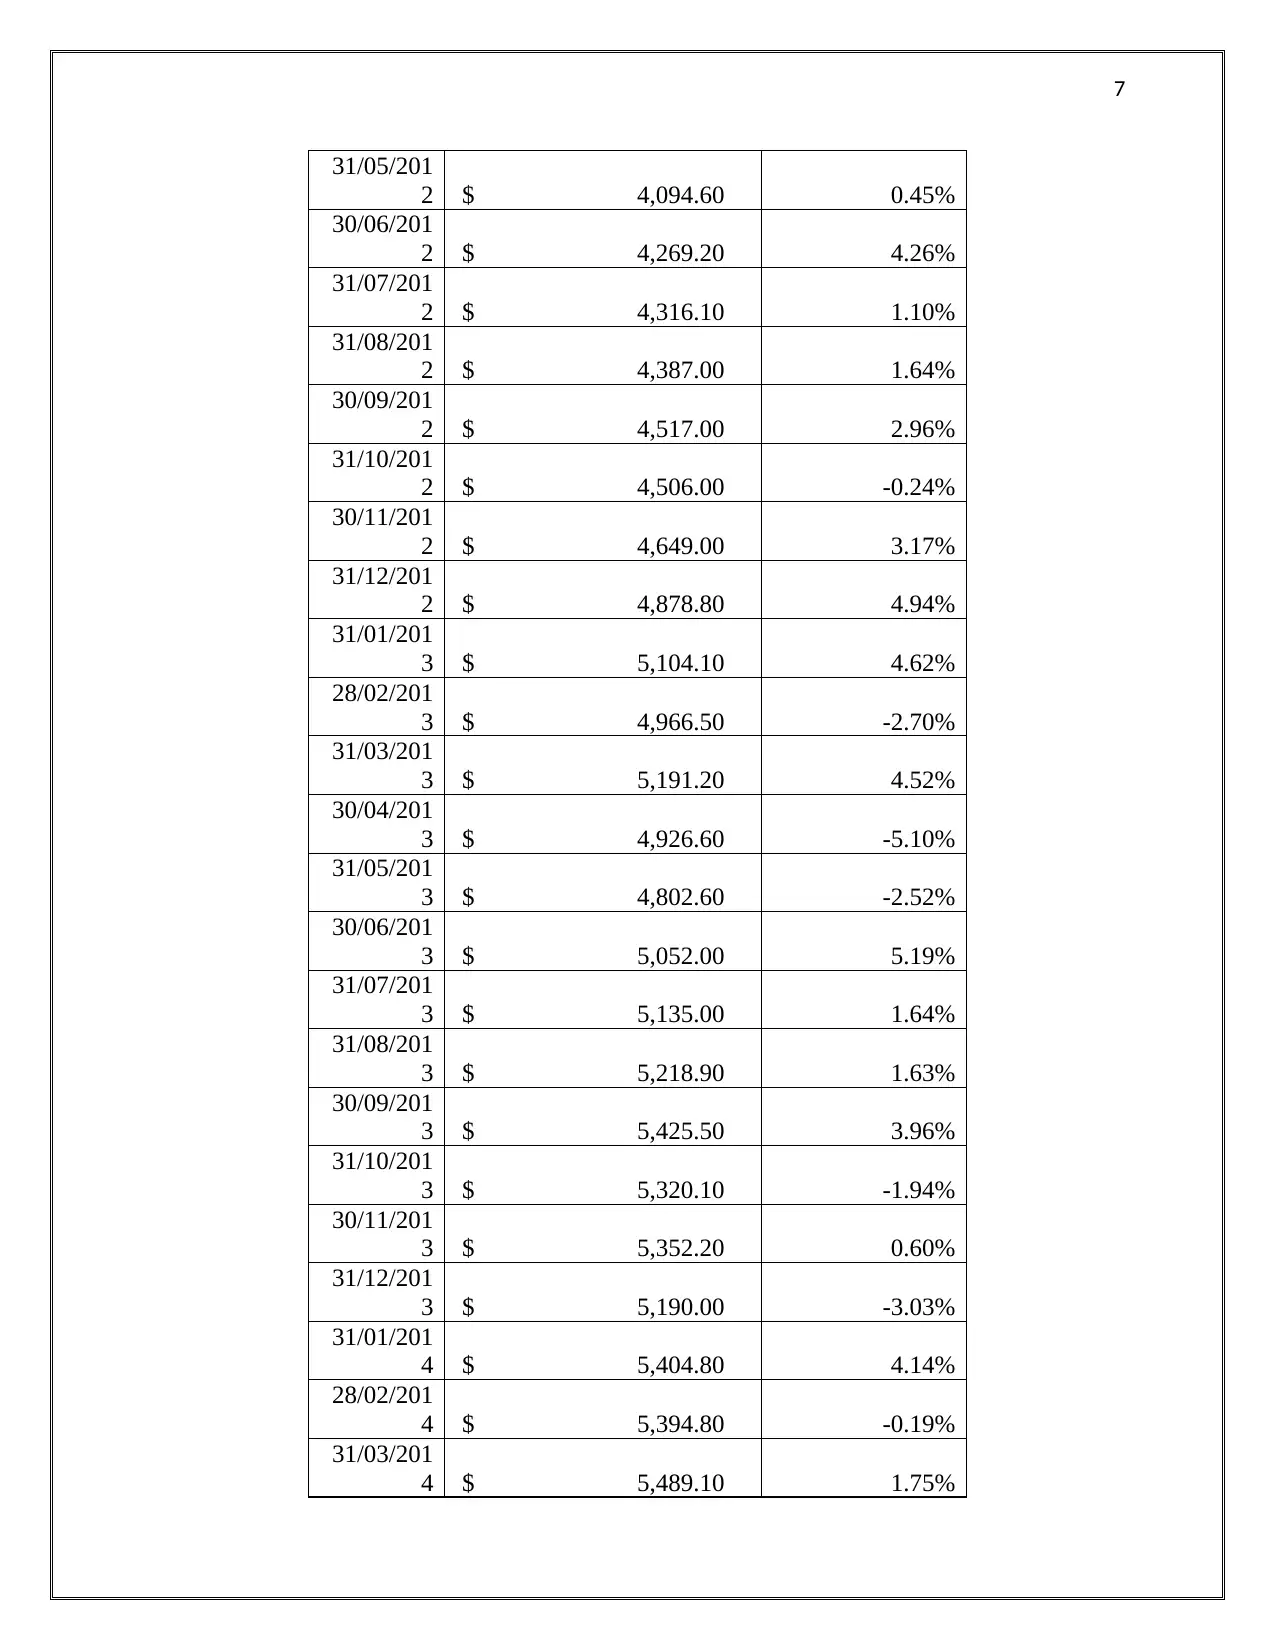
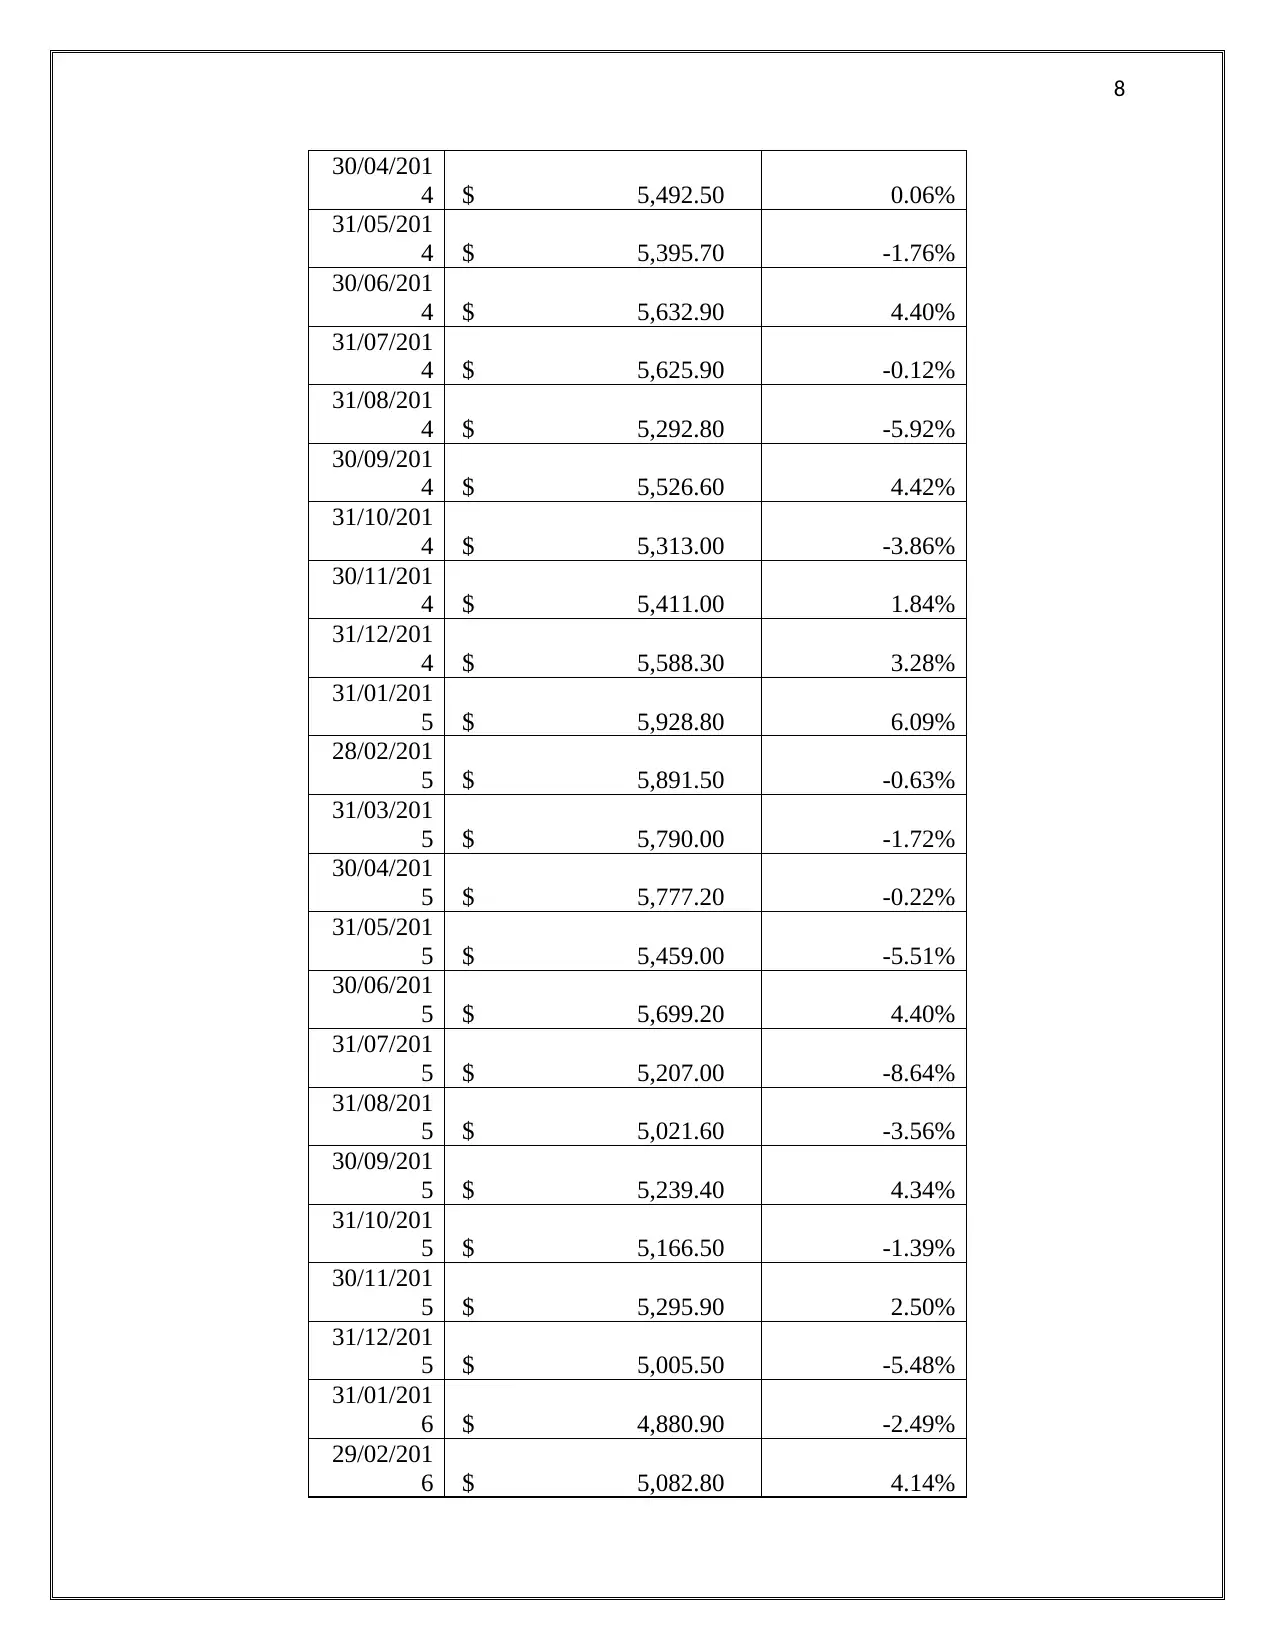
Monthly index price of ASX200 has taken from 1Aug, 2008 to 31 July, 2018 (Period of 10
years). Below table reflects the market index price of ASX200:
Date Index price of ASX200 ASX200
Adjusted Close Monthly Return
‘D’ represents the market value of debt capital
‘V’ is the sum of equity and debt capital
‘Re’ is the rate of cost of equity capital
‘Rd’ is the rate of cost of debt capital
‘Tc’ is the tax rate
The formula used to derive weighted average cost of capital of Nufarm Limited, requires
calculation and extraction of various financial items such as cost of equity, cost of debt, weight
of equity capital and weight of debt capital. There is need to employ appropriate technique to
estimate the all these values. So, process of calculation of weighted average cost of capital of
Nufarm Limited has been divided into three parts and they are as follows:
Part 1: Estimation of cost of equity and cost of debt
Cost of Equity
The most appropriate method used to calculate the cost of equity is capital asset pricing
model as this method takes in account the systematic risk and market return for estimation of
equity capital.
Formula of CAPM model: Risk Free rate + Beta*Market Risk Premium
A) Risk free rate: Risk free rate of return refers to the rate of return provided on the risk free
securities such as government bonds and any security that guarantee fixed rate of return on the
investment. So, it has been decided to use risk free rate of return as provided on Australian
Government Bond having maturity of 10 year. Capital market yield provided by 10 year
Australian Government bond has been used as the proxy for risk free rate of return. Reserve bank
of Australia issue government bonds and provide the capital yield (Interest rates) on their
website. Interest rate on 10 years Australian Government Bond as on 31st July, 2018 was 2.65%
(Reserve Bank of Australia, 2019). The reason why interest rate has been selected for date 31st
July, 2018, is because Nufarm Limited publishes its balance sheet figures on the same date. It
will help to calculate the cost of equity and weight of equity capital on same date.
B) Market equity premium rate of return: The present section has calculated the market rate
with the application of historical market premium method. The method involves calculating the
average market return for the past 10 years. As such, this involves identifying the market index
on which of Nufarm Limited is being traded. The company is traded on the ASX and is listed
under ASX 200 index. Monthly market data of ASX200 has been gathered for last 10 years and
average of yearly returns has been taken to calculate the market risk premium of ASX200.
Monthly index price of ASX200 has taken from 1Aug, 2008 to 31 July, 2018 (Period of 10
years). Below table reflects the market index price of ASX200:
Date Index price of ASX200 ASX200
Adjusted Close Monthly Return
Paraphrase This Document
Need a fresh take? Get an instant paraphrase of this document with our AI Paraphraser
5
31/07/200
8 $ 5,135.60
31/08/200
8 $ 4,600.50 -10.42%
30/09/200
8 $ 4,018.00 -12.66%
31/10/200
8 $ 3,742.50 -6.86%
30/11/200
8 $ 3,722.30 -0.54%
31/12/200
8 $ 3,540.70 -4.88%
31/01/200
9 $ 3,344.50 -5.54%
28/02/200
9 $ 3,582.10 7.10%
31/03/200
9 $ 3,780.50 5.54%
30/04/200
9 $ 3,818.00 0.99%
31/05/200
9 $ 3,954.90 3.59%
30/06/200
9 $ 4,244.00 7.31%
31/07/200
9 $ 4,479.10 5.54%
31/08/200
9 $ 4,743.60 5.91%
30/09/200
9 $ 4,643.20 -2.12%
31/10/200
9 $ 4,701.40 1.25%
30/11/200
9 $ 4,870.60 3.60%
31/12/200
9 $ 4,569.60 -6.18%
31/01/201
0 $ 4,637.70 1.49%
28/02/201
0 $ 4,875.50 5.13%
31/03/201
0 $ 4,807.40 -1.40%
30/04/201
0 $ 4,429.70 -7.86%
31/05/201
0 $ 4,301.50 -2.89%
31/07/200
8 $ 5,135.60
31/08/200
8 $ 4,600.50 -10.42%
30/09/200
8 $ 4,018.00 -12.66%
31/10/200
8 $ 3,742.50 -6.86%
30/11/200
8 $ 3,722.30 -0.54%
31/12/200
8 $ 3,540.70 -4.88%
31/01/200
9 $ 3,344.50 -5.54%
28/02/200
9 $ 3,582.10 7.10%
31/03/200
9 $ 3,780.50 5.54%
30/04/200
9 $ 3,818.00 0.99%
31/05/200
9 $ 3,954.90 3.59%
30/06/200
9 $ 4,244.00 7.31%
31/07/200
9 $ 4,479.10 5.54%
31/08/200
9 $ 4,743.60 5.91%
30/09/200
9 $ 4,643.20 -2.12%
31/10/200
9 $ 4,701.40 1.25%
30/11/200
9 $ 4,870.60 3.60%
31/12/200
9 $ 4,569.60 -6.18%
31/01/201
0 $ 4,637.70 1.49%
28/02/201
0 $ 4,875.50 5.13%
31/03/201
0 $ 4,807.40 -1.40%
30/04/201
0 $ 4,429.70 -7.86%
31/05/201
0 $ 4,301.50 -2.89%
6
30/06/201
0 $ 4,493.50 4.46%
31/07/201
0 $ 4,404.20 -1.99%
31/08/201
0 $ 4,582.90 4.06%
30/09/201
0 $ 4,661.60 1.72%
31/10/201
0 $ 4,584.40 -1.66%
30/11/201
0 $ 4,745.20 3.51%
31/12/201
0 $ 4,753.90 0.18%
31/01/201
1 $ 4,831.70 1.64%
28/02/201
1 $ 4,837.90 0.13%
31/03/201
1 $ 4,823.20 -0.30%
30/04/201
1 $ 4,708.30 -2.38%
31/05/201
1 $ 4,608.00 -2.13%
30/06/201
1 $ 4,424.60 -3.98%
31/07/201
1 $ 4,296.50 -2.90%
31/08/201
1 $ 4,008.60 -6.70%
30/09/201
1 $ 4,298.10 7.22%
31/10/201
1 $ 4,119.80 -4.15%
30/11/201
1 $ 4,056.60 -1.53%
31/12/201
1 $ 4,262.70 5.08%
31/01/201
2 $ 4,298.50 0.84%
29/02/201
2 $ 4,335.20 0.85%
31/03/201
2 $ 4,396.60 1.42%
30/04/201
2 $ 4,076.30 -7.29%
30/06/201
0 $ 4,493.50 4.46%
31/07/201
0 $ 4,404.20 -1.99%
31/08/201
0 $ 4,582.90 4.06%
30/09/201
0 $ 4,661.60 1.72%
31/10/201
0 $ 4,584.40 -1.66%
30/11/201
0 $ 4,745.20 3.51%
31/12/201
0 $ 4,753.90 0.18%
31/01/201
1 $ 4,831.70 1.64%
28/02/201
1 $ 4,837.90 0.13%
31/03/201
1 $ 4,823.20 -0.30%
30/04/201
1 $ 4,708.30 -2.38%
31/05/201
1 $ 4,608.00 -2.13%
30/06/201
1 $ 4,424.60 -3.98%
31/07/201
1 $ 4,296.50 -2.90%
31/08/201
1 $ 4,008.60 -6.70%
30/09/201
1 $ 4,298.10 7.22%
31/10/201
1 $ 4,119.80 -4.15%
30/11/201
1 $ 4,056.60 -1.53%
31/12/201
1 $ 4,262.70 5.08%
31/01/201
2 $ 4,298.50 0.84%
29/02/201
2 $ 4,335.20 0.85%
31/03/201
2 $ 4,396.60 1.42%
30/04/201
2 $ 4,076.30 -7.29%
⊘ This is a preview!⊘
Do you want full access?
Subscribe today to unlock all pages.
Trusted by 1+ million students worldwide
7
31/05/201
2 $ 4,094.60 0.45%
30/06/201
2 $ 4,269.20 4.26%
31/07/201
2 $ 4,316.10 1.10%
31/08/201
2 $ 4,387.00 1.64%
30/09/201
2 $ 4,517.00 2.96%
31/10/201
2 $ 4,506.00 -0.24%
30/11/201
2 $ 4,649.00 3.17%
31/12/201
2 $ 4,878.80 4.94%
31/01/201
3 $ 5,104.10 4.62%
28/02/201
3 $ 4,966.50 -2.70%
31/03/201
3 $ 5,191.20 4.52%
30/04/201
3 $ 4,926.60 -5.10%
31/05/201
3 $ 4,802.60 -2.52%
30/06/201
3 $ 5,052.00 5.19%
31/07/201
3 $ 5,135.00 1.64%
31/08/201
3 $ 5,218.90 1.63%
30/09/201
3 $ 5,425.50 3.96%
31/10/201
3 $ 5,320.10 -1.94%
30/11/201
3 $ 5,352.20 0.60%
31/12/201
3 $ 5,190.00 -3.03%
31/01/201
4 $ 5,404.80 4.14%
28/02/201
4 $ 5,394.80 -0.19%
31/03/201
4 $ 5,489.10 1.75%
31/05/201
2 $ 4,094.60 0.45%
30/06/201
2 $ 4,269.20 4.26%
31/07/201
2 $ 4,316.10 1.10%
31/08/201
2 $ 4,387.00 1.64%
30/09/201
2 $ 4,517.00 2.96%
31/10/201
2 $ 4,506.00 -0.24%
30/11/201
2 $ 4,649.00 3.17%
31/12/201
2 $ 4,878.80 4.94%
31/01/201
3 $ 5,104.10 4.62%
28/02/201
3 $ 4,966.50 -2.70%
31/03/201
3 $ 5,191.20 4.52%
30/04/201
3 $ 4,926.60 -5.10%
31/05/201
3 $ 4,802.60 -2.52%
30/06/201
3 $ 5,052.00 5.19%
31/07/201
3 $ 5,135.00 1.64%
31/08/201
3 $ 5,218.90 1.63%
30/09/201
3 $ 5,425.50 3.96%
31/10/201
3 $ 5,320.10 -1.94%
30/11/201
3 $ 5,352.20 0.60%
31/12/201
3 $ 5,190.00 -3.03%
31/01/201
4 $ 5,404.80 4.14%
28/02/201
4 $ 5,394.80 -0.19%
31/03/201
4 $ 5,489.10 1.75%
Paraphrase This Document
Need a fresh take? Get an instant paraphrase of this document with our AI Paraphraser
8
30/04/201
4 $ 5,492.50 0.06%
31/05/201
4 $ 5,395.70 -1.76%
30/06/201
4 $ 5,632.90 4.40%
31/07/201
4 $ 5,625.90 -0.12%
31/08/201
4 $ 5,292.80 -5.92%
30/09/201
4 $ 5,526.60 4.42%
31/10/201
4 $ 5,313.00 -3.86%
30/11/201
4 $ 5,411.00 1.84%
31/12/201
4 $ 5,588.30 3.28%
31/01/201
5 $ 5,928.80 6.09%
28/02/201
5 $ 5,891.50 -0.63%
31/03/201
5 $ 5,790.00 -1.72%
30/04/201
5 $ 5,777.20 -0.22%
31/05/201
5 $ 5,459.00 -5.51%
30/06/201
5 $ 5,699.20 4.40%
31/07/201
5 $ 5,207.00 -8.64%
31/08/201
5 $ 5,021.60 -3.56%
30/09/201
5 $ 5,239.40 4.34%
31/10/201
5 $ 5,166.50 -1.39%
30/11/201
5 $ 5,295.90 2.50%
31/12/201
5 $ 5,005.50 -5.48%
31/01/201
6 $ 4,880.90 -2.49%
29/02/201
6 $ 5,082.80 4.14%
30/04/201
4 $ 5,492.50 0.06%
31/05/201
4 $ 5,395.70 -1.76%
30/06/201
4 $ 5,632.90 4.40%
31/07/201
4 $ 5,625.90 -0.12%
31/08/201
4 $ 5,292.80 -5.92%
30/09/201
4 $ 5,526.60 4.42%
31/10/201
4 $ 5,313.00 -3.86%
30/11/201
4 $ 5,411.00 1.84%
31/12/201
4 $ 5,588.30 3.28%
31/01/201
5 $ 5,928.80 6.09%
28/02/201
5 $ 5,891.50 -0.63%
31/03/201
5 $ 5,790.00 -1.72%
30/04/201
5 $ 5,777.20 -0.22%
31/05/201
5 $ 5,459.00 -5.51%
30/06/201
5 $ 5,699.20 4.40%
31/07/201
5 $ 5,207.00 -8.64%
31/08/201
5 $ 5,021.60 -3.56%
30/09/201
5 $ 5,239.40 4.34%
31/10/201
5 $ 5,166.50 -1.39%
30/11/201
5 $ 5,295.90 2.50%
31/12/201
5 $ 5,005.50 -5.48%
31/01/201
6 $ 4,880.90 -2.49%
29/02/201
6 $ 5,082.80 4.14%
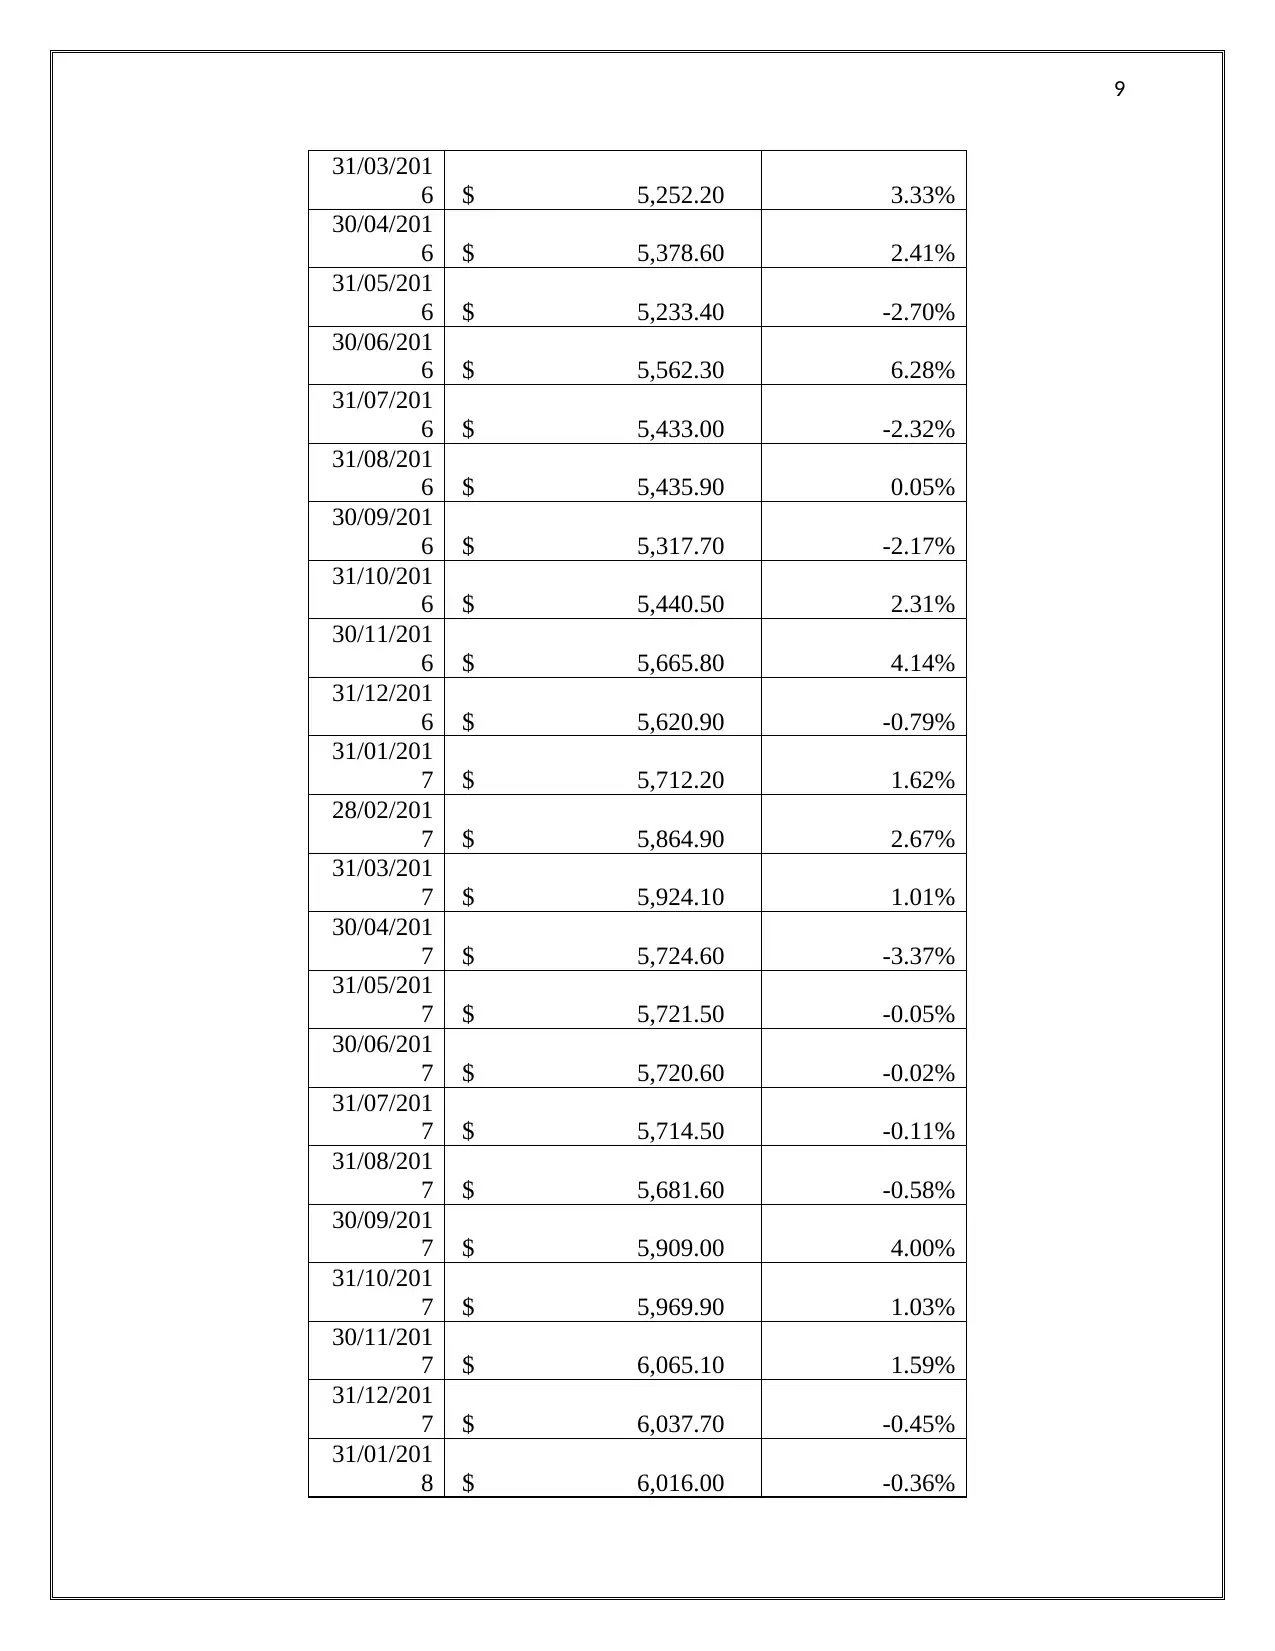
9
31/03/201
6 $ 5,252.20 3.33%
30/04/201
6 $ 5,378.60 2.41%
31/05/201
6 $ 5,233.40 -2.70%
30/06/201
6 $ 5,562.30 6.28%
31/07/201
6 $ 5,433.00 -2.32%
31/08/201
6 $ 5,435.90 0.05%
30/09/201
6 $ 5,317.70 -2.17%
31/10/201
6 $ 5,440.50 2.31%
30/11/201
6 $ 5,665.80 4.14%
31/12/201
6 $ 5,620.90 -0.79%
31/01/201
7 $ 5,712.20 1.62%
28/02/201
7 $ 5,864.90 2.67%
31/03/201
7 $ 5,924.10 1.01%
30/04/201
7 $ 5,724.60 -3.37%
31/05/201
7 $ 5,721.50 -0.05%
30/06/201
7 $ 5,720.60 -0.02%
31/07/201
7 $ 5,714.50 -0.11%
31/08/201
7 $ 5,681.60 -0.58%
30/09/201
7 $ 5,909.00 4.00%
31/10/201
7 $ 5,969.90 1.03%
30/11/201
7 $ 6,065.10 1.59%
31/12/201
7 $ 6,037.70 -0.45%
31/01/201
8 $ 6,016.00 -0.36%
31/03/201
6 $ 5,252.20 3.33%
30/04/201
6 $ 5,378.60 2.41%
31/05/201
6 $ 5,233.40 -2.70%
30/06/201
6 $ 5,562.30 6.28%
31/07/201
6 $ 5,433.00 -2.32%
31/08/201
6 $ 5,435.90 0.05%
30/09/201
6 $ 5,317.70 -2.17%
31/10/201
6 $ 5,440.50 2.31%
30/11/201
6 $ 5,665.80 4.14%
31/12/201
6 $ 5,620.90 -0.79%
31/01/201
7 $ 5,712.20 1.62%
28/02/201
7 $ 5,864.90 2.67%
31/03/201
7 $ 5,924.10 1.01%
30/04/201
7 $ 5,724.60 -3.37%
31/05/201
7 $ 5,721.50 -0.05%
30/06/201
7 $ 5,720.60 -0.02%
31/07/201
7 $ 5,714.50 -0.11%
31/08/201
7 $ 5,681.60 -0.58%
30/09/201
7 $ 5,909.00 4.00%
31/10/201
7 $ 5,969.90 1.03%
30/11/201
7 $ 6,065.10 1.59%
31/12/201
7 $ 6,037.70 -0.45%
31/01/201
8 $ 6,016.00 -0.36%
⊘ This is a preview!⊘
Do you want full access?
Subscribe today to unlock all pages.
Trusted by 1+ million students worldwide
10
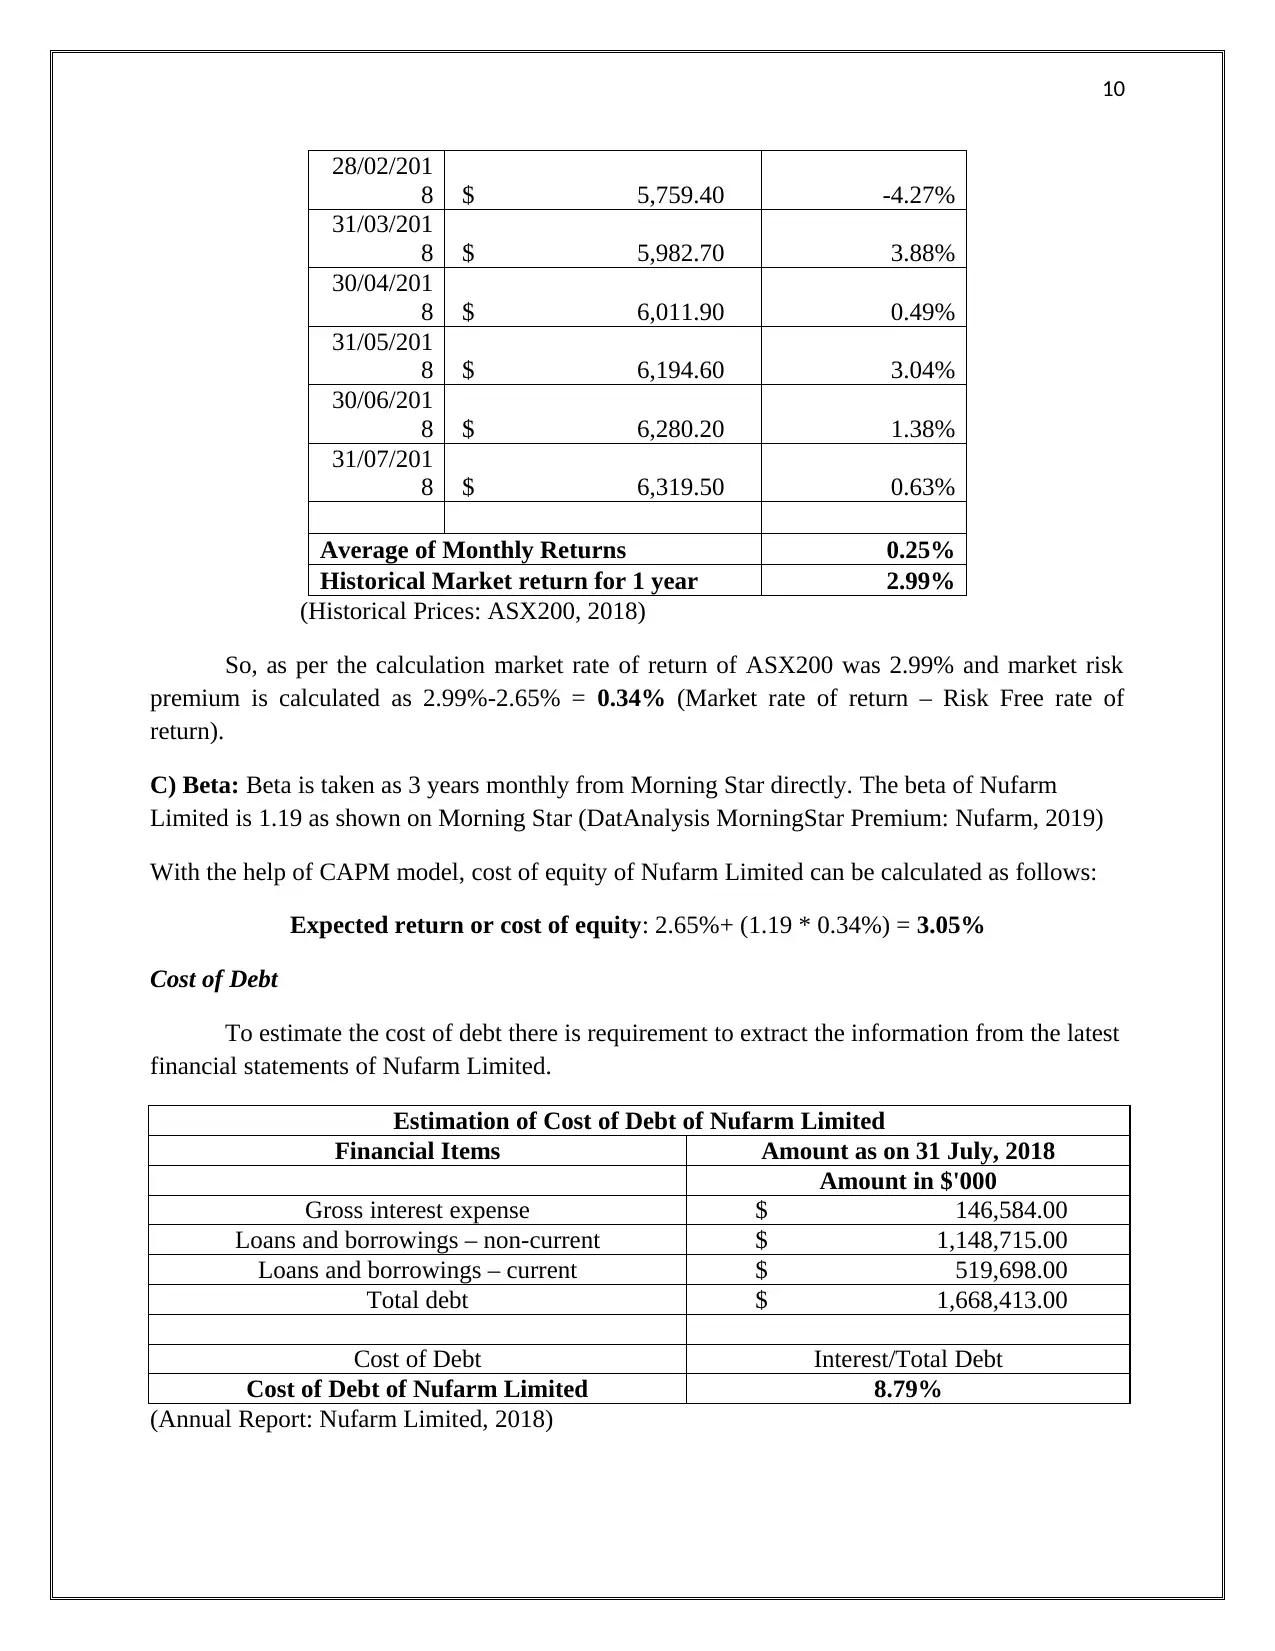
28/02/201
8 $ 5,759.40 -4.27%
31/03/201
8 $ 5,982.70 3.88%
30/04/201
8 $ 6,011.90 0.49%
31/05/201
8 $ 6,194.60 3.04%
30/06/201
8 $ 6,280.20 1.38%
31/07/201
8 $ 6,319.50 0.63%
Average of Monthly Returns 0.25%
Historical Market return for 1 year 2.99%
(Historical Prices: ASX200, 2018)
So, as per the calculation market rate of return of ASX200 was 2.99% and market risk
premium is calculated as 2.99%-2.65% = 0.34% (Market rate of return – Risk Free rate of
return).
C) Beta: Beta is taken as 3 years monthly from Morning Star directly. The beta of Nufarm
Limited is 1.19 as shown on Morning Star (DatAnalysis MorningStar Premium: Nufarm, 2019)
With the help of CAPM model, cost of equity of Nufarm Limited can be calculated as follows:
Expected return or cost of equity: 2.65%+ (1.19 * 0.34%) = 3.05%
Cost of Debt
To estimate the cost of debt there is requirement to extract the information from the latest
financial statements of Nufarm Limited.
Estimation of Cost of Debt of Nufarm Limited
Financial Items Amount as on 31 July, 2018
Amount in $'000
Gross interest expense $ 146,584.00
Loans and borrowings – non-current $ 1,148,715.00
Loans and borrowings – current $ 519,698.00
Total debt $ 1,668,413.00
Cost of Debt Interest/Total Debt
Cost of Debt of Nufarm Limited 8.79%
(Annual Report: Nufarm Limited, 2018)
Paraphrase This Document
Need a fresh take? Get an instant paraphrase of this document with our AI Paraphraser
11
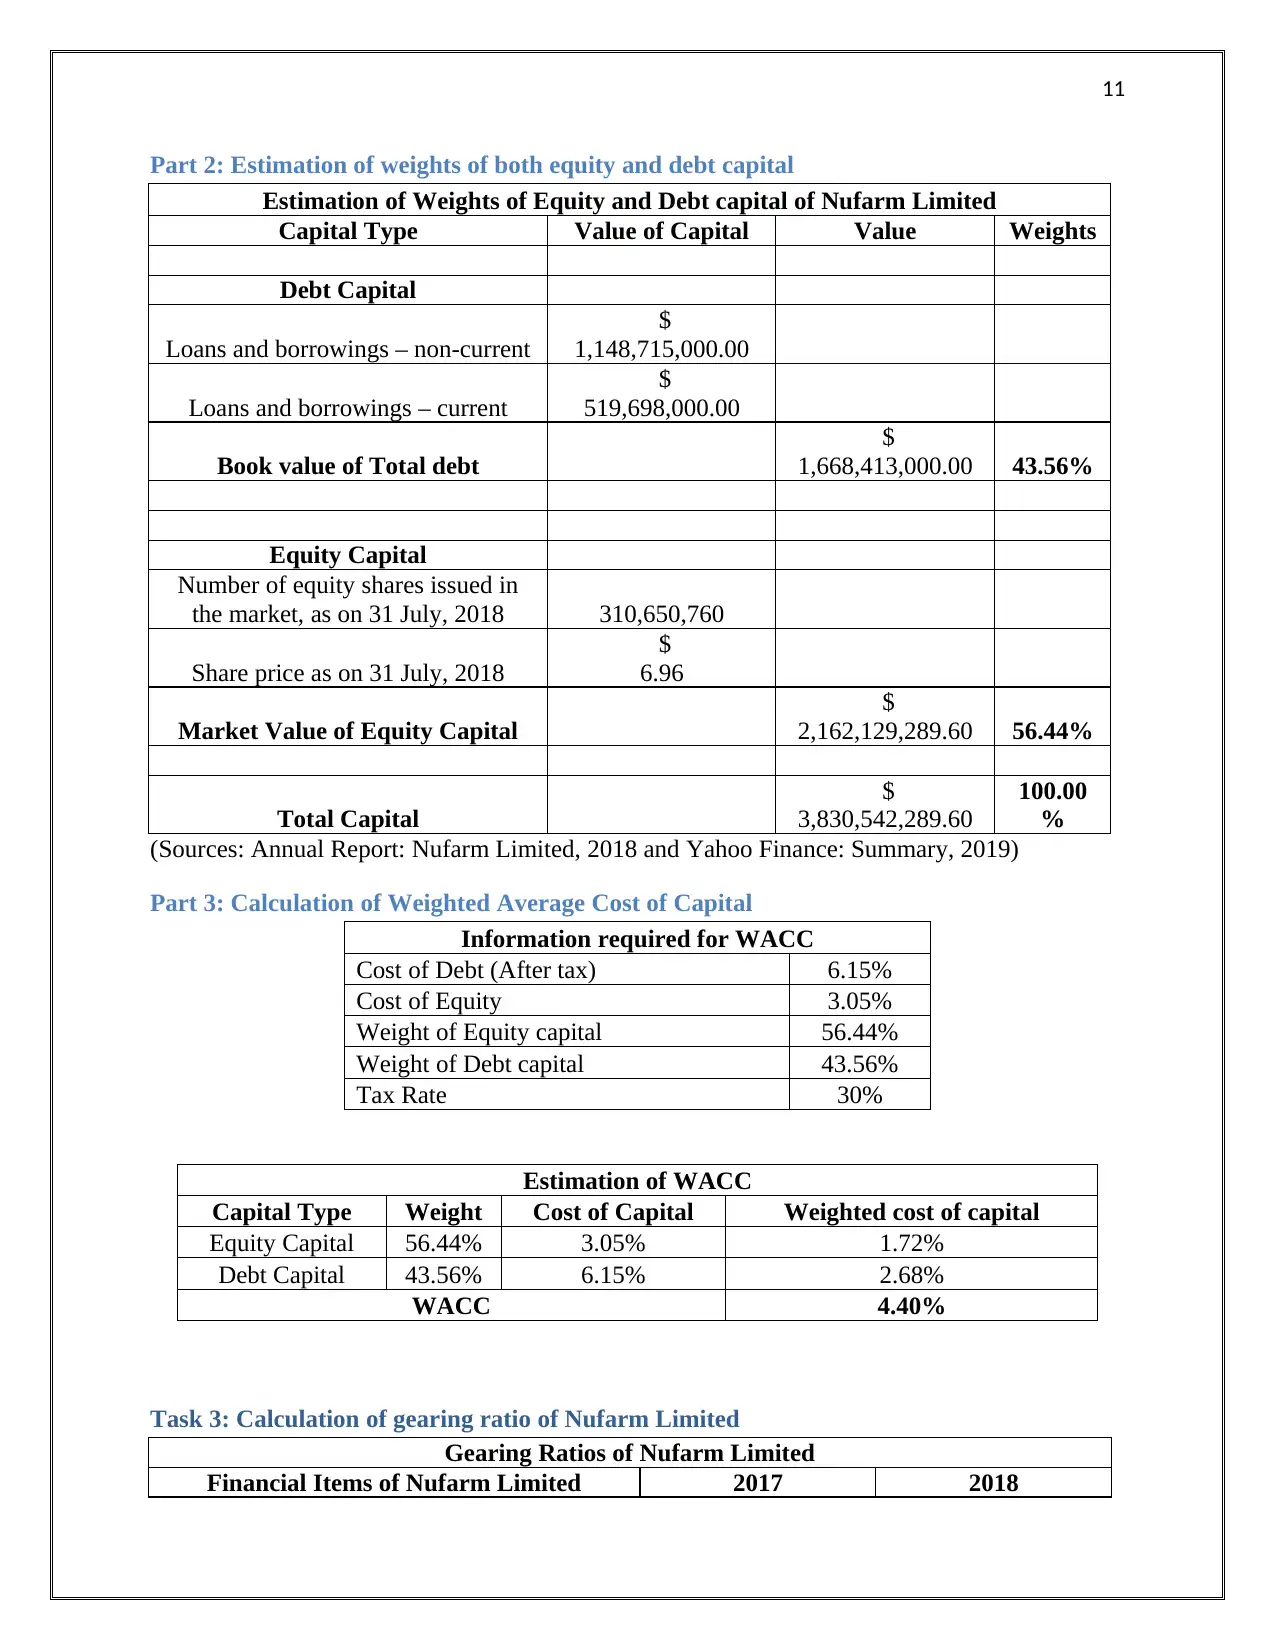
Part 2: Estimation of weights of both equity and debt capital
Estimation of Weights of Equity and Debt capital of Nufarm Limited
Capital Type Value of Capital Value Weights
Debt Capital
Loans and borrowings – non-current
$
1,148,715,000.00
Loans and borrowings – current
$
519,698,000.00
Book value of Total debt
$
1,668,413,000.00 43.56%
Equity Capital
Number of equity shares issued in
the market, as on 31 July, 2018 310,650,760
Share price as on 31 July, 2018
$
6.96
Market Value of Equity Capital
$
2,162,129,289.60 56.44%
Total Capital
$
3,830,542,289.60
100.00
%
(Sources: Annual Report: Nufarm Limited, 2018 and Yahoo Finance: Summary, 2019)
Part 3: Calculation of Weighted Average Cost of Capital
Information required for WACC
Cost of Debt (After tax) 6.15%
Cost of Equity 3.05%
Weight of Equity capital 56.44%
Weight of Debt capital 43.56%
Tax Rate 30%
Estimation of WACC
Capital Type Weight Cost of Capital Weighted cost of capital
Equity Capital 56.44% 3.05% 1.72%
Debt Capital 43.56% 6.15% 2.68%
WACC 4.40%
Task 3: Calculation of gearing ratio of Nufarm Limited
Gearing Ratios of Nufarm Limited
Financial Items of Nufarm Limited 2017 2018
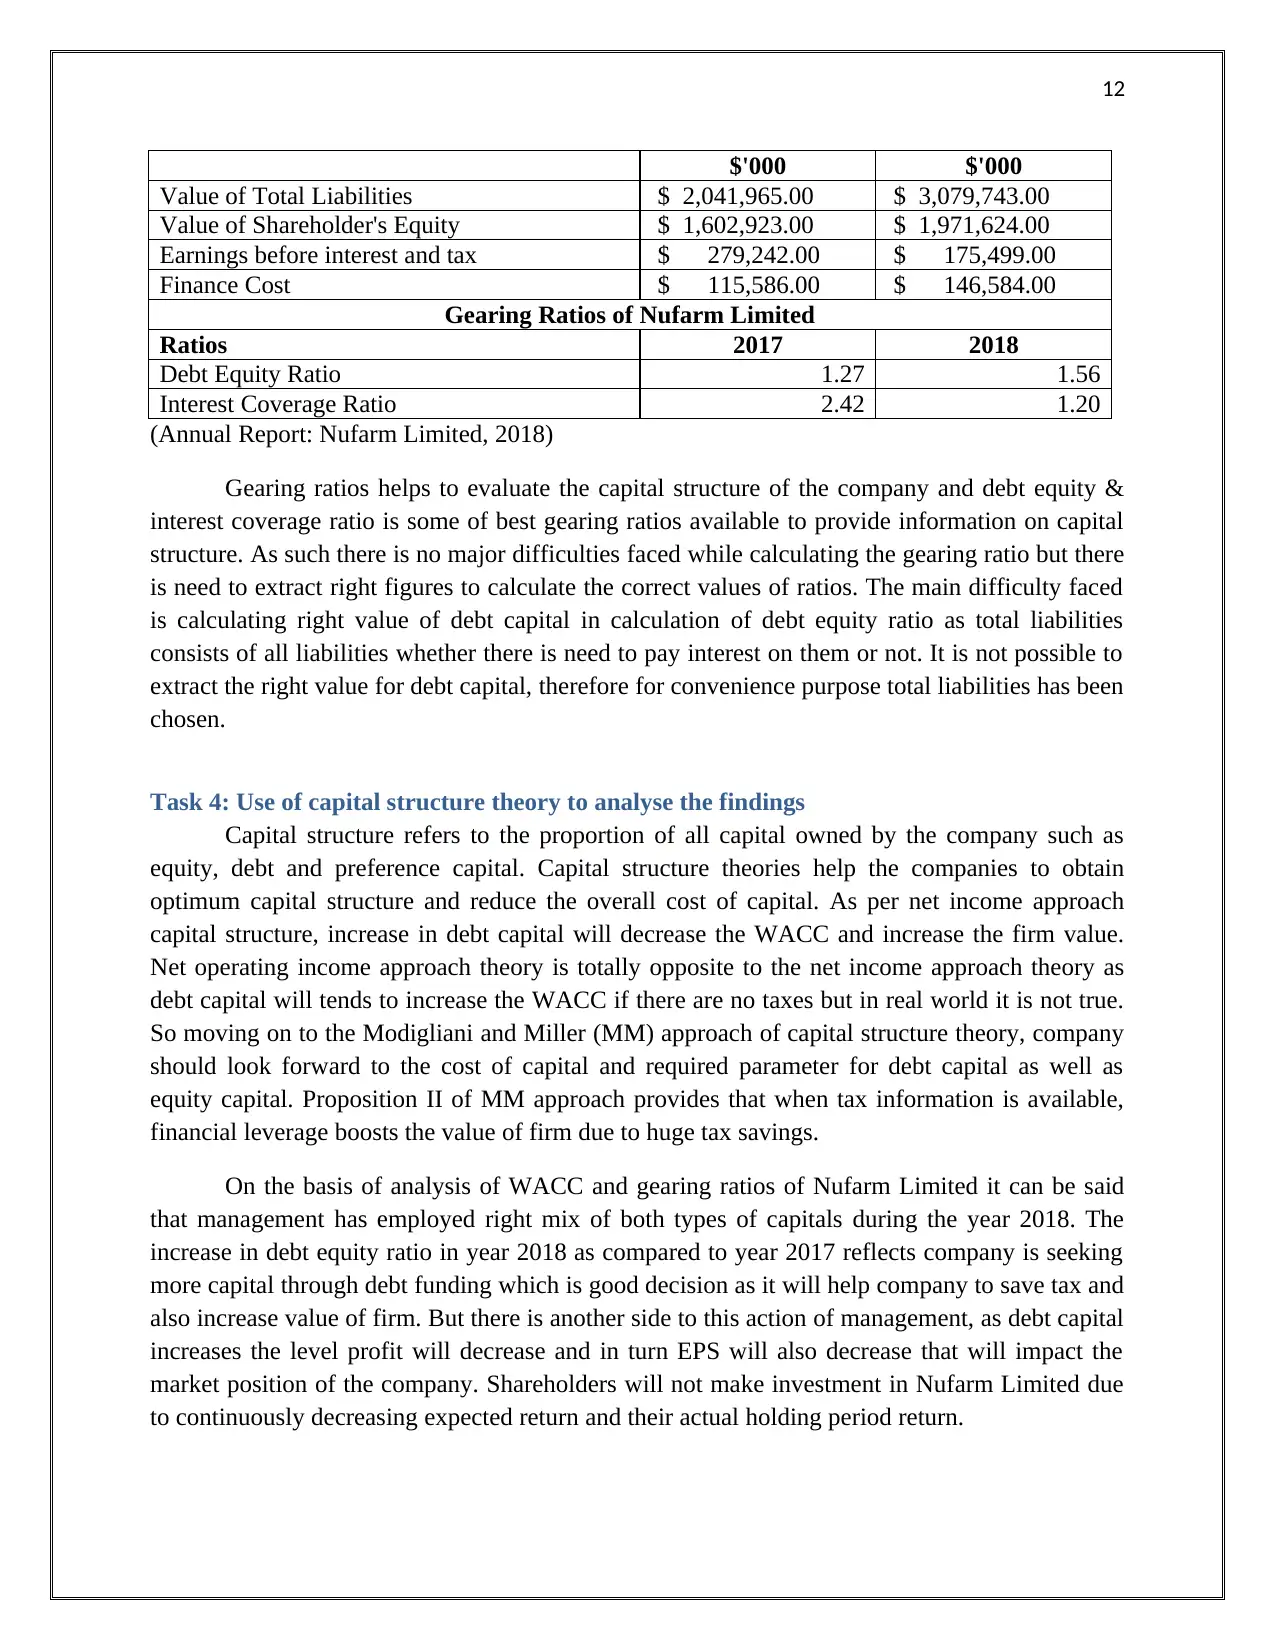
12
$'000 $'000
Value of Total Liabilities $ 2,041,965.00 $ 3,079,743.00
Value of Shareholder's Equity $ 1,602,923.00 $ 1,971,624.00
Earnings before interest and tax $ 279,242.00 $ 175,499.00
Finance Cost $ 115,586.00 $ 146,584.00
Gearing Ratios of Nufarm Limited
Ratios 2017 2018
Debt Equity Ratio 1.27 1.56
Interest Coverage Ratio 2.42 1.20
(Annual Report: Nufarm Limited, 2018)
Gearing ratios helps to evaluate the capital structure of the company and debt equity &
interest coverage ratio is some of best gearing ratios available to provide information on capital
structure. As such there is no major difficulties faced while calculating the gearing ratio but there
is need to extract right figures to calculate the correct values of ratios. The main difficulty faced
is calculating right value of debt capital in calculation of debt equity ratio as total liabilities
consists of all liabilities whether there is need to pay interest on them or not. It is not possible to
extract the right value for debt capital, therefore for convenience purpose total liabilities has been
chosen.
Task 4: Use of capital structure theory to analyse the findings
Capital structure refers to the proportion of all capital owned by the company such as
equity, debt and preference capital. Capital structure theories help the companies to obtain
optimum capital structure and reduce the overall cost of capital. As per net income approach
capital structure, increase in debt capital will decrease the WACC and increase the firm value.
Net operating income approach theory is totally opposite to the net income approach theory as
debt capital will tends to increase the WACC if there are no taxes but in real world it is not true.
So moving on to the Modigliani and Miller (MM) approach of capital structure theory, company
should look forward to the cost of capital and required parameter for debt capital as well as
equity capital. Proposition II of MM approach provides that when tax information is available,
financial leverage boosts the value of firm due to huge tax savings.
On the basis of analysis of WACC and gearing ratios of Nufarm Limited it can be said
that management has employed right mix of both types of capitals during the year 2018. The
increase in debt equity ratio in year 2018 as compared to year 2017 reflects company is seeking
more capital through debt funding which is good decision as it will help company to save tax and
also increase value of firm. But there is another side to this action of management, as debt capital
increases the level profit will decrease and in turn EPS will also decrease that will impact the
market position of the company. Shareholders will not make investment in Nufarm Limited due
to continuously decreasing expected return and their actual holding period return.
⊘ This is a preview!⊘
Do you want full access?
Subscribe today to unlock all pages.
Trusted by 1+ million students worldwide
1 out of 15
Related Documents


Your All-in-One AI-Powered Toolkit for Academic Success.
+13062052269
info@desklib.com
Available 24*7 on WhatsApp / Email
![[object Object]](/_next/static/media/star-bottom.7253800d.svg)
Unlock your academic potential
Copyright © 2020–2026 A2Z Services. All Rights Reserved. Developed and managed by ZUCOL.