ECOL 203: Life Table Analysis of Black-Striped Wallabies: A Report
VerifiedAdded on 2022/07/29
|8
|1952
|22
Report
AI Summary
This report presents an analysis of a life table constructed for the black-striped wallaby. It begins by explaining the concept of a cohort life table and survivorship curves, comparing the provided data with similar data sets. The analysis highlights the observed patterns of survivorship and mortality within the wallaby population, noting the high mortality rates in early life and the subsequent stabilization before a decline in later years. The report then examines the expectation of further life, indicating the reproductive potential of the population at different ages. Furthermore, it categorizes the survivorship curve of the wallaby, correlating it with the type I survivorship curve, and contrasts it with typical mammalian survivorship. Finally, the report discusses the ecological factors that might explain the under-representation of certain age classes in the sample, including predation, habitat destruction, drought, wildfires, and competition among males.
THE LIFE TABLE OF BLACK-STRIPPED WALLABIES
Name:
Instructor:
Date Presented:
Name:
Instructor:
Date Presented:
Paraphrase This Document
Need a fresh take? Get an instant paraphrase of this document with our AI Paraphraser
2
Question one
Question one
3
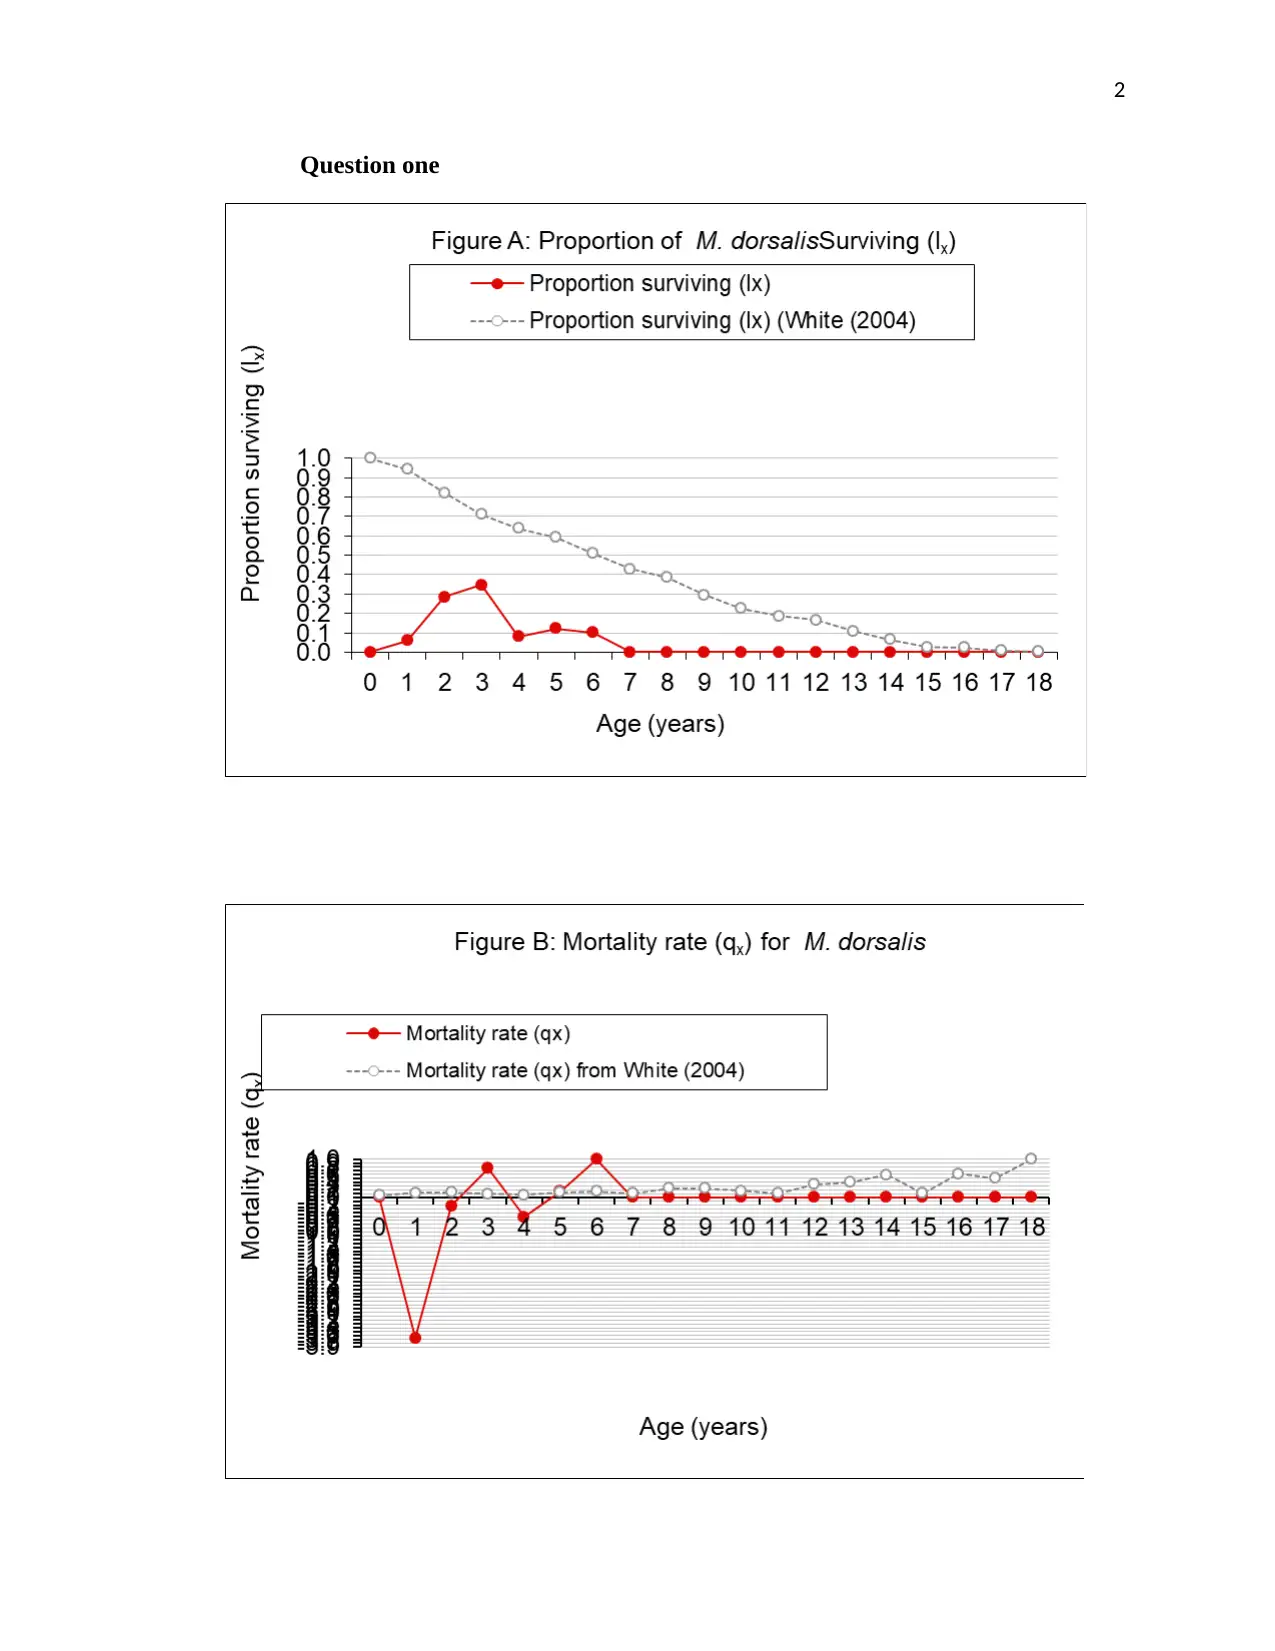
A cohort life table provides detailed information about birth rate, age composition and
death rates of specific populations. The tables are then used to develop survivorship curves
which are graph representations showing the stage survival rates or the fraction of the given
population that survives from one age to the next (Smelser & Baltes 2001). In figure A above
there are similarities in both curves because the highest surviving rate is between the age of 0-2
years after which the rate is decreasing. The lowest surviving rate is at the age of 3 years where
the curve (qx) is descending at a high rate. This may indicate that most of the young ones died
from predators after they left their mothers’ pouches. After the age of 3 years, the survivorship
curve is a little stable which means after the age of 3 years, the animals have already adapted to
the environment and they were able to survive for a while. After the age of 6 years, the
survivorship decreases considerably and constantly, which means after this age, most of the
animals died and just a few died of the old age.
The figure B above shows the mortality rate or the death rate of the animals. From the
graph, we can conclude that minimal or no animals died below the age of 2 years because the
mortality (qx) was below the x-axis and the curve (qx from white) was constant on the x-axis. It
is clear that most animals from our population died at the age of 3 years and the age of 6 years
since the curve is at the highest level. The major difference in the graphs is that the animals from
the Whites’s population sample had a constant mortality rate at the young ages up to the age of 7
years and the mortality rate increased from the age of 13 years. This indicated that most animals
from this population died of the old age.
This data was a reasonable representation of the black-stripped wallaby because it is
believed that these animals can live up to 20 years of age in captivity and may only survive up to
the age of 10 years in the wild(Chilton et.al 2017). In continuation, we can also observe that this
⊘ This is a preview!⊘
Do you want full access?
Subscribe today to unlock all pages.
Trusted by 1+ million students worldwide
4
data had a reasonable representation of the population because from the age of 0-3 years, the rate
of predation is high considering that predators mostly target animals when they are young
because they are an easy target (McHugh, Goldingay,Link, & Letnic 2019). After this age, there
is a possibility of the animals surviving up to the age of 6-10 years of age if they are not killed by
barbwires and natural factors like diseases and drought.
Question 2
The expectation of further life in the life tables indicates the number of animals that
survives to maturity and can reproduce in the next stage. If all the values of the expectation of
further life are summed, the value obtained is the total reproductive rate of the population in
observation (Calver, Lymbery, McComb, & Bamford 2009). Therefore from the data that was
collected for the black-stripped wallaby at the Brigalow Research Station, it is expected that the
animals can live up to the age of six years. Considering the data in our sample life table, 6
animals survived up to the age of 6 years and 1.3 animals could be able to reproduce for further
life and after the age of 6 years, there was only 0.5 animals which could reproduce for further
life. This clearly indicates that almost all the animals died at the age of six years and if any
survived after this age, it didn’t survive to get to the age of 7 years or reproduce for the next
population.
Question 3
Paraphrase This Document
Need a fresh take? Get an instant paraphrase of this document with our AI Paraphraser
5
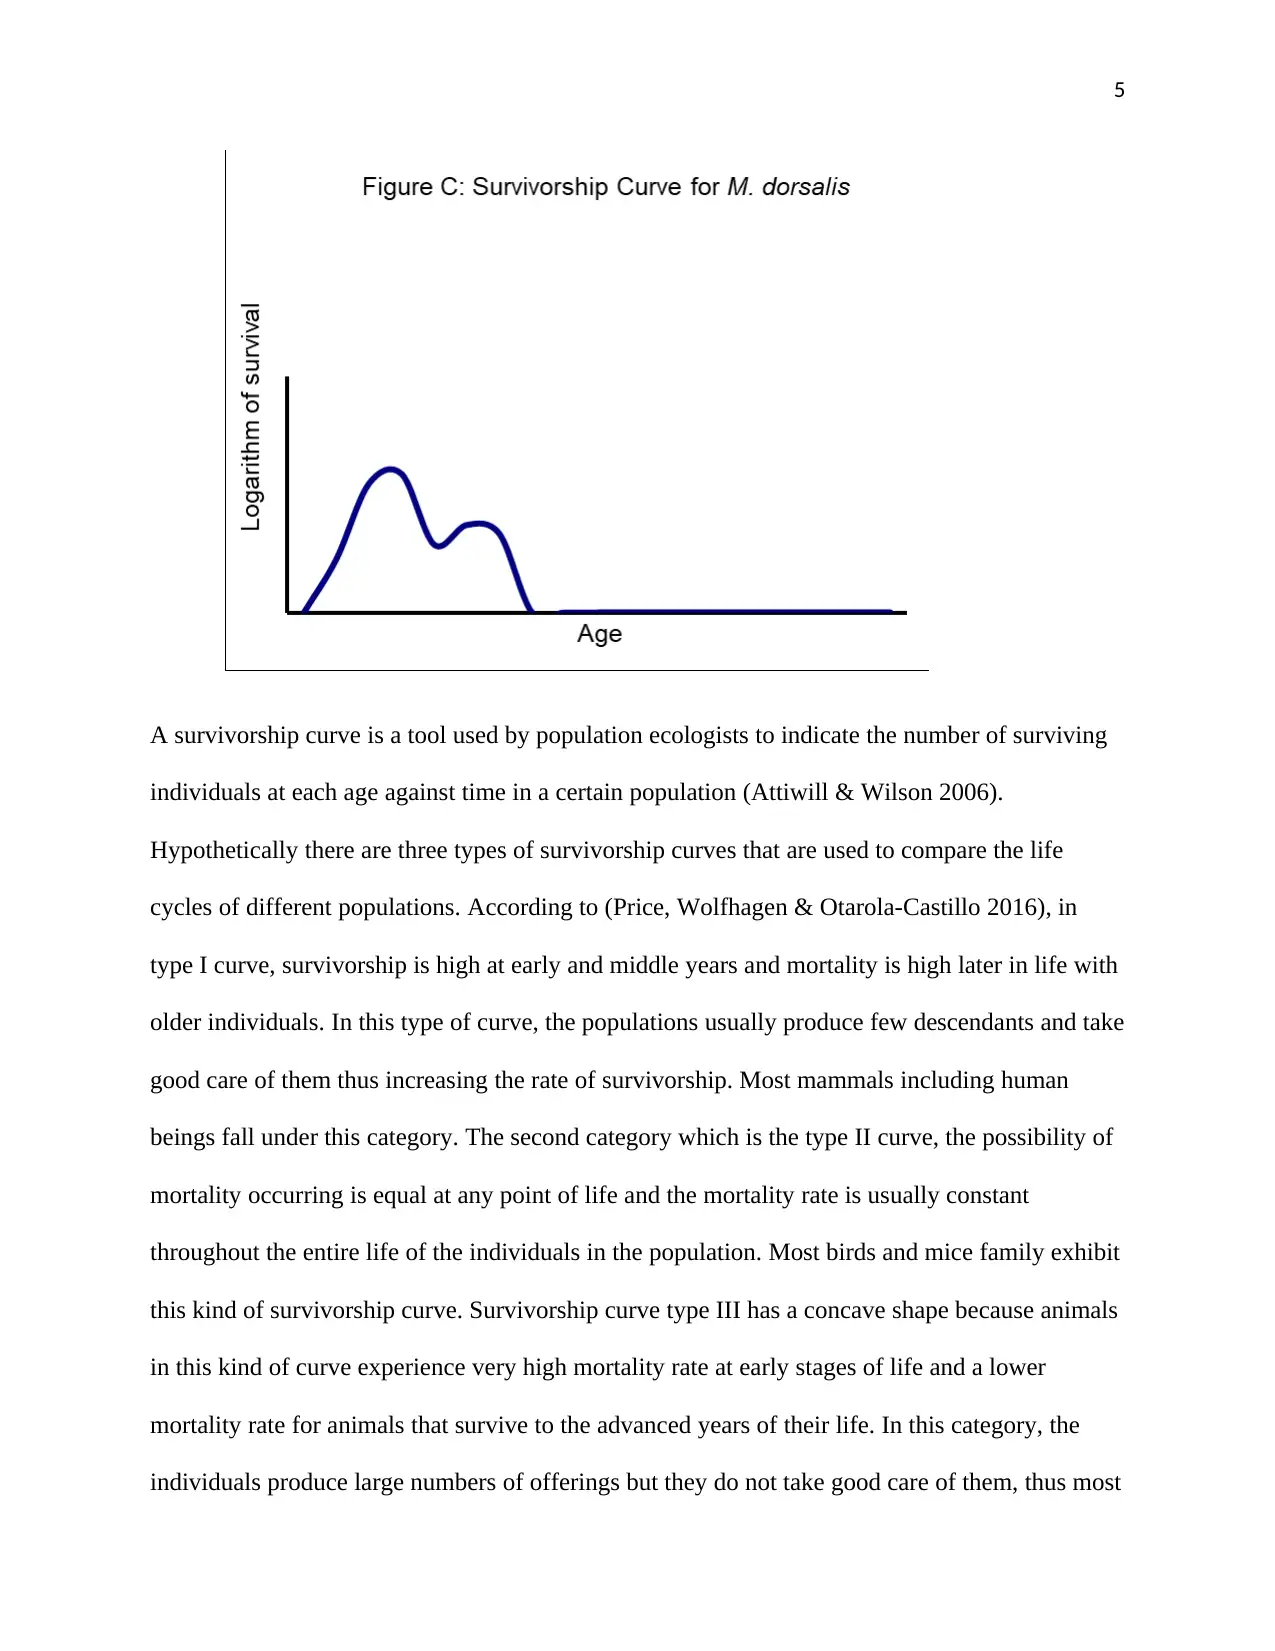
A survivorship curve is a tool used by population ecologists to indicate the number of surviving
individuals at each age against time in a certain population (Attiwill & Wilson 2006).
Hypothetically there are three types of survivorship curves that are used to compare the life
cycles of different populations. According to (Price, Wolfhagen & Otarola-Castillo 2016), in
type I curve, survivorship is high at early and middle years and mortality is high later in life with
older individuals. In this type of curve, the populations usually produce few descendants and take
good care of them thus increasing the rate of survivorship. Most mammals including human
beings fall under this category. The second category which is the type II curve, the possibility of
mortality occurring is equal at any point of life and the mortality rate is usually constant
throughout the entire life of the individuals in the population. Most birds and mice family exhibit
this kind of survivorship curve. Survivorship curve type III has a concave shape because animals
in this kind of curve experience very high mortality rate at early stages of life and a lower
mortality rate for animals that survive to the advanced years of their life. In this category, the
individuals produce large numbers of offerings but they do not take good care of them, thus most
6
of them die at early stages of life. Most marine invertebrates and trees exhibit this type of curve
because a small number of young ones survive but the individuals that make it to the old age
have a possibility of surviving for many years.
The survivorship curve of the black-stripped wallabies that we derived from the data
closely resemble type I curve because it is constantly rising at the early years of the animals and
it only starts to descend at the age of three years. Between the ages of 4-6 years, the curve
remains constant after which it decreases constantly until the age of 7 years and remains constant
throughout the remaining years. This curve does not fit the typical curve of mammals because
the mammal curve remains constant at early and middle life of the animals, and it only decreases
rapidly at later stages of the individuals’ life which means most animals survive at early years
and the mortality rate is high at later in life (Overall & Faragher 2019). Most mammals take good
care of their young ones and that is why the young ones survives to old age and the mortality rate
early in life is low. Macropus dorsalis falls under this category since their young ones or the
joeys are carried in their mothers’ pouches until the age of 235 days.
Question 4
In this population, the age classes that were under-represented were from age 7 -18 years
since our sample showed that all animals died at the age of 6 years. There are various ecological
factors that can be used to explain this situation which includes the predation of the wallabies by
the widely known predators which are the dingos and human beings. Sometimes the ranchers
receive permission to hunt these animals in order to eliminate them because they are heavy
feeders and they destroy crops and pasture land. These animals inhabits dense forests and
particularly they are found in Queensland and North South Wales Australia where these forest
⊘ This is a preview!⊘
Do you want full access?
Subscribe today to unlock all pages.
Trusted by 1+ million students worldwide
7
have continued to be cleared for agriculture and pasture fields. This clearing has seen the
destruction of their shelters and consequently a decrease of the population range and size (Smith,
Vernes & Andrew 2019). Macropus dorsalis are heavy feeders and the droughts that are
experienced in various regions of the world have seen a decrease of their gracing lands and lack
of water which leads to death of some animals. Australia as a continent has been experiencing
very severe wild fires the fiercest one being in the year 2019-2020 season where it was reported
that more than 1 billion animals died in the fires. One of the most affected area was the NSW
where kangaroo land is located and this lead to death of a lot of these animals (Yates, Hopper,
Brown & van Leeuwen 2003). It is believed that many species in genus macropus are
polygamous and male always compete in order to access the females. This competition often
becomes very intense and fatal injuries occur to the competing animals. There have been
instances that even the females get injured in these fights especially when the males become
excessively aggressive in pursuing the mates (Cole & Viney 2018). This could also another
factor that caused under-representation of the population of the wallabies in our sample.
Paraphrase This Document
Need a fresh take? Get an instant paraphrase of this document with our AI Paraphraser
8
References
Attiwill, P., & Wilson, B. (2006). Ecology an Australian perspective. Oxford University Press.
Chilton, N. B., Shuttleworth, M. A., Huby-Chilton, F., Koehler, A. V., Jabbar, A., Gasser, R. B.,
& Beveridge, I. (2017). Speciation in the genus Cloacina (Nematoda: Strongylida):
species flocks and intra-host speciation. Parasitology, 144(13), 1828-1840.
Calver, M., Lymbery, A., McComb, J., & Bamford, M. (Eds.). (2009). Environmental biology.
Cambridge University Press.
Cole, R., & Viney, M. (2018). The population genetics of parasitic nematodes of wild animals.
Parasites & vectors, 11(1), 590.
Fleming, P. A., & Bateman, P. W. (2018). Novel predation opportunities in anthropogenic
landscapes. Animal Behaviour, 138, 145-155.
McHugh, D., Goldingay, R. L., Link, J., & Letnic, M. (2019). Habitat and introduced predators
influence the occupancy of small threatened macropods in subtropical Australia. Ecology
and Evolution, 9(11), 6300-6317.
Overall, A. D., & Faragher, R. G. (2019). Population type influences the rate of ageing. Heredity,
123(2), 273-282.
Price, M., Wolfhagen, J., & Otarola-Castillo, E. (2016). Confidence intervals in the analysis of
mortality and survivorship curves in zooarchaeology. American Antiquity, 81(1), 157-
173.
Smelser, N. J., & Baltes, P. B. (Eds.). (2001). International encyclopedia of the social &
behavioral sciences (Vol. 11). Amsterdam: Elsevier.
Smith, L. E. B., Vernes, K., & Andrew, N. (2019). Environmental variables driving habitat
differentiation in two sympatric pademelon (Thylogale) species in northeast NSW.
Yates, C. J., Hopper, S. D., Brown, A., & van Leeuwen, S. (2003). Impact of two wildfires on
endemic granite outcrop vegetation in Western Australia. Journal of Vegetation Science,
14(2), 185-194.
1 out of 8

Your All-in-One AI-Powered Toolkit for Academic Success.
+13062052269
info@desklib.com
Available 24*7 on WhatsApp / Email
![[object Object]](/_next/static/media/star-bottom.7253800d.svg)
Unlock your academic potential
Copyright © 2020–2026 A2Z Services. All Rights Reserved. Developed and managed by ZUCOL.