Accounting and Financial Analysis Report: Walmart Inc. Cost of Capital
VerifiedAdded on 2021/06/15
|18
|4260
|72
Project
AI Summary
This project report provides a detailed financial analysis of Walmart Inc., focusing on the company's cost of capital. The report begins with an introduction and company overview, then delves into the calculation of the cost of equity using the Capital Asset Pricing Model (CAPM), incorporating beta from regression analysis and analyst reports, risk-free rate, and market premium. It also examines the discounted cash flow (DCF) method to determine the stock's value. Furthermore, the report assesses the cost of debt, considering the company's bond issuances and after-tax cost, along with the market values of debt and equity. The weighted average cost of capital (WACC) is calculated, incorporating the weights of equity and debt. Assumptions made during the analysis are clearly outlined, and relevant references are provided, offering a comprehensive understanding of Walmart's financial structure and performance.
Running Head: Accounting financial analysis report
1
Project Report: Accounting financial analysis report
1
Project Report: Accounting financial analysis report
Paraphrase This Document
Need a fresh take? Get an instant paraphrase of this document with our AI Paraphraser
Accounting financial analysis report 2
Contents
Introduction:.....................................................................................................................3
Company overview:..........................................................................................................3
Cost of equity:...................................................................................................................3
Beta from regression analysis:......................................................................................4
Beta from analyst report:..............................................................................................4
Beta chosen for CAPM:................................................................................................4
Capital assets pricing model:........................................................................................5
Discounted cash flow:...................................................................................................5
Cost of preferred stock:....................................................................................................5
Cost of debt:......................................................................................................................6
Market value of debt:........................................................................................................6
Market value of equity:.....................................................................................................7
Market value of preferred stock:.......................................................................................7
Value of firm:...................................................................................................................7
Firm’s tax rate:..................................................................................................................7
Weight for equity:.............................................................................................................8
Weight for preferred stock:...............................................................................................8
Weight for debt:................................................................................................................8
WACC:.............................................................................................................................8
Assumptions:....................................................................................................................9
References:.....................................................................................................................10
Appendix:.......................................................................................................................11
Accounting financial analysis report 3
Stock price..................................................................................................................11
Regression coefficient:...............................................................................................13
Dividend growth rate..................................................................................................14
WACC........................................................................................................................16
⊘ This is a preview!⊘
Do you want full access?
Subscribe today to unlock all pages.
Trusted by 1+ million students worldwide
Accounting financial analysis report 4
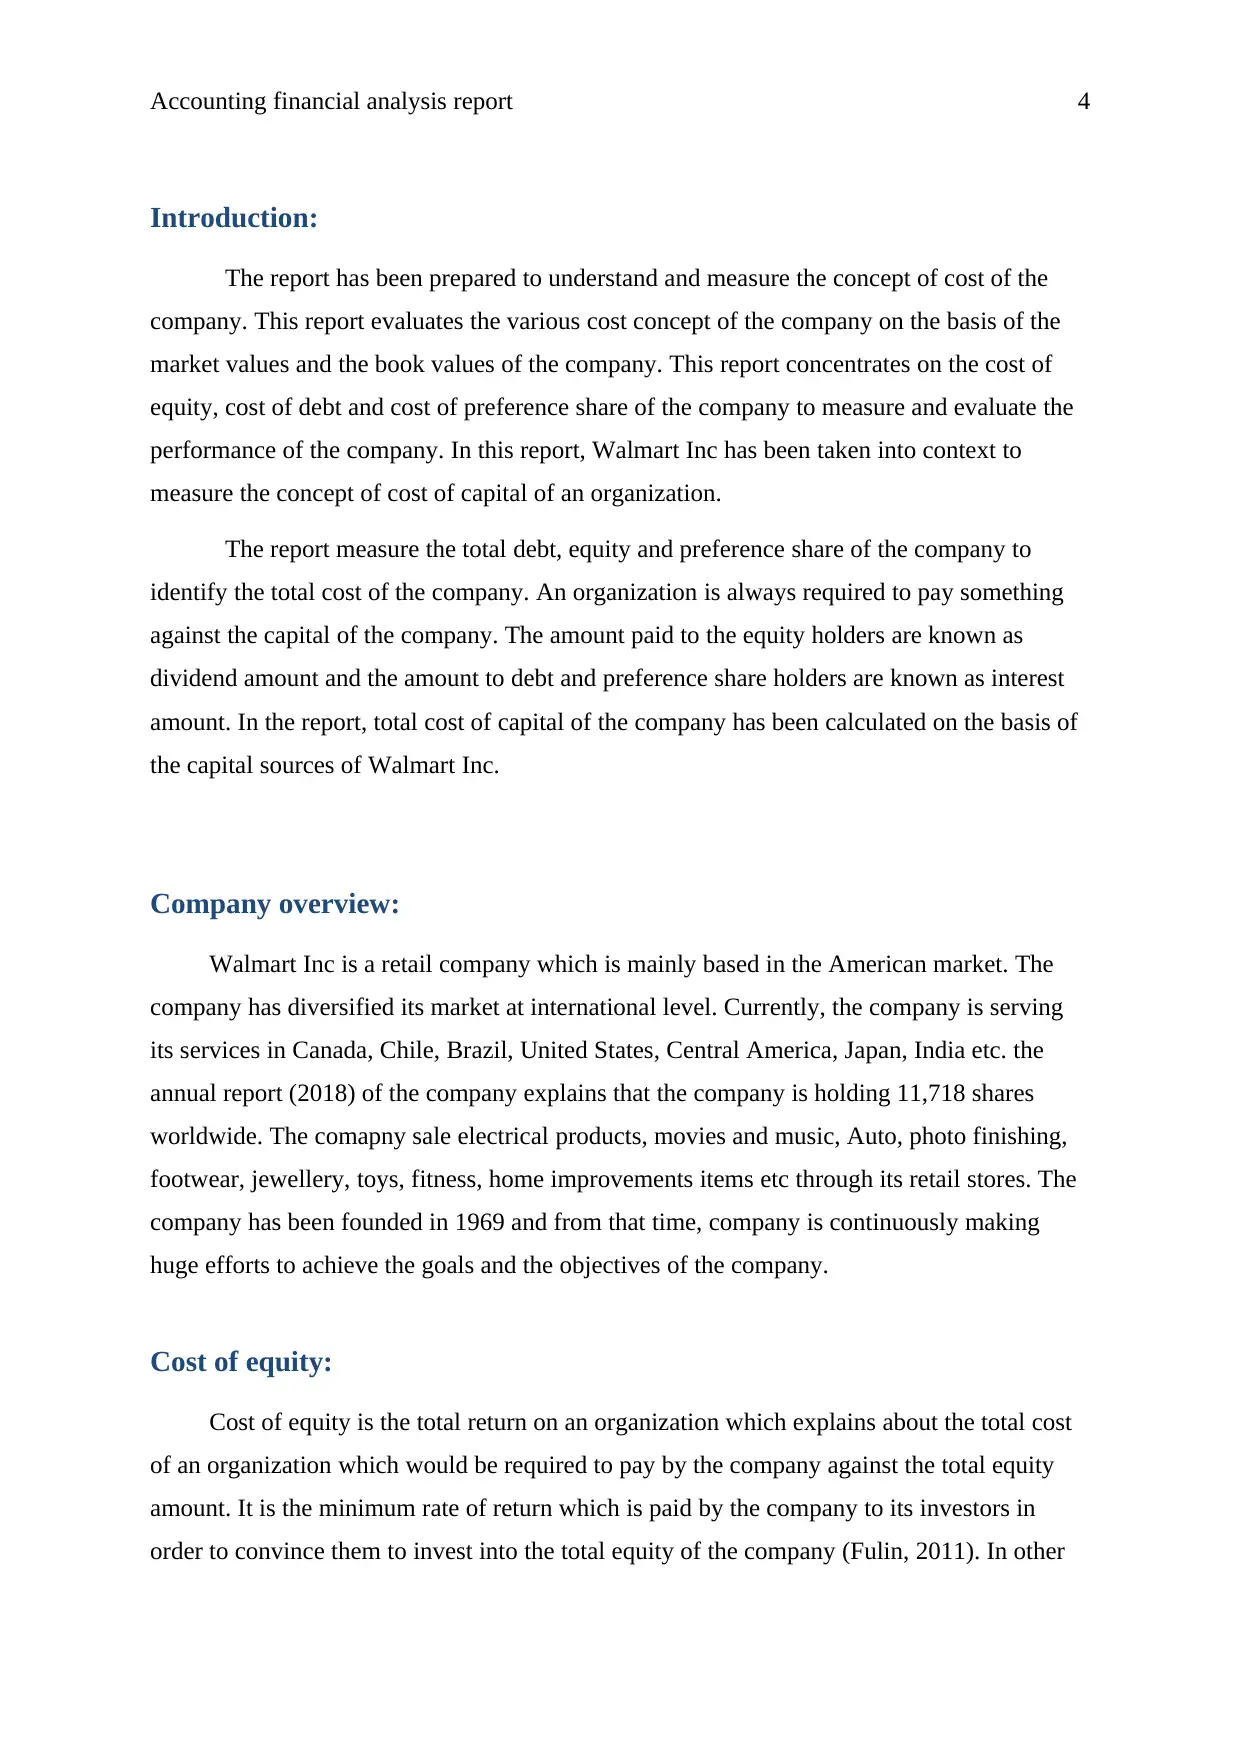
Introduction:
The report has been prepared to understand and measure the concept of cost of the
company. This report evaluates the various cost concept of the company on the basis of the
market values and the book values of the company. This report concentrates on the cost of
equity, cost of debt and cost of preference share of the company to measure and evaluate the
performance of the company. In this report, Walmart Inc has been taken into context to
measure the concept of cost of capital of an organization.
The report measure the total debt, equity and preference share of the company to
identify the total cost of the company. An organization is always required to pay something
against the capital of the company. The amount paid to the equity holders are known as
dividend amount and the amount to debt and preference share holders are known as interest
amount. In the report, total cost of capital of the company has been calculated on the basis of
the capital sources of Walmart Inc.
Company overview:
Walmart Inc is a retail company which is mainly based in the American market. The
company has diversified its market at international level. Currently, the company is serving
its services in Canada, Chile, Brazil, United States, Central America, Japan, India etc. the
annual report (2018) of the company explains that the company is holding 11,718 shares
worldwide. The comapny sale electrical products, movies and music, Auto, photo finishing,
footwear, jewellery, toys, fitness, home improvements items etc through its retail stores. The
company has been founded in 1969 and from that time, company is continuously making
huge efforts to achieve the goals and the objectives of the company.
Cost of equity:
Cost of equity is the total return on an organization which explains about the total cost
of an organization which would be required to pay by the company against the total equity
amount. It is the minimum rate of return which is paid by the company to its investors in
order to convince them to invest into the total equity of the company (Fulin, 2011). In other
Paraphrase This Document
Need a fresh take? Get an instant paraphrase of this document with our AI Paraphraser
Accounting financial analysis report 5
words, it is a compensate amount which is given by the company to the investors against the
risk of time value of money and the changes into the stock price of the company.
In case of Walmart Inc, the cost of equity of the company has been calculated on the
basis of the capital assets pricing model. For this model, beta, risk free rate and market
premium of the market has been calculated. The calculations of cost of equity of the company
are as follows:
Beta from regression analysis:
Beta is a risk measurement term of a business which is calculated on the basis of the
volatility in the stock price of the company. Beta is used in the capital asset pricing model to
measure the total cost of equity of the company (Madhura, 2014).
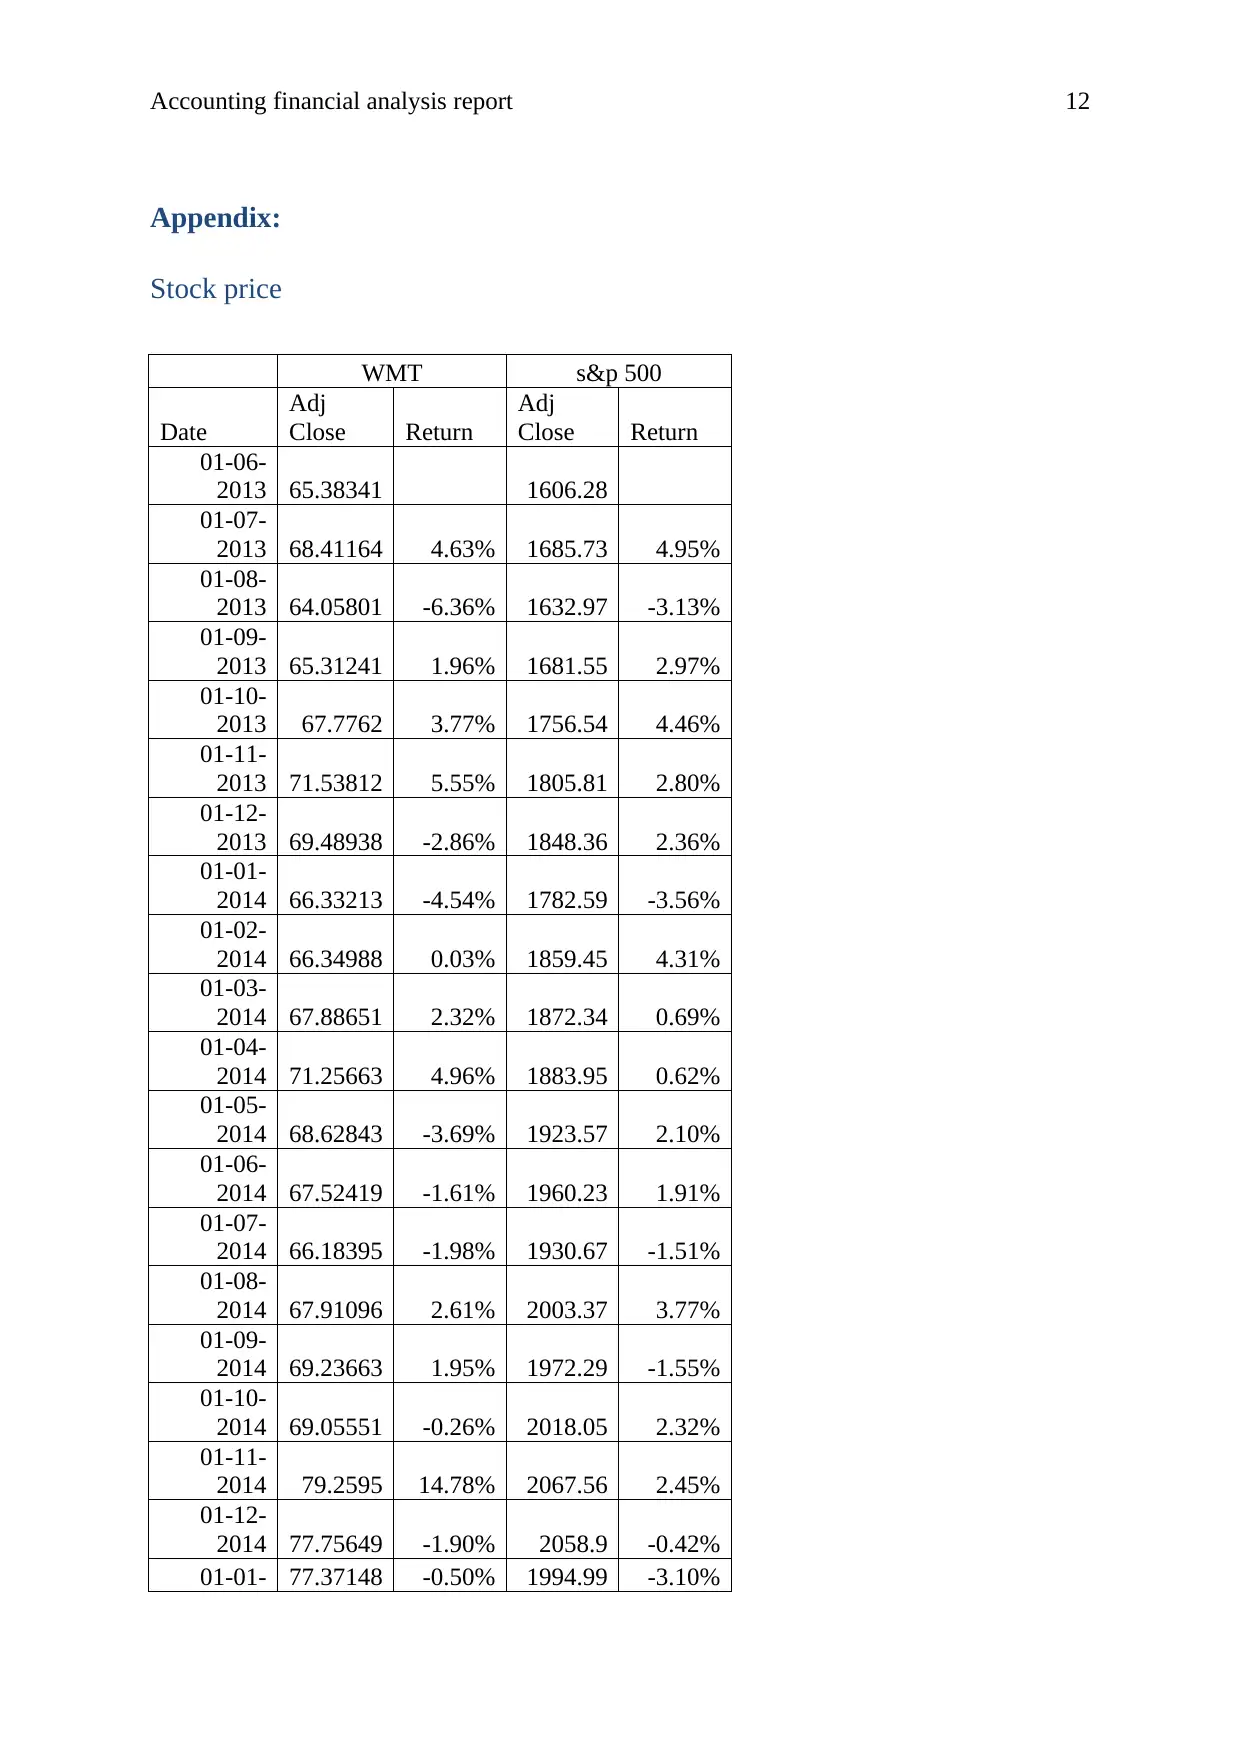
The beta amount has been calculated on the basis of last 5 years stock price of the
company and the index prices of the market. The calculations express that the beta of the
company is 0.48.
Beta from analyst report:
Further, the beta amount of the company has been calculated on the basis of the various
analyst reports. The report of Yahoo finance (2018) explains that the beta of the company is
0.46. On the other hand, Reuters (2018) also express about 0.32 beta of the company.
The reports explains that the beta of the company is quite different to each other and
express about the different bases which has been used by the analyst to measure the beta
coefficient of Walmart Inc (Barlow, 2006).
Beta chosen for CAPM:
On the basis of the above calculated beta coefficient and yahoo finance (2018) and
Reuters (2018), it has been found that the total beta of the company is 0.48, 0.46 and 0.32.
However, the calculated beta is most reliable as on the basis of it, it could be clearly
identified that it belongs to the last 5 year performance of the company as well as it is linked
to the index stock price. So, the calculated beta which is 0.48 has been used to measure the
cost of equity of the company.
words, it is a compensate amount which is given by the company to the investors against the
risk of time value of money and the changes into the stock price of the company.
In case of Walmart Inc, the cost of equity of the company has been calculated on the
basis of the capital assets pricing model. For this model, beta, risk free rate and market
premium of the market has been calculated. The calculations of cost of equity of the company
are as follows:
Beta from regression analysis:
Beta is a risk measurement term of a business which is calculated on the basis of the
volatility in the stock price of the company. Beta is used in the capital asset pricing model to
measure the total cost of equity of the company (Madhura, 2014).
The beta amount has been calculated on the basis of last 5 years stock price of the
company and the index prices of the market. The calculations express that the beta of the
company is 0.48.
Beta from analyst report:
Further, the beta amount of the company has been calculated on the basis of the various
analyst reports. The report of Yahoo finance (2018) explains that the beta of the company is
0.46. On the other hand, Reuters (2018) also express about 0.32 beta of the company.
The reports explains that the beta of the company is quite different to each other and
express about the different bases which has been used by the analyst to measure the beta
coefficient of Walmart Inc (Barlow, 2006).
Beta chosen for CAPM:
On the basis of the above calculated beta coefficient and yahoo finance (2018) and
Reuters (2018), it has been found that the total beta of the company is 0.48, 0.46 and 0.32.
However, the calculated beta is most reliable as on the basis of it, it could be clearly
identified that it belongs to the last 5 year performance of the company as well as it is linked
to the index stock price. So, the calculated beta which is 0.48 has been used to measure the
cost of equity of the company.

Accounting financial analysis report 6
Capital assets pricing model:
Capital asset pricing model is a method to calculate the cost of equity of the company.
CAPM model takes the help of risk free rate, market premium and beta of the company.
Bloomberg (2018) explains that the risk free rate is 2.63% as well as market premium has
been identified through analyst report. The market premium has been identified through
index price but it was not feasible so market risk premium is 9%.
On the basis of it, the cost of equity of the company is 5.05%. the calculations are as
follows:
Cost of equity = Rf+(Rm-Rf)*Beta (Lord, 2007)
=2.63%+(9%-2.63%)*0.48
= 5.05%
Discounted cash flow:
Further, the discounted cash flow study has also been done on the Walmart stock to
evaluate the value of the stock. The growth rate has been calculated on the basis of the last 5
year dividend amount of the company. Dividend amount has been found in the annual report
of the company. The growth rate is 2.02%. Further, the cash flow growth of the company is
4.22% which has been calculated through last 5 year free cash flows of the company.
The calculations of discounted cash flow have been given in the appendix. It explains
that the terminal cash flows of the company are $ 5,46,235 million and the total equity is $
7,05,372 which explains that cost of equity of the company should be $ 236 (NASDAQ,
2018).
Cost of preferred stock:
Further, the annual report of the company explains that the company has not raised the
capital from the preference shares. The company has raised the capital amount through debt
and equity capital only.
⊘ This is a preview!⊘
Do you want full access?
Subscribe today to unlock all pages.
Trusted by 1+ million students worldwide
Accounting financial analysis report 7
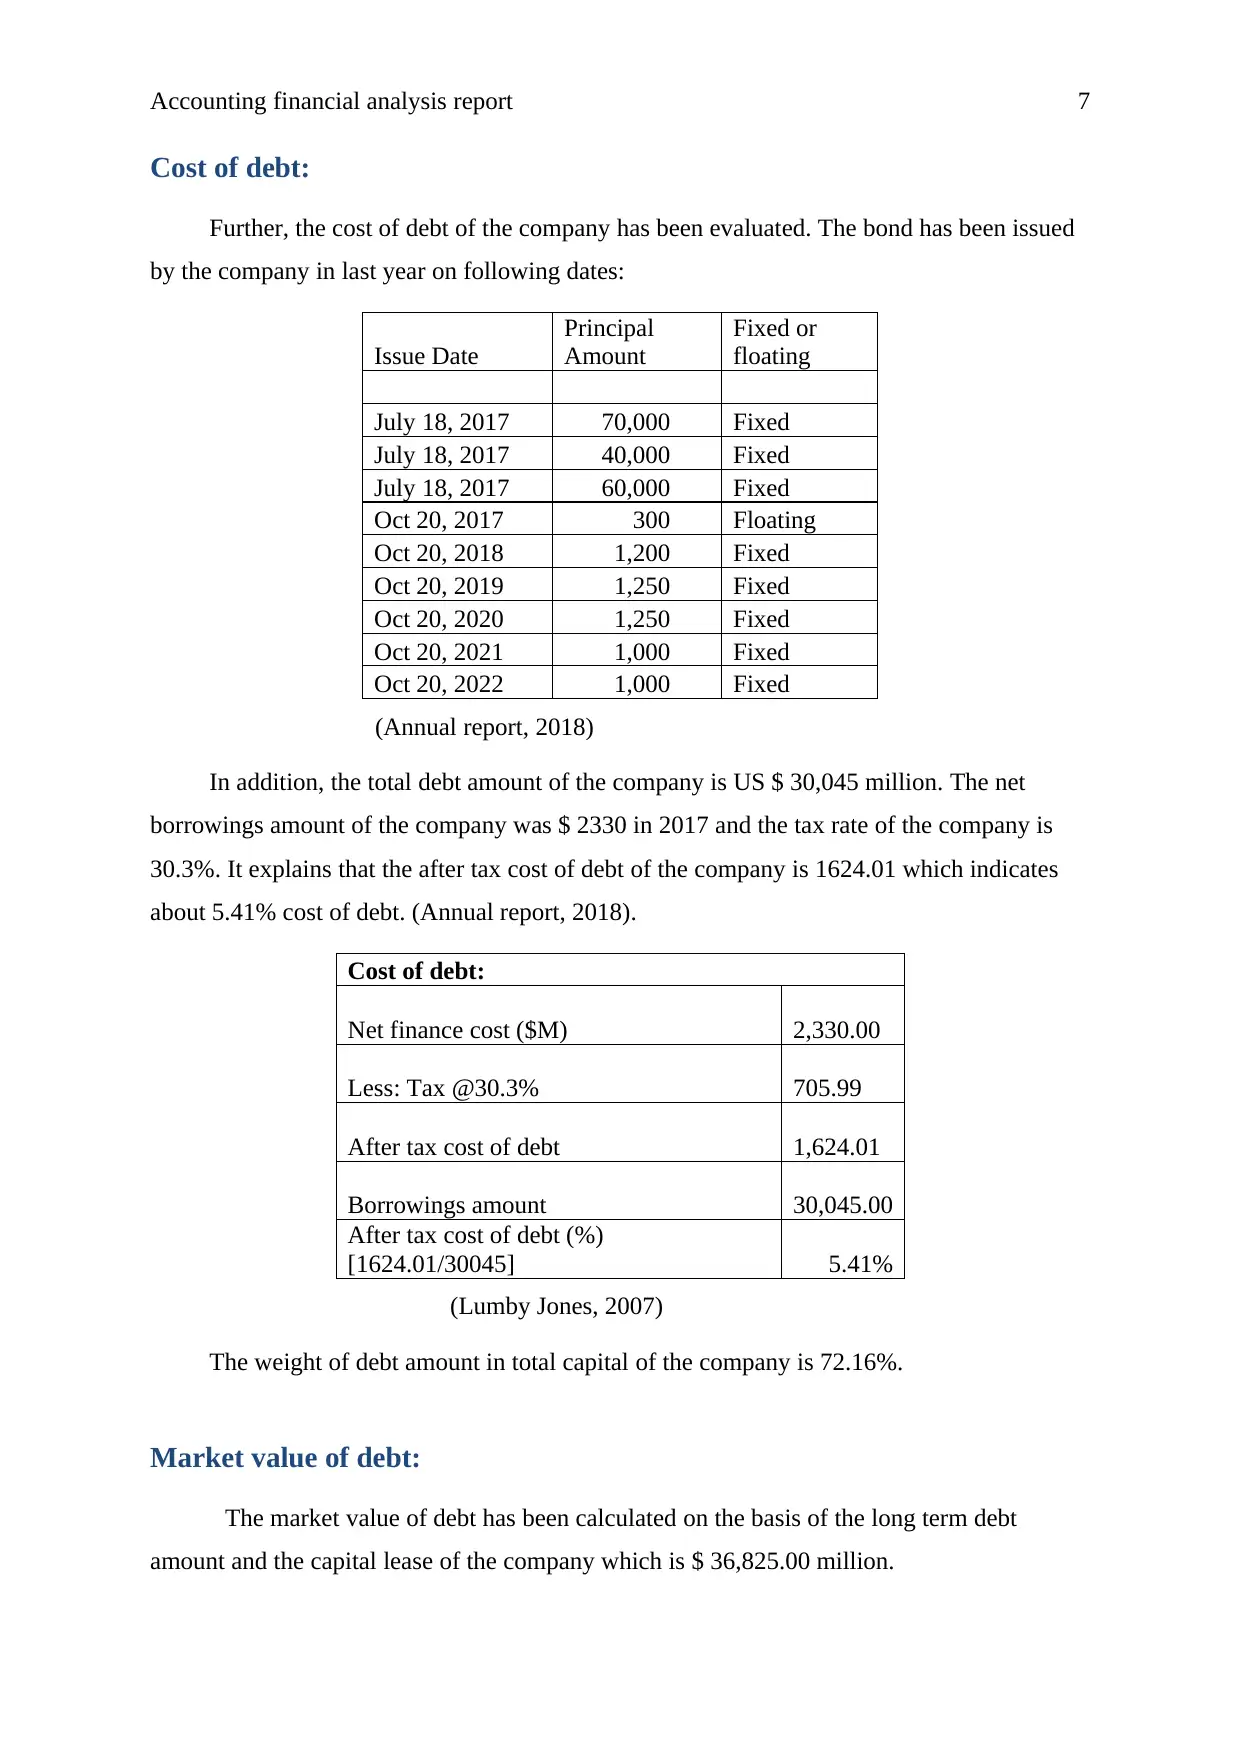
Cost of debt:
Further, the cost of debt of the company has been evaluated. The bond has been issued
by the company in last year on following dates:
Issue Date
Principal
Amount
Fixed or
floating
July 18, 2017 70,000 Fixed
July 18, 2017 40,000 Fixed
July 18, 2017 60,000 Fixed
Oct 20, 2017 300 Floating
Oct 20, 2018 1,200 Fixed
Oct 20, 2019 1,250 Fixed
Oct 20, 2020 1,250 Fixed
Oct 20, 2021 1,000 Fixed
Oct 20, 2022 1,000 Fixed
(Annual report, 2018)
In addition, the total debt amount of the company is US $ 30,045 million. The net
borrowings amount of the company was $ 2330 in 2017 and the tax rate of the company is
30.3%. It explains that the after tax cost of debt of the company is 1624.01 which indicates
about 5.41% cost of debt. (Annual report, 2018).
Cost of debt:
Net finance cost ($M) 2,330.00
Less: Tax @30.3% 705.99
After tax cost of debt 1,624.01
Borrowings amount 30,045.00
After tax cost of debt (%)
[1624.01/30045] 5.41%
(Lumby Jones, 2007)
The weight of debt amount in total capital of the company is 72.16%.
Market value of debt:
The market value of debt has been calculated on the basis of the long term debt
amount and the capital lease of the company which is $ 36,825.00 million.
Cost of debt:
Further, the cost of debt of the company has been evaluated. The bond has been issued
by the company in last year on following dates:
Issue Date
Principal
Amount
Fixed or
floating
July 18, 2017 70,000 Fixed
July 18, 2017 40,000 Fixed
July 18, 2017 60,000 Fixed
Oct 20, 2017 300 Floating
Oct 20, 2018 1,200 Fixed
Oct 20, 2019 1,250 Fixed
Oct 20, 2020 1,250 Fixed
Oct 20, 2021 1,000 Fixed
Oct 20, 2022 1,000 Fixed
(Annual report, 2018)
In addition, the total debt amount of the company is US $ 30,045 million. The net
borrowings amount of the company was $ 2330 in 2017 and the tax rate of the company is
30.3%. It explains that the after tax cost of debt of the company is 1624.01 which indicates
about 5.41% cost of debt. (Annual report, 2018).
Cost of debt:
Net finance cost ($M) 2,330.00
Less: Tax @30.3% 705.99
After tax cost of debt 1,624.01
Borrowings amount 30,045.00
After tax cost of debt (%)
[1624.01/30045] 5.41%
(Lumby Jones, 2007)
The weight of debt amount in total capital of the company is 72.16%.
Market value of debt:
The market value of debt has been calculated on the basis of the long term debt
amount and the capital lease of the company which is $ 36,825.00 million.
Paraphrase This Document
Need a fresh take? Get an instant paraphrase of this document with our AI Paraphraser
Accounting financial analysis report 8
Market value of equity:
The market value of equity has been calculated on the basis of the retained earnings
and market price of the company which is $ 3,32,074.70 million.
Market value of preferred stock:
Preference shares have not been issued by the company in the market in order to raise
the capital.
Value of firm:
On the basis of the evaluation on the equity amount and debt amount of the company, it
has been evaluated that the current market value of firm is $ 3,68,899.70 million. The value
of the firm comprises the debt amount and the equity amount. Debt amount of the company is
$ 36,825 and equity amount is $ 3,32,074 which explains that the market value of firm is $
3,68,899.70 million (Yahoo finance, 2018).
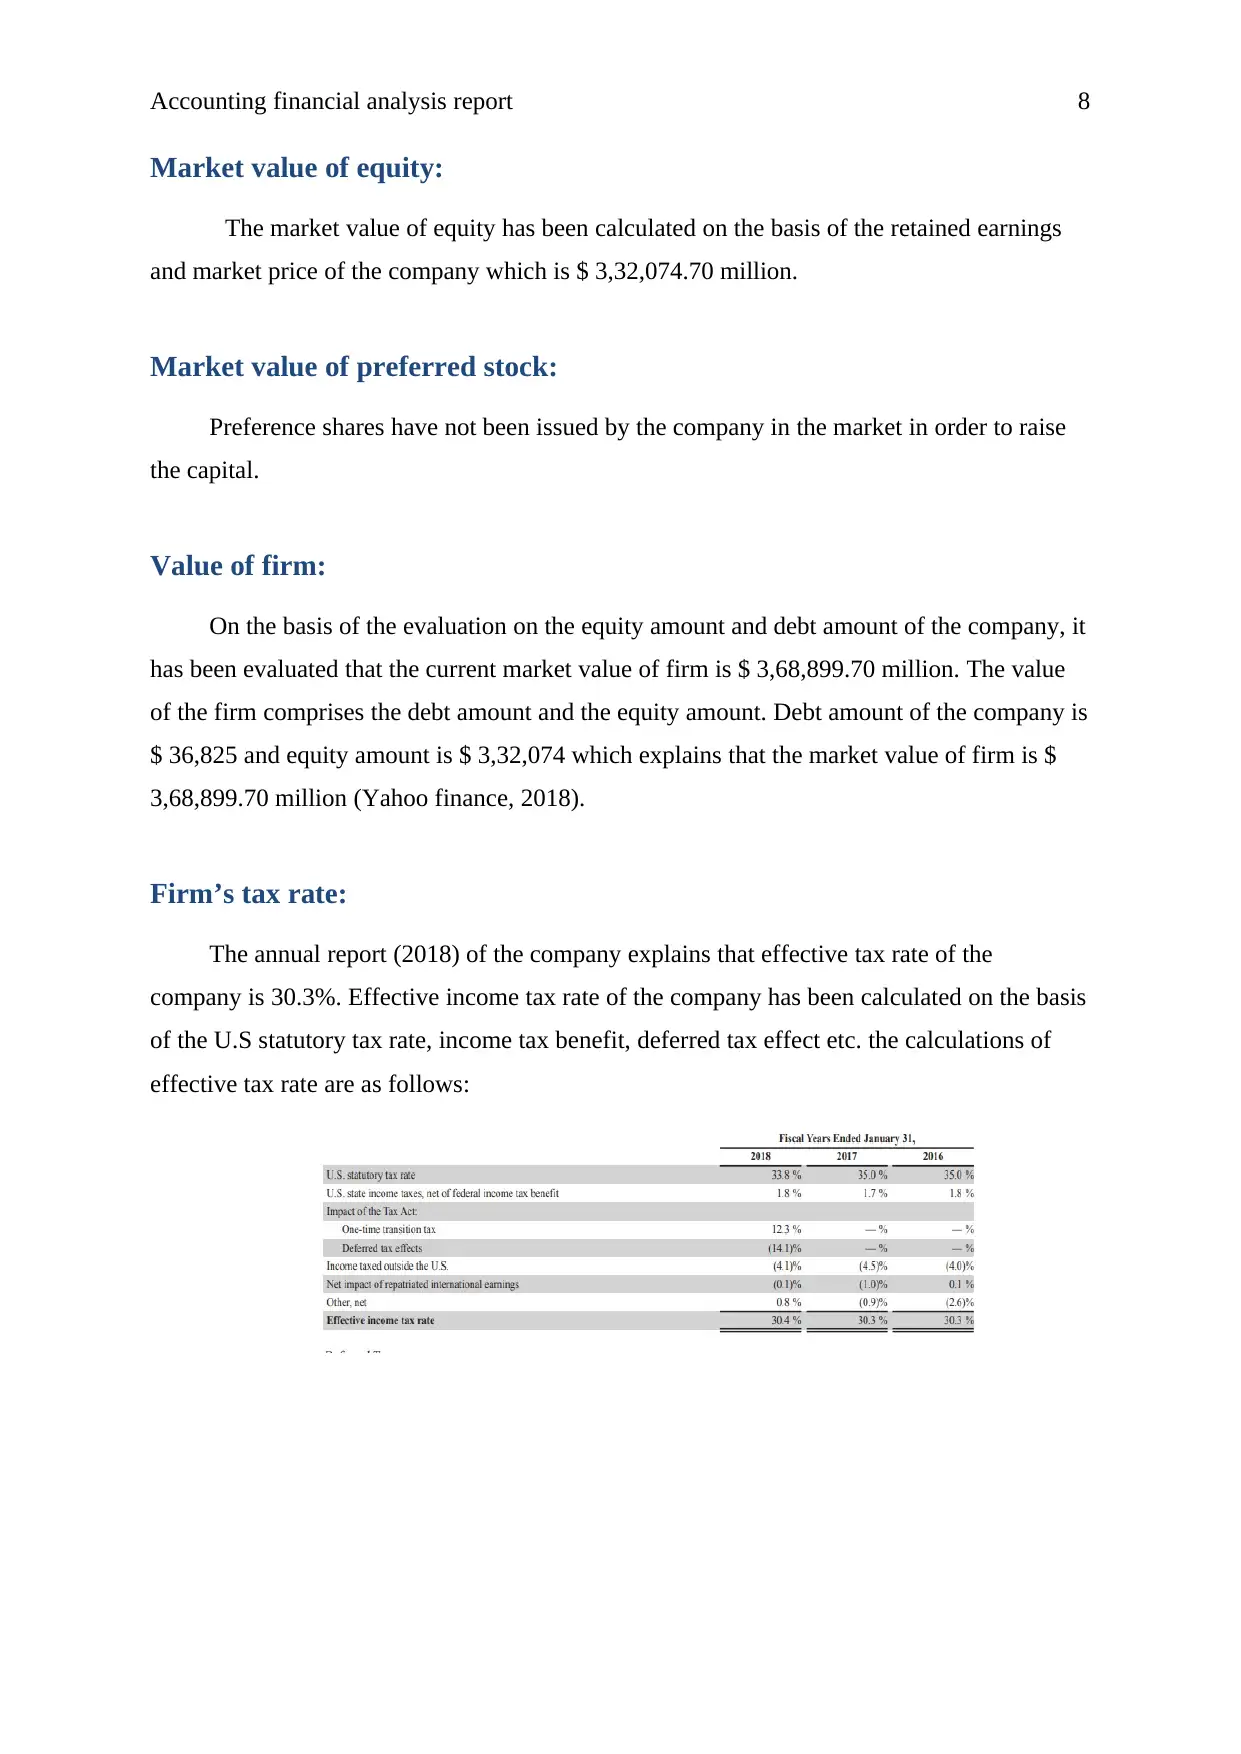
Firm’s tax rate:
The annual report (2018) of the company explains that effective tax rate of the
company is 30.3%. Effective income tax rate of the company has been calculated on the basis
of the U.S statutory tax rate, income tax benefit, deferred tax effect etc. the calculations of
effective tax rate are as follows:
Market value of equity:
The market value of equity has been calculated on the basis of the retained earnings
and market price of the company which is $ 3,32,074.70 million.
Market value of preferred stock:
Preference shares have not been issued by the company in the market in order to raise
the capital.
Value of firm:
On the basis of the evaluation on the equity amount and debt amount of the company, it
has been evaluated that the current market value of firm is $ 3,68,899.70 million. The value
of the firm comprises the debt amount and the equity amount. Debt amount of the company is
$ 36,825 and equity amount is $ 3,32,074 which explains that the market value of firm is $
3,68,899.70 million (Yahoo finance, 2018).
Firm’s tax rate:
The annual report (2018) of the company explains that effective tax rate of the
company is 30.3%. Effective income tax rate of the company has been calculated on the basis
of the U.S statutory tax rate, income tax benefit, deferred tax effect etc. the calculations of
effective tax rate are as follows:
Accounting financial analysis report 9
Weight for equity:
Further, the market value of equity has been calculated on the basis of the total
outstanding share and the market value of the equity and the retained earnings of the
company. The market value of equity of the company is 90.2% as the equity amount is $
3,32,074 and the capital of the company is $ 3,68,889.7.
Weight for preferred stock:
Preference shares have not been issued by the company in the market in order to raise
the capital.
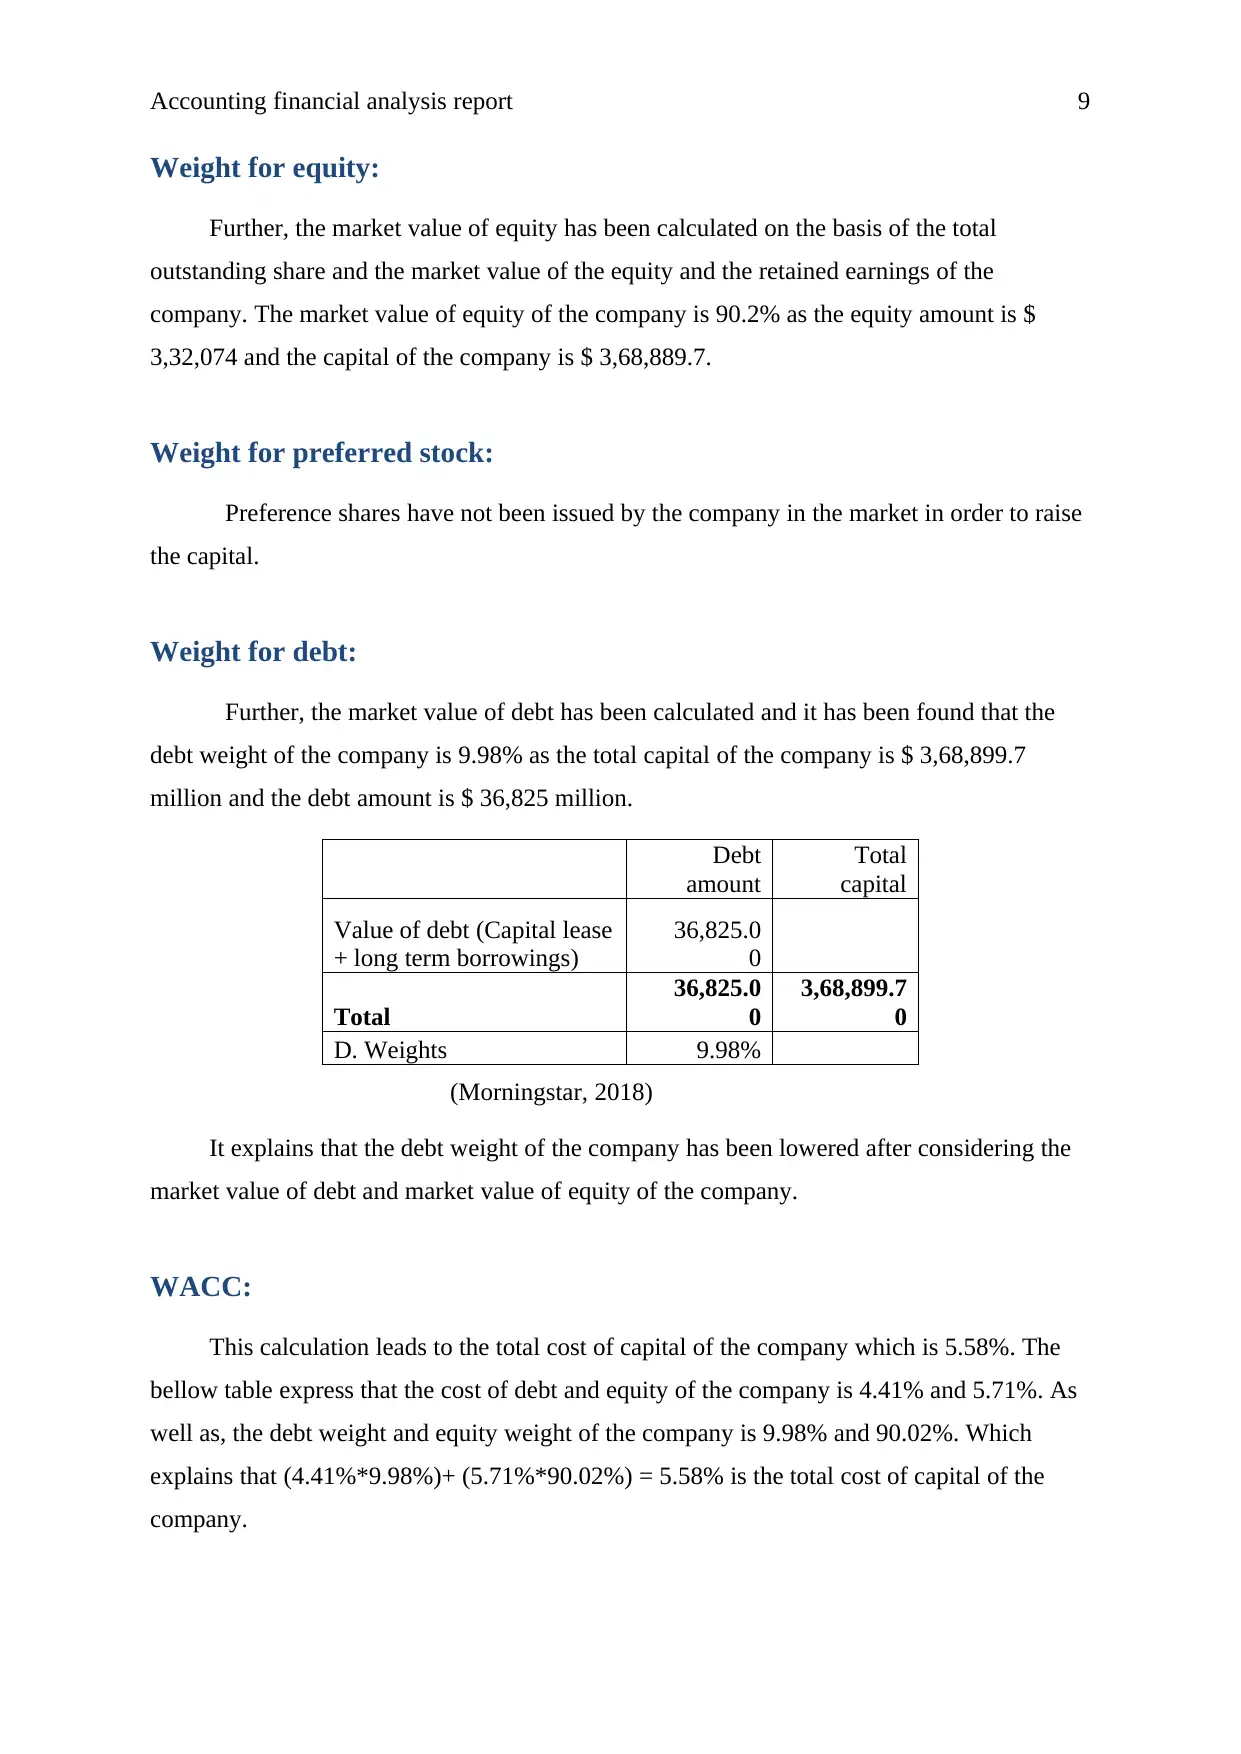
Weight for debt:
Further, the market value of debt has been calculated and it has been found that the
debt weight of the company is 9.98% as the total capital of the company is $ 3,68,899.7
million and the debt amount is $ 36,825 million.
Debt
amount
Total
capital
Value of debt (Capital lease
+ long term borrowings)
36,825.0
0
Total
36,825.0
0
3,68,899.7
0
D. Weights 9.98%
(Morningstar, 2018)
It explains that the debt weight of the company has been lowered after considering the
market value of debt and market value of equity of the company.
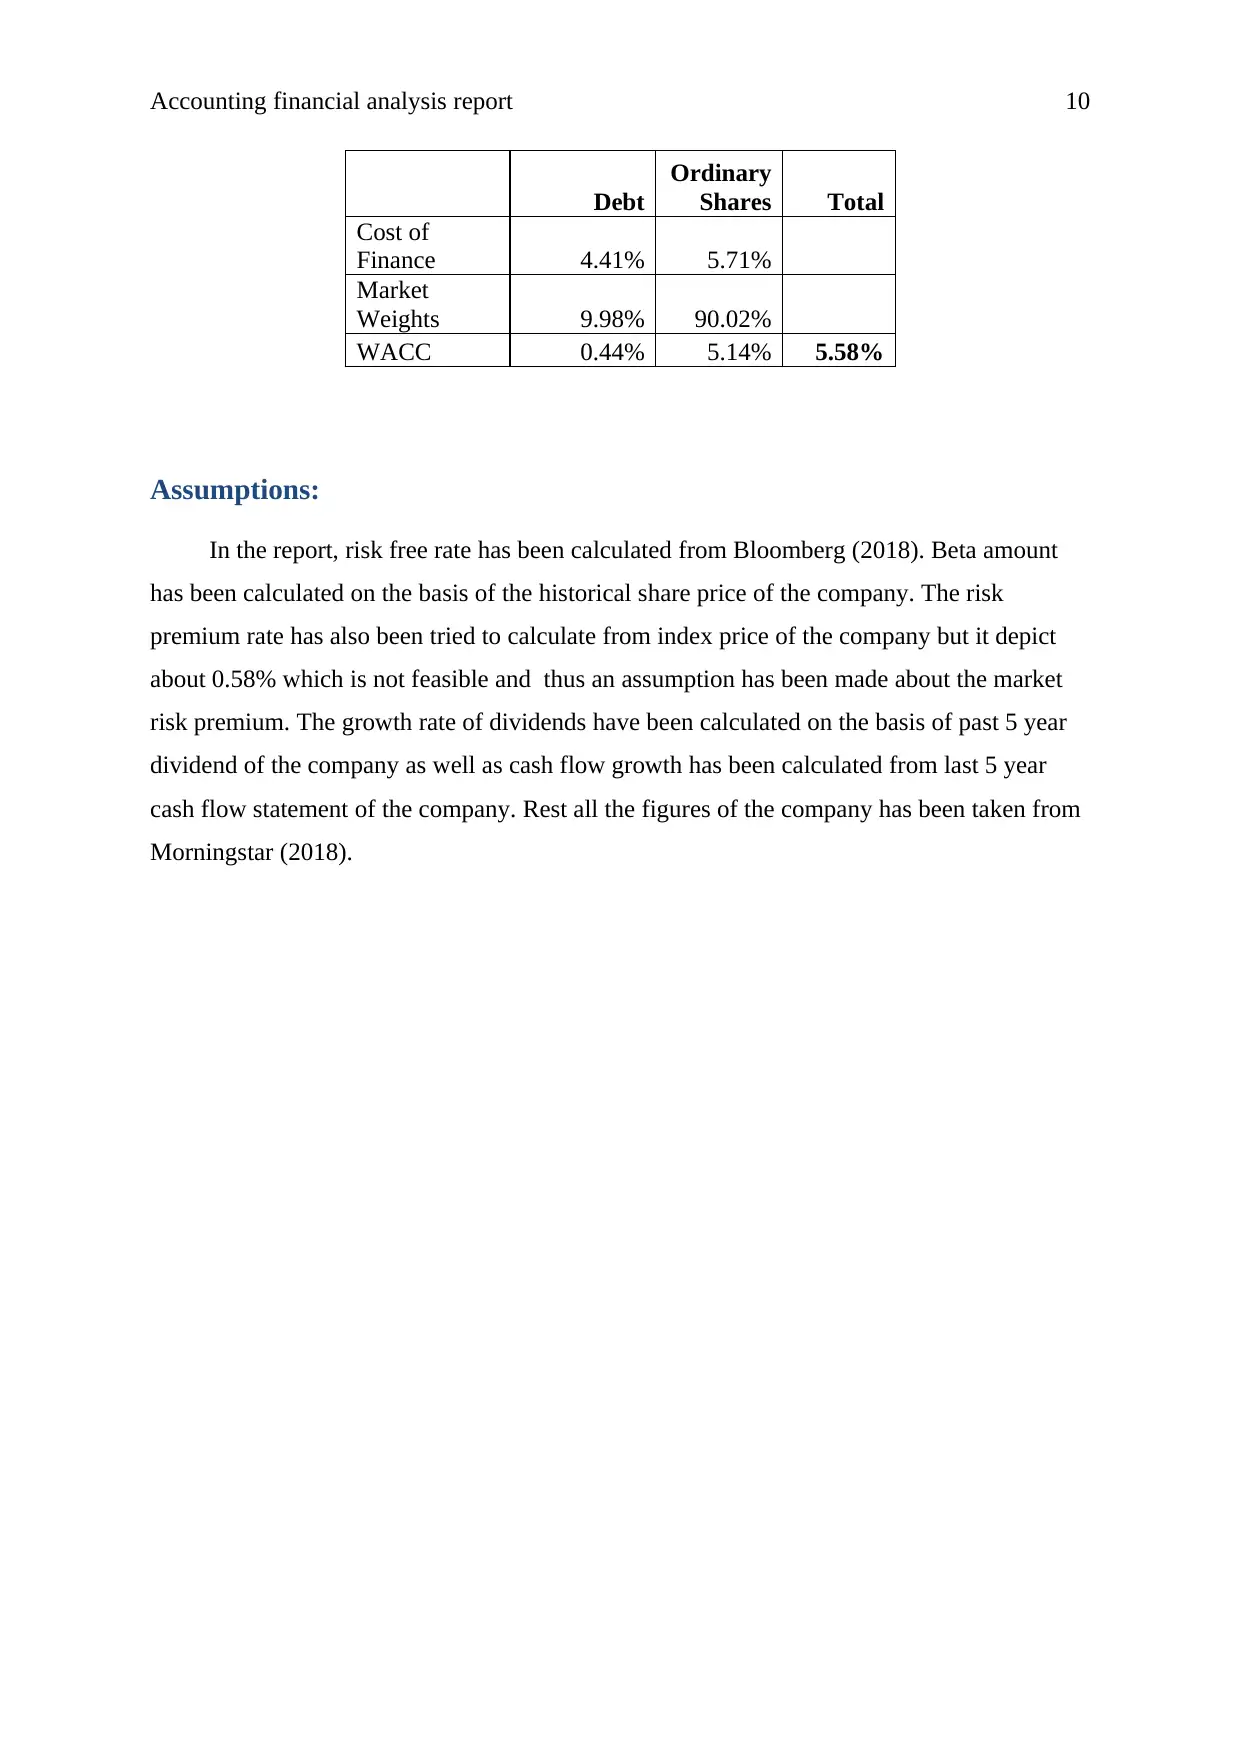
WACC:
This calculation leads to the total cost of capital of the company which is 5.58%. The
bellow table express that the cost of debt and equity of the company is 4.41% and 5.71%. As
well as, the debt weight and equity weight of the company is 9.98% and 90.02%. Which
explains that (4.41%*9.98%)+ (5.71%*90.02%) = 5.58% is the total cost of capital of the
company.
Weight for equity:
Further, the market value of equity has been calculated on the basis of the total
outstanding share and the market value of the equity and the retained earnings of the
company. The market value of equity of the company is 90.2% as the equity amount is $
3,32,074 and the capital of the company is $ 3,68,889.7.
Weight for preferred stock:
Preference shares have not been issued by the company in the market in order to raise
the capital.
Weight for debt:
Further, the market value of debt has been calculated and it has been found that the
debt weight of the company is 9.98% as the total capital of the company is $ 3,68,899.7
million and the debt amount is $ 36,825 million.
Debt
amount
Total
capital
Value of debt (Capital lease
+ long term borrowings)
36,825.0
0
Total
36,825.0
0
3,68,899.7
0
D. Weights 9.98%
(Morningstar, 2018)
It explains that the debt weight of the company has been lowered after considering the
market value of debt and market value of equity of the company.
WACC:
This calculation leads to the total cost of capital of the company which is 5.58%. The
bellow table express that the cost of debt and equity of the company is 4.41% and 5.71%. As
well as, the debt weight and equity weight of the company is 9.98% and 90.02%. Which
explains that (4.41%*9.98%)+ (5.71%*90.02%) = 5.58% is the total cost of capital of the
company.
⊘ This is a preview!⊘
Do you want full access?
Subscribe today to unlock all pages.
Trusted by 1+ million students worldwide
Accounting financial analysis report 10
Debt
Ordinary
Shares Total
Cost of
Finance 4.41% 5.71%
Market
Weights 9.98% 90.02%
WACC 0.44% 5.14% 5.58%
Assumptions:
In the report, risk free rate has been calculated from Bloomberg (2018). Beta amount
has been calculated on the basis of the historical share price of the company. The risk
premium rate has also been tried to calculate from index price of the company but it depict
about 0.58% which is not feasible and thus an assumption has been made about the market
risk premium. The growth rate of dividends have been calculated on the basis of past 5 year
dividend of the company as well as cash flow growth has been calculated from last 5 year
cash flow statement of the company. Rest all the figures of the company has been taken from
Morningstar (2018).
Paraphrase This Document
Need a fresh take? Get an instant paraphrase of this document with our AI Paraphraser
Accounting financial analysis report 11
References:
Annual report. (2018). Walmart Inc. Retrieved on 29May 2018 from:
http://s2.q4cdn.com/056532643/files/doc_financials/2018/annual/WMT-
2018_Annual-Report.pdf.
Barlow.J.F.,(2006). Excel models for business and operations management, 2nd edition, John
Wiley & sons ltd, England
Fulin, S. (2011). Preface by SHANG Fulin. Corporate Governance of Listed Companies in
China. OECD, 5, p.003.
Lord, B.R., (2007). Strategic management accounting. Issues in Management Accounting, 3.
Lumby,S & Jones,C,.(2007). Corporate finance theory & practice, 7th edition, Thomson,
London.
Madura, J. (2014). Financial Markets and Institutions. Cengage Learning.
Morningstar. (2018). Walmart Inc. Retrieved on 29May 2018 from:
http://financials.morningstar.com/cash-flow/cf.html?
t=WMT®ion=usa&culture=en-US.
NASQAD. (2018). Walmart Inc. Retrieved on 29May 2018 from:
https://www.nasdaq.com/symbol/wmt.
Reuters. (2018). Walmart Inc. Retrieved on 29May 2018 from:
https://www.reuters.com/finance/stocks/overview/WMT.N.
yahoo Finance. (2018). S&p500. Retrieved on 29May 2018 from:
https://finance.yahoo.com/quote/%5EGSPC/history?
period1=1369852200&period2=1527618600&interval=1mo&filter=history&frequenc
y=1mo.
Yahoo finance. (2018). Walmart Inc. Retrieved on 29May 2018 from:
https://finance.yahoo.com/quote/wmt/key-statistics/.
Accounting financial analysis report 12
Appendix:
Stock price
WMT s&p 500
Date
Adj
Close Return
Adj
Close Return
01-06-
2013 65.38341 1606.28
01-07-
2013 68.41164 4.63% 1685.73 4.95%
01-08-
2013 64.05801 -6.36% 1632.97 -3.13%
01-09-
2013 65.31241 1.96% 1681.55 2.97%
01-10-
2013 67.7762 3.77% 1756.54 4.46%
01-11-
2013 71.53812 5.55% 1805.81 2.80%
01-12-
2013 69.48938 -2.86% 1848.36 2.36%
01-01-
2014 66.33213 -4.54% 1782.59 -3.56%
01-02-
2014 66.34988 0.03% 1859.45 4.31%
01-03-
2014 67.88651 2.32% 1872.34 0.69%
01-04-
2014 71.25663 4.96% 1883.95 0.62%
01-05-
2014 68.62843 -3.69% 1923.57 2.10%
01-06-
2014 67.52419 -1.61% 1960.23 1.91%
01-07-
2014 66.18395 -1.98% 1930.67 -1.51%
01-08-
2014 67.91096 2.61% 2003.37 3.77%
01-09-
2014 69.23663 1.95% 1972.29 -1.55%
01-10-
2014 69.05551 -0.26% 2018.05 2.32%
01-11-
2014 79.2595 14.78% 2067.56 2.45%
01-12-
2014 77.75649 -1.90% 2058.9 -0.42%
01-01- 77.37148 -0.50% 1994.99 -3.10%
⊘ This is a preview!⊘
Do you want full access?
Subscribe today to unlock all pages.
Trusted by 1+ million students worldwide
1 out of 18
Related Documents


Your All-in-One AI-Powered Toolkit for Academic Success.
+13062052269
info@desklib.com
Available 24*7 on WhatsApp / Email
![[object Object]](/_next/static/media/star-bottom.7253800d.svg)
Unlock your academic potential
Copyright © 2020–2026 A2Z Services. All Rights Reserved. Developed and managed by ZUCOL.