Financial Performance Analysis of Walmart Corporation (2016-2019)
VerifiedAdded on 2022/08/26
|14
|3100
|17
Report
AI Summary
This report provides a comprehensive financial analysis of Walmart Corporation from 2016 to 2019, utilizing ratio analysis to assess its financial performance and position. The analysis includes a detailed examination of various financial ratios such as debt ratio, debt-to-equity ratio, return on total assets, return on equity, current ratio, quick ratio, inventory turnover ratio, accounts receivable turnover ratio, and accounts payable turnover ratio. The report also covers the earnings per share (EPS) and price-to-earnings (P/E) ratio. The findings reveal trends in Walmart's profitability, liquidity, and efficiency, highlighting changes in debt financing, profitability decline, and operational capabilities. The analysis concludes with an overview of the corporation's financial health and key performance indicators, offering insights into its strategic management and resource allocation.
Running head: FUNDAMENTALS OF CORPORATE FINANCE
Fundamentals of Corporate Finance
Name of the Student:
Name of the University:
Author’s Note:
Fundamentals of Corporate Finance
Name of the Student:
Name of the University:
Author’s Note:
Paraphrase This Document
Need a fresh take? Get an instant paraphrase of this document with our AI Paraphraser
1FUNDAMENTALS OF FINANCE
Table of Contents
Introduction......................................................................................................................................2
Discussion and Analysis..................................................................................................................2
Corporation Background.............................................................................................................2
Ratio Analysis..............................................................................................................................3
Conclusion.......................................................................................................................................8
References........................................................................................................................................9
Appendix........................................................................................................................................11
2FUNDAMENTALS OF FINANCE
Introduction
The financial analysis of the Walmart Corporation has been well done with the help of
the ratio analysis a quantifiable investment tool, which has been well use for the examination of
Corporation. The examination of the Corporation has been well done for a sum of last four year
comparatively from the year 2019-2016 and the analysis was done including various financial
ratios and vertical analysis for the Corporation which has been done. The vertical analysis of the
Corporation’s income statement has been well done by stating each item of the Corporation
income statement in terms of total revenue reported. On the other hand, in the case of balance
sheet each item of the Corporation has been considered based on the total assets and liabilities
reported by the Corporation (Nwanji et al., 2018).
Discussion and Analysis
Corporation Background
The Walmart Inc. is a multinational retail Corporation which operates a chain of
hypermarket, discounted departmental stores and various grocery stores. The Corporation is
headquartered in the Bentonville, Arkansas. The stock is listed in the New York Stock Exchange
with its ticker symbol as WMT and is currently trading at $115.89. The key ownership of the
Corporation is enjoyed by Walton Family who holds around 51% of shares. The Corporation on
a worldwide basis has around 11,438 stores whereby it also gives employment directly to around
2.2 Million people on a worldwide basis (Yahoo Finance, 2020).
⊘ This is a preview!⊘
Do you want full access?
Subscribe today to unlock all pages.
Trusted by 1+ million students worldwide
3FUNDAMENTALS OF FINANCE
Ratio Analysis
The ratio analysis of the Walmart Corporation has been done for a sum of four years
whereby relevant changes observed in the financial performance and financial position of the
Corporation has been well taken into consideration (Setiawan & Amboningtyas, 2018).
Debt Ratio: The debt ratio shows the position or weightage of debt in correspondence to the
total asset position that has been placed by the Corporation. The debt ratio for the Walmart
Corporation in particular has increased from 0.58 times to around 0.64 times in the trend period
of 2016-2019 and the same has been particularly due to the consistent increase of debt financing
by the Corporation in correspondence to equity financing. The key note in this regard is that the
financial risk of the firm should be well managed as the same plays a crucial role in the business
operations that is attached to the firm (Setiawan & Amboningtyas, 2018).
Debt to Equity Ratio: The debt to equity ratio for the firm has been well managed by the firm
with the help of the total debt value in correspondence to equity position of the Corporation
(Campisi et al., 2019). The debt to equity ratio has increased from 1.44 times to around 1.93
times in the year 2016-19. The increase in debt position by the Corporation has been in particular
due to the increase in the debt value in correspondence to the equity value that has been used.
Return on Total Assets: The return generated on the total assets by the Walmart Firm well
reflects the profitability the Corporation is generating form the total assets that has been
deployed in the due course of trend period analyzed for the firm. The return number for the
Walmart Corporation in the period 2016 was around 7.36% and the same dropped down to
around 3.04% in the year. The key reason behind the massive fall in the net profitability of the
Corporation has been primarily due to the fall in the net profitability that has been reported by
the Corporation for the trend period analyzed (Boyas & Teeter, 2017).
Paraphrase This Document
Need a fresh take? Get an instant paraphrase of this document with our AI Paraphraser
4FUNDAMENTALS OF FINANCE
Return on Equity: The return on equity for the Corporation was around 18.24% in the year
2016, which have fallen down to around 9.20% in the year 2019 (Boyas & Teeter, 2017). It is
important to note that there was a decrease in both the equity and the net profitability of the
Corporation whereby the decrease in the profitability has been on a larger scale which lead to the
fall in the return that is contributed to the equity shareholders of the Corporation.
Current Ratio: The current ratio of the firm well displays and reflects the liquidity position of
the Corporation. The ratio also shows the proportion of current assets in proportion to the current
liabilities of the Corporation for the trend period analyzed 2016-2019 (Rakićević et al., 2016).
The ratio for the Corporation in the year 2016 was around 0.93 times and the same has decreased
marginally to around 0.80 times in the year 2019. The decrease in the ratio well reflects that the
management of the Walmart might not be taking adequate steps for increasing the liquidity
position of the Corporation (Chowdhury, 2018).
Quick Ratio: The ratio well reflects the availability of liquid assets that is particularly in the
form of the cash and accounts receivable and omitting the inventory value from the current
assets. The quick ratio for the Corporation was around 0.24 times in the year 2016 which has
remained the same to around 0.23 times in the year 2019. The ratio when analyzed from the
firms operations and industry perspective is quite low and the management should take
sufficient steps for increasing the proportion of the current assets that is placed in response to the
current liabilities of the Corporation.
Inventory Turnover Ratio: The inventory turnover ratio for the Corporation has been around
8.12 times in the year 2016 which has well decreased to around 8.70 times in the trend period.
The turnover ratio for the Corporation has increased which well shows that the proportion of
inventory in correspondence to the total sales or revenue has fallen for the Corporation.
5FUNDAMENTALS OF FINANCE
Inventory Turnover in Days: The inventory turnover in days well shows the amount of time
taken by the Corporation in well converting the inventory value of the Corporation into total
sales. The inventory turnover in days for the Corporation has been around 44.96 days in the year
2016 which has well decreased to around 41.94 days. The decrease in the inventory days well
comes with the decrease in the inventory turnover ratio. The lesser the amount of time taken by
the Corporation in converting the inventory value the more efficient Corporation becomes.
Accounts Receivable Turnover Ratio: The accounts receivable turnover ratio for the
Corporation has been around 85.73 times in the year 2016 which has well decreased to around
81.87 times the decrease in the ratio has been primarily due to the decrease in the receivables
amount. At the same time increase in the sales value of the Corporation has contributed in the
decrease in the ratio. It is good that if the receivable turnover ratio for the Corporation decreases
than the same would be helping the Corporation in well receiving the due amount from the
receivables.
Accounts Receivable in Days: The accounts receivables that would be done in days for the
Corporation will be around 4.26 times in the year 2016 which has well increased to around 4.46
times. The increase in the ratio has been on an marginal basis stating that the Corporation is
taking substantive method in well maintain the time period of receivables amount due.
Accounts Payable Turnover Ratio: The accounts payable turnover ratio for the Corporation
has been around 9.38 times in the year 2016 which has been well decreased to around 8.39 times
in the year 2019. The decrease in the ratio on a prime basis has been particularly due to the
higher proportion of increase in the purchase value that has been made by the Corporation in
contrast to the accounts payable due for the Corporation.
⊘ This is a preview!⊘
Do you want full access?
Subscribe today to unlock all pages.
Trusted by 1+ million students worldwide
6FUNDAMENTALS OF FINANCE
Accounts Payable in Days: The accounts payable in days for the Corporation well shows the
time period the Corporation is taking in paying the payables amount. The accounts payable
amount for the Corporation in the year 2016 was around 38.92 days and has well increased to
around 44.58 days in the year 2019. The increase in the ratio well reflects that the Corporation is
taking a prolonged period of time in paying up the accounts payables of the Corporation (Kim &
Im, 2017).
Earnings Per Share: The EPS of the Corporation shows the earnings that the Corporation is
generating for the equity shareholders of the Corporation on a per share basis (Guo & Wang,
2019). The earnings that the Corporation has generated on a per share basis has been around 4.58
Cents in the year 2016 and the same has fallen to around 2.28 Cents in the year 2019. The
decrease in the EPS of the Corporation comes along with the fall in the profitability of the
Corporation.
Price to Earnings Ratio: The Price to Earnings Ratio or the P/E Ratio for the Corporation well
shows the proportion of share price of the Corporation in respect to the earnings made by the
Corporation on an individual share basis. The P/E ratio for the Corporation was around 13.38
times in the year 2016 which has increased considerably to around 40.41 times. The ratio value
also indicates the amount of valuation or price that the shareholders are ready to pay based on the
share price.
Conclusion
The analysis conducted for the Corporation well states that the profitability aspects of the
Corporation is primarily affected due to the fall in the profitability and the revenue base of the
Corporation. However, as analysed the efficiency and operational capability of the Walmart
Paraphrase This Document
Need a fresh take? Get an instant paraphrase of this document with our AI Paraphraser
7FUNDAMENTALS OF FINANCE
Corporation has well increased in the trend period 2019-2016 due to better management of
resources and strategic management done by the Corporation for resource management.
Corporation has well increased in the trend period 2019-2016 due to better management of
resources and strategic management done by the Corporation for resource management.
8FUNDAMENTALS OF FINANCE
References
Boyas, E., & Teeter, R. (2017). Teaching Financial Ratio Analysis using XBRL.
In Developments in Business Simulation and Experiential Learning: Proceedings of the
Annual ABSEL conference (Vol. 44, No. 1).
Campisi, D., Mancuso, P., Mastrodonato, S. L., & Morea, D. (2019). Efficiency assessment of
knowledge intensive business services industry in Italy: data envelopment analysis
(DEA) and financial ratio analysis. Measuring Business Excellence.
Chowdhury, M. (2018). Performance Measures through Financial Ratio Analysis of (Doctoral
dissertation, Daffodil International University).
Guo, L., & Wang, Z. (2019). Ratio Analysis of J Sainsbury plc Financial Performance between
2015 and 2018 in Comparison with Tesco and Morrisons. American Journal of Industrial
and Business Management, 9, 325-341.
Kim, J., & Im, C. (2017). Study on corporate social responsibility (CSR): focus on tax avoidance
and financial ratio analysis. Sustainability, 9(10), 1710.
Myšková, R., & Hájek, P. (2017). Comprehensive assessment of firm financial performance
using financial ratios and linguistic analysis of annual reports. Journal of International
Studies, volume 10, issue: 4.
Nwanji, T. I., Olowookere, J. K., Egbide, B. C., Fakile, S. A., Lawal, A. I., Ajayi, S. A., ... &
Eluyela, D. F. (2018). Financial Ratio Analysis and Market Price of Share of Selected
⊘ This is a preview!⊘
Do you want full access?
Subscribe today to unlock all pages.
Trusted by 1+ million students worldwide
9FUNDAMENTALS OF FINANCE
Quoted Agriculture and Agro-allied Firms in Nigeria After Adoption of International
Financial Reporting Standard. The Journal of Social Sciences Research, 4(12), 736-744.
Rakićević, A., Milošević, P., Petrović, B., & Radojević, D. G. (2016). DuPont financial ratio
analysis using logical aggregation. In Soft computing applications (pp. 727-739).
Springer, Cham.
Sayari, N., & Mugan, C. S. (2017). Industry specific financial distress modeling. BRQ Business
Research Quarterly, 20(1), 45-62.
Setiawan, H., & Amboningtyas, D. (2018). FINANCIAL RATIO ANALYSIS FOR
PREDICTING FINANCIAL DISTRESS CONDITIONS (Study on Telecommunication
Companies Listed In Indonesia Stock Exchange Period 2010-2016). Journal of
Management, 4(4).
Yahoo is now part of Verizon Media. (2020). Finance.yahoo.com. Retrieved 15 January 2020,
from https://finance.yahoo.com/quote/WMT/balance-sheet?p=WMT
Paraphrase This Document
Need a fresh take? Get an instant paraphrase of this document with our AI Paraphraser
10FUNDAMENTALS OF FINANCE
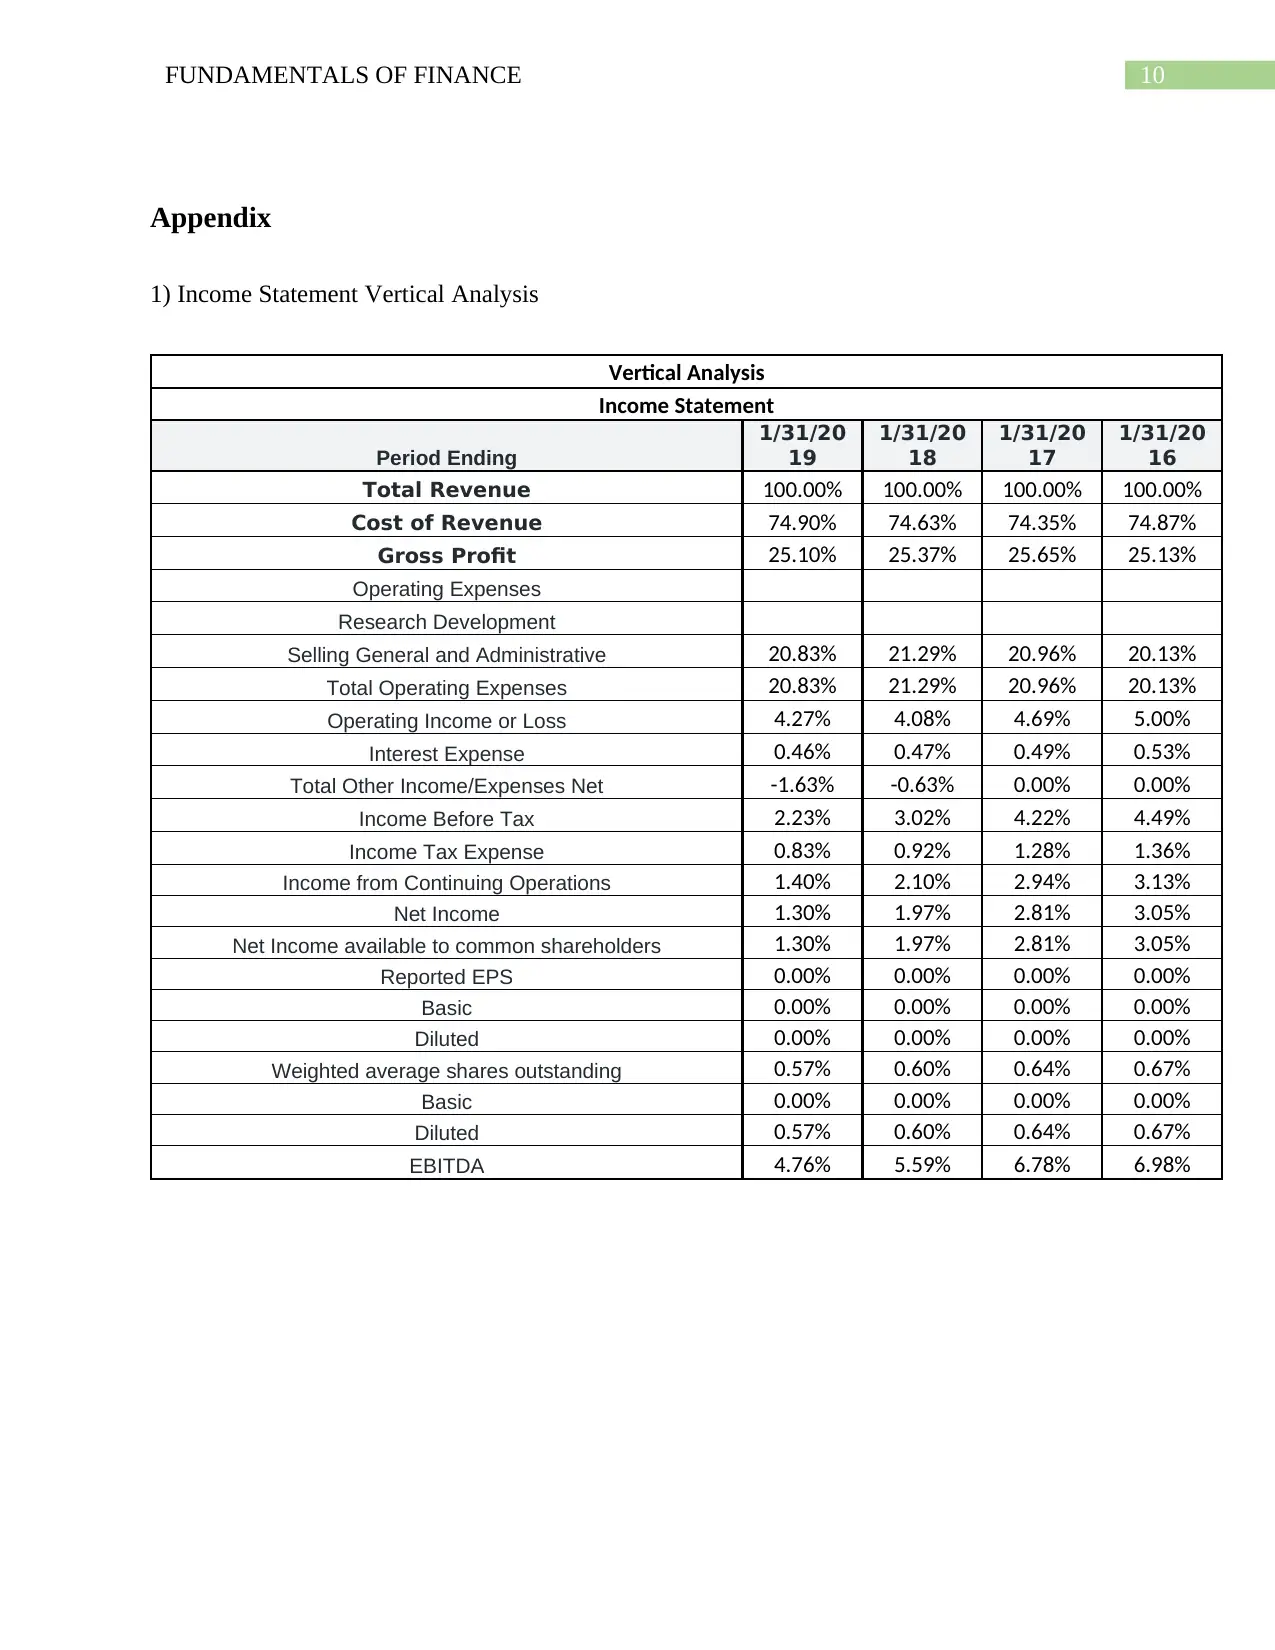
Appendix
1) Income Statement Vertical Analysis
Vertical Analysis
Income Statement
Period Ending
1/31/20
19
1/31/20
18
1/31/20
17
1/31/20
16
Total Revenue 100.00% 100.00% 100.00% 100.00%
Cost of Revenue 74.90% 74.63% 74.35% 74.87%
Gross Profit 25.10% 25.37% 25.65% 25.13%
Operating Expenses
Research Development
Selling General and Administrative 20.83% 21.29% 20.96% 20.13%
Total Operating Expenses 20.83% 21.29% 20.96% 20.13%
Operating Income or Loss 4.27% 4.08% 4.69% 5.00%
Interest Expense 0.46% 0.47% 0.49% 0.53%
Total Other Income/Expenses Net -1.63% -0.63% 0.00% 0.00%
Income Before Tax 2.23% 3.02% 4.22% 4.49%
Income Tax Expense 0.83% 0.92% 1.28% 1.36%
Income from Continuing Operations 1.40% 2.10% 2.94% 3.13%
Net Income 1.30% 1.97% 2.81% 3.05%
Net Income available to common shareholders 1.30% 1.97% 2.81% 3.05%
Reported EPS 0.00% 0.00% 0.00% 0.00%
Basic 0.00% 0.00% 0.00% 0.00%
Diluted 0.00% 0.00% 0.00% 0.00%
Weighted average shares outstanding 0.57% 0.60% 0.64% 0.67%
Basic 0.00% 0.00% 0.00% 0.00%
Diluted 0.57% 0.60% 0.64% 0.67%
EBITDA 4.76% 5.59% 6.78% 6.98%
11FUNDAMENTALS OF FINANCE
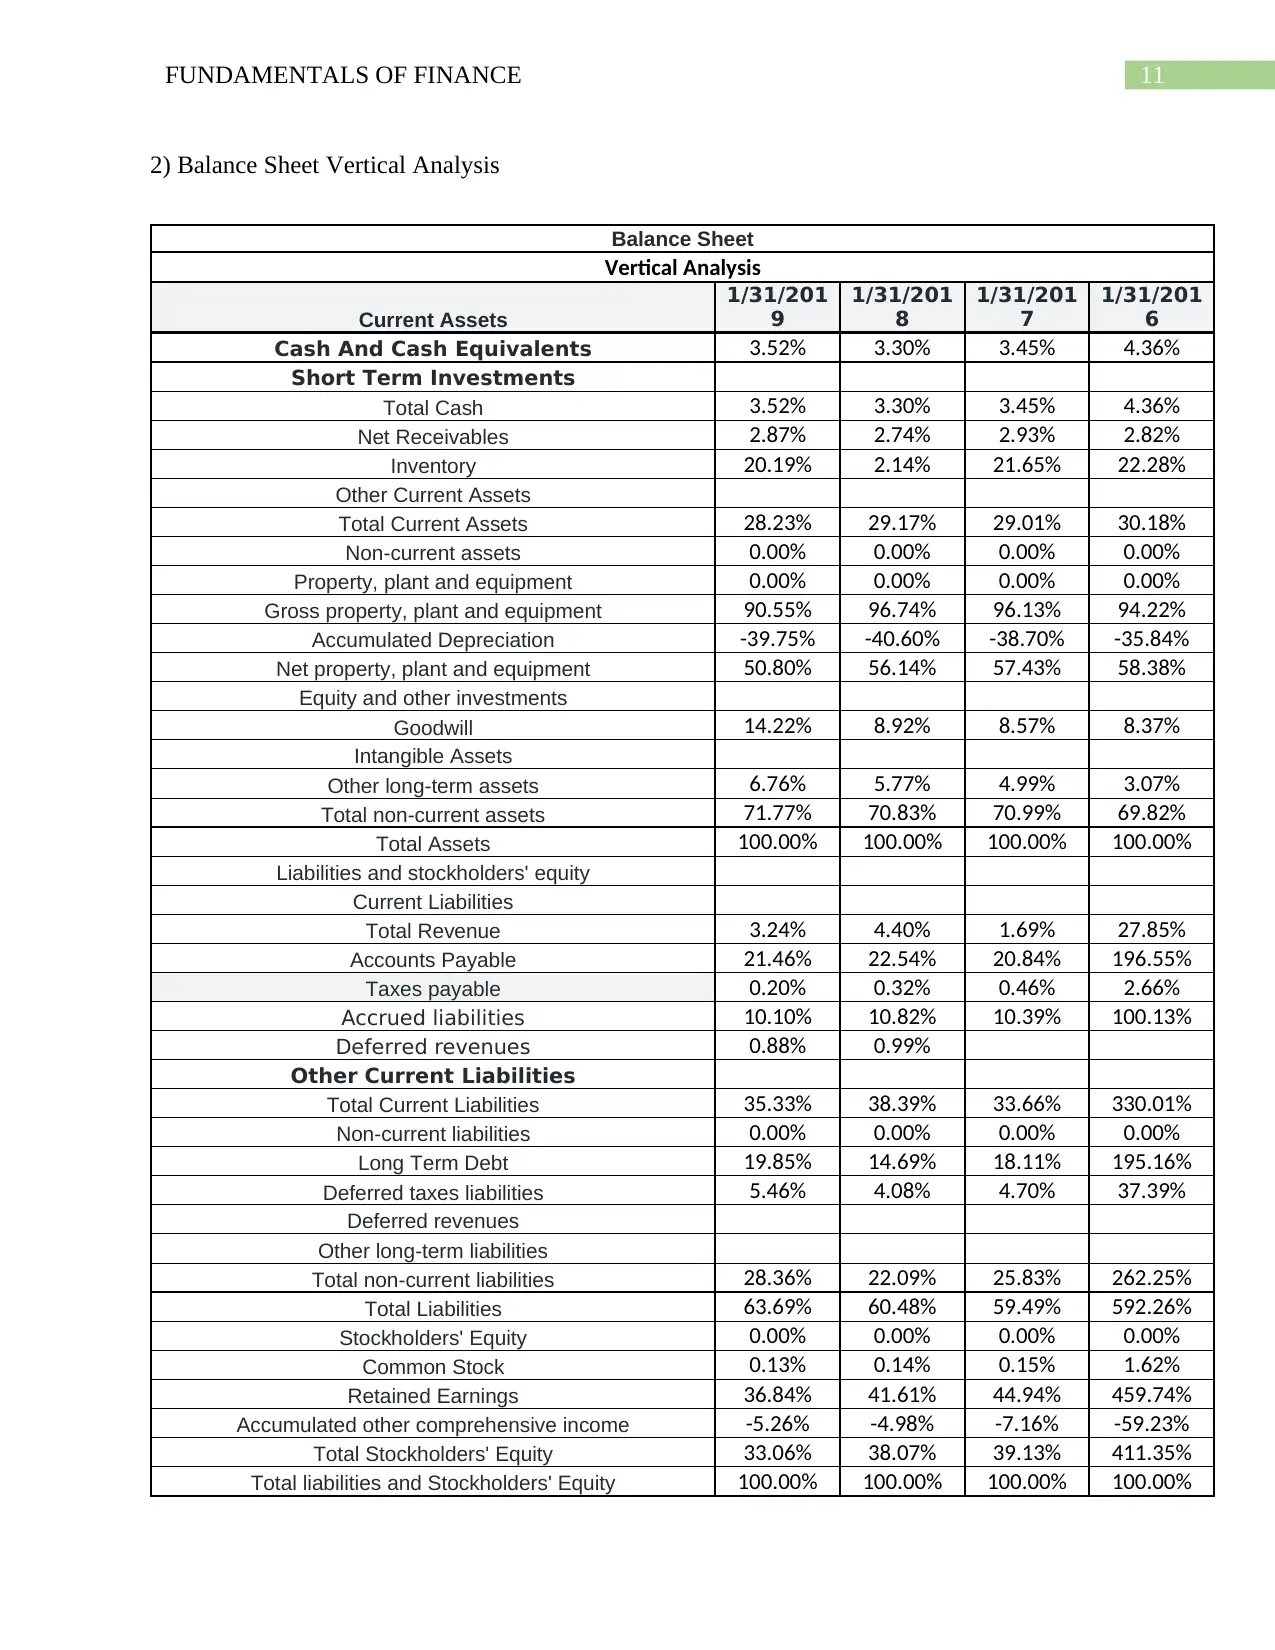
2) Balance Sheet Vertical Analysis
Balance Sheet
Vertical Analysis
Current Assets
1/31/201
9
1/31/201
8
1/31/201
7
1/31/201
6
Cash And Cash Equivalents 3.52% 3.30% 3.45% 4.36%
Short Term Investments
Total Cash 3.52% 3.30% 3.45% 4.36%
Net Receivables 2.87% 2.74% 2.93% 2.82%
Inventory 20.19% 2.14% 21.65% 22.28%
Other Current Assets
Total Current Assets 28.23% 29.17% 29.01% 30.18%
Non-current assets 0.00% 0.00% 0.00% 0.00%
Property, plant and equipment 0.00% 0.00% 0.00% 0.00%
Gross property, plant and equipment 90.55% 96.74% 96.13% 94.22%
Accumulated Depreciation -39.75% -40.60% -38.70% -35.84%
Net property, plant and equipment 50.80% 56.14% 57.43% 58.38%
Equity and other investments
Goodwill 14.22% 8.92% 8.57% 8.37%
Intangible Assets
Other long-term assets 6.76% 5.77% 4.99% 3.07%
Total non-current assets 71.77% 70.83% 70.99% 69.82%
Total Assets 100.00% 100.00% 100.00% 100.00%
Liabilities and stockholders' equity
Current Liabilities
Total Revenue 3.24% 4.40% 1.69% 27.85%
Accounts Payable 21.46% 22.54% 20.84% 196.55%
Taxes payable 0.20% 0.32% 0.46% 2.66%
Accrued liabilities 10.10% 10.82% 10.39% 100.13%
Deferred revenues 0.88% 0.99%
Other Current Liabilities
Total Current Liabilities 35.33% 38.39% 33.66% 330.01%
Non-current liabilities 0.00% 0.00% 0.00% 0.00%
Long Term Debt 19.85% 14.69% 18.11% 195.16%
Deferred taxes liabilities 5.46% 4.08% 4.70% 37.39%
Deferred revenues
Other long-term liabilities
Total non-current liabilities 28.36% 22.09% 25.83% 262.25%
Total Liabilities 63.69% 60.48% 59.49% 592.26%
Stockholders' Equity 0.00% 0.00% 0.00% 0.00%
Common Stock 0.13% 0.14% 0.15% 1.62%
Retained Earnings 36.84% 41.61% 44.94% 459.74%
Accumulated other comprehensive income -5.26% -4.98% -7.16% -59.23%
Total Stockholders' Equity 33.06% 38.07% 39.13% 411.35%
Total liabilities and Stockholders' Equity 100.00% 100.00% 100.00% 100.00%
⊘ This is a preview!⊘
Do you want full access?
Subscribe today to unlock all pages.
Trusted by 1+ million students worldwide
1 out of 14
Related Documents


Your All-in-One AI-Powered Toolkit for Academic Success.
+13062052269
info@desklib.com
Available 24*7 on WhatsApp / Email
![[object Object]](/_next/static/media/star-bottom.7253800d.svg)
Unlock your academic potential
Copyright © 2020–2026 A2Z Services. All Rights Reserved. Developed and managed by ZUCOL.