Banking Academy of Vietnam: Walmart Inc. Financial Statement Analysis
VerifiedAdded on 2021/07/20
|20
|2782
|170
Report
AI Summary
This report provides a detailed financial analysis of Walmart Inc., examining its performance from 2015 to 2018. The analysis includes vertical and horizontal analyses of assets, liabilities, stockholders' equity, and the income statement, offering insights into trends and changes over time. Ratio analysis covers short-term, long-term, liquidity, debt, solvency, and profitability, along with a DuPont analysis to assess Walmart's financial health. The report delves into Walmart's history, ownership structure, and product offerings, setting the context for the financial assessments. Key findings highlight changes in cash flow, debt levels, and profitability ratios, providing a comprehensive overview of Walmart's financial position and performance during the specified period. The report is contributed by a student and available on Desklib.
Wal-Mart Inc. 1
WAL-MART INC.
Team Members:
Luong Le Hoang Minh
Nguyen Tien Dat
Le Nhat Linh
Nguyen Minh Hoang
INTERPRET FINANCIAL STATEMENTS
Banking Academy of Vietnam
December 22nd, 2018
WAL-MART INC.
Team Members:
Luong Le Hoang Minh
Nguyen Tien Dat
Le Nhat Linh
Nguyen Minh Hoang
INTERPRET FINANCIAL STATEMENTS
Banking Academy of Vietnam
December 22nd, 2018
Paraphrase This Document
Need a fresh take? Get an instant paraphrase of this document with our AI Paraphraser
Wal-Mart Inc. 2
WALMART’S FINANCIAL STATEMENTS ANALYSIS
Table of Contents
I. Introduction to Walmart.......................................................................................................................3
1. General Information................................................................................................................................3
2. Ownership:..............................................................................................................................................5
3. Products/services....................................................................................................................................6
II. VERTICAL ANALYSIS.............................................................................................................................8
1. ASSETS.....................................................................................................................................................8
2. LIABILITIES AND STOCKHOLDERS’ EQUITY:..............................................................................................9
3. INCOME STATEMENT.............................................................................................................................10
III. HORIZONTAL ANALYSIS.....................................................................................................................11
1. ASSETS...................................................................................................................................................11
2. LIABILITES AND STOCKHOLDERS’ EQUITY..............................................................................................12
3. INCOME STATEMENT.............................................................................................................................14
4. CASH FLOWS..........................................................................................................................................16
IV. RATIO ANALYSIS...............................................................................................................................18
1. Short-term activity.................................................................................................................................18
2. Long-term activity..................................................................................................................................19
3. Liquidity.................................................................................................................................................19
4. Debt and Solvency.................................................................................................................................20
5. Profitability............................................................................................................................................20
6. DuPont Analysis.....................................................................................................................................21
Wal-Mart Inc. 3
I. Introduction to Walmart
1. General Information
a. Founder:
Wal-Mart was founded by Sam Walton in 1962 in Rogers, Arkansas. Sam Walton was born in
1918 in Kingfisher, Oklahoma. In 1943 he got married with Helen Robson. In 1950, the Waltons
family moved from Newport to Bentonville, in which Sam opened Walton’s 5&10 on the
downtown square. In 1962, Sam opened the first Wal-Mart at the age of 44 in Arkansas.
Although the company was established in 1962, it was incorporated on October 31, 1969.
b. History of development.
In the 1970s, the company was established in 1962, in the first 10 years of development, Wal-
Mart became a publicly traded company. Its first stock was sold at $16.50 per share in 1970. In
1972, the company was listed on the New York Stock Exchange (WMT). With 51 stores, Wal-
Mart records sales of $78 million. At the end of the 1970s, The Wal-Mart Foundation is
established.
In the 1980s, The Walton family establishes the Walton Family Foundation in 1980. Wal-Mart
reaches $1 billion in annual sales, faster than any other company at that time. Wal-Mart has 276
stores and employs 21,000 associates. In 1987, The Company installs the largest private satellite
communication system in the U.S., linking the company's operations through voice, data and
video communication.
In the 1990s, through a joint venture with Cifra, a Mexican retail company, Wal-Mart goes
global, opening a Sam’s Club in Mexico City. In 1992, Sam Walton passed away at age 74, Rob
Walton becomes chairman of the board. Wal-Mart employs 371,000 associates in 1,928 stores
⊘ This is a preview!⊘
Do you want full access?
Subscribe today to unlock all pages.
Trusted by 1+ million students worldwide
Wal-Mart Inc. 4
and clubs. 1997, Wal-Mart celebrates its first $100 billion sales year. At the end of the 1990s,
Wal-Mart expands into Canada, and China, and enters the United Kingdom with the acquisition
of Asda.
In the 2000s, at the beginning of the decade, H. Lee Scott, Jr. succeeds David Glass as CEO.
Walmart.com is founded, allowing U.S. customers to shop online. Wal-Mart employs more than
1.1 million associates in 3,989 stores and clubs worldwide. Wal-Mart tops the Fortune 500
ranking of America's largest companies. Wal-Mart enters the Japanese market through its
investment in Seiyu. In 2009, Mike Duke becomes CEO. Wal-Mart enters Chile with the
acquisition of a majority stake in D&S S.A. For the first time, Wal-Mart exceeds $400 billion in
annual sales.
In the 2010s, Bharti Wal-Mart, a joint venture, opens its first store in India in 2010. In 2011,
Wal-Mart expands its business into South Africa by acquiring 51% of Massmart Holdings
Limited. In 2015, Doug McMillon succeeds Mike Duke as CEO. The company employs 2.3
million associates worldwide and serves more than 200 million customers each week at more
than 11,000 stores in 27 countries. Rob Walton retires as chairman of the board of directors for
Wal-Mart Stores, Inc. He continues to serve as a director. Greg Penner succeeds Rob Walton as
chairman of Wal-Mart Stores, Inc. In 2016, Wal-Mart opens its Culinary & Innovation Center in
Bentonville to develop and test new and innovative products. Some products of Wal-Mart: Wal-
Mart Pay, Online retailer Jet.com, trains Academy in South Carolina. In 2017, John Furner
becomes Sam's Club's new president and CEO. Wal-Mart acquires Moosejaw, ModCloth,
Bonobos and Parcel. Jet acquires ShoeBuy.com, which is later renamed Shoes.com. Wal-Mart
launches Store No 8, a tech incubator, with a focus to drive commerce forward and transform the
future of retail. Wal-Mart launches Project Gigaton, asking suppliers to help reduce greenhouse
Paraphrase This Document
Need a fresh take? Get an instant paraphrase of this document with our AI Paraphraser
Wal-Mart Inc. 5
gas emissions from its supply chain by 1 gigaton. The company also sets a new goal to reduce its
consumables chemical footprint by 10% by 2022. In 2018, the company changes its legal name
from Wal-Mart Stores, Inc. to Wal-Mart Inc. Wal-Mart announces plans to increase its starting
wage rate for all U.S. hourly associates to $11, expand maternity and parental leave benefits and
provide a one-time cash bonus for eligible associates.
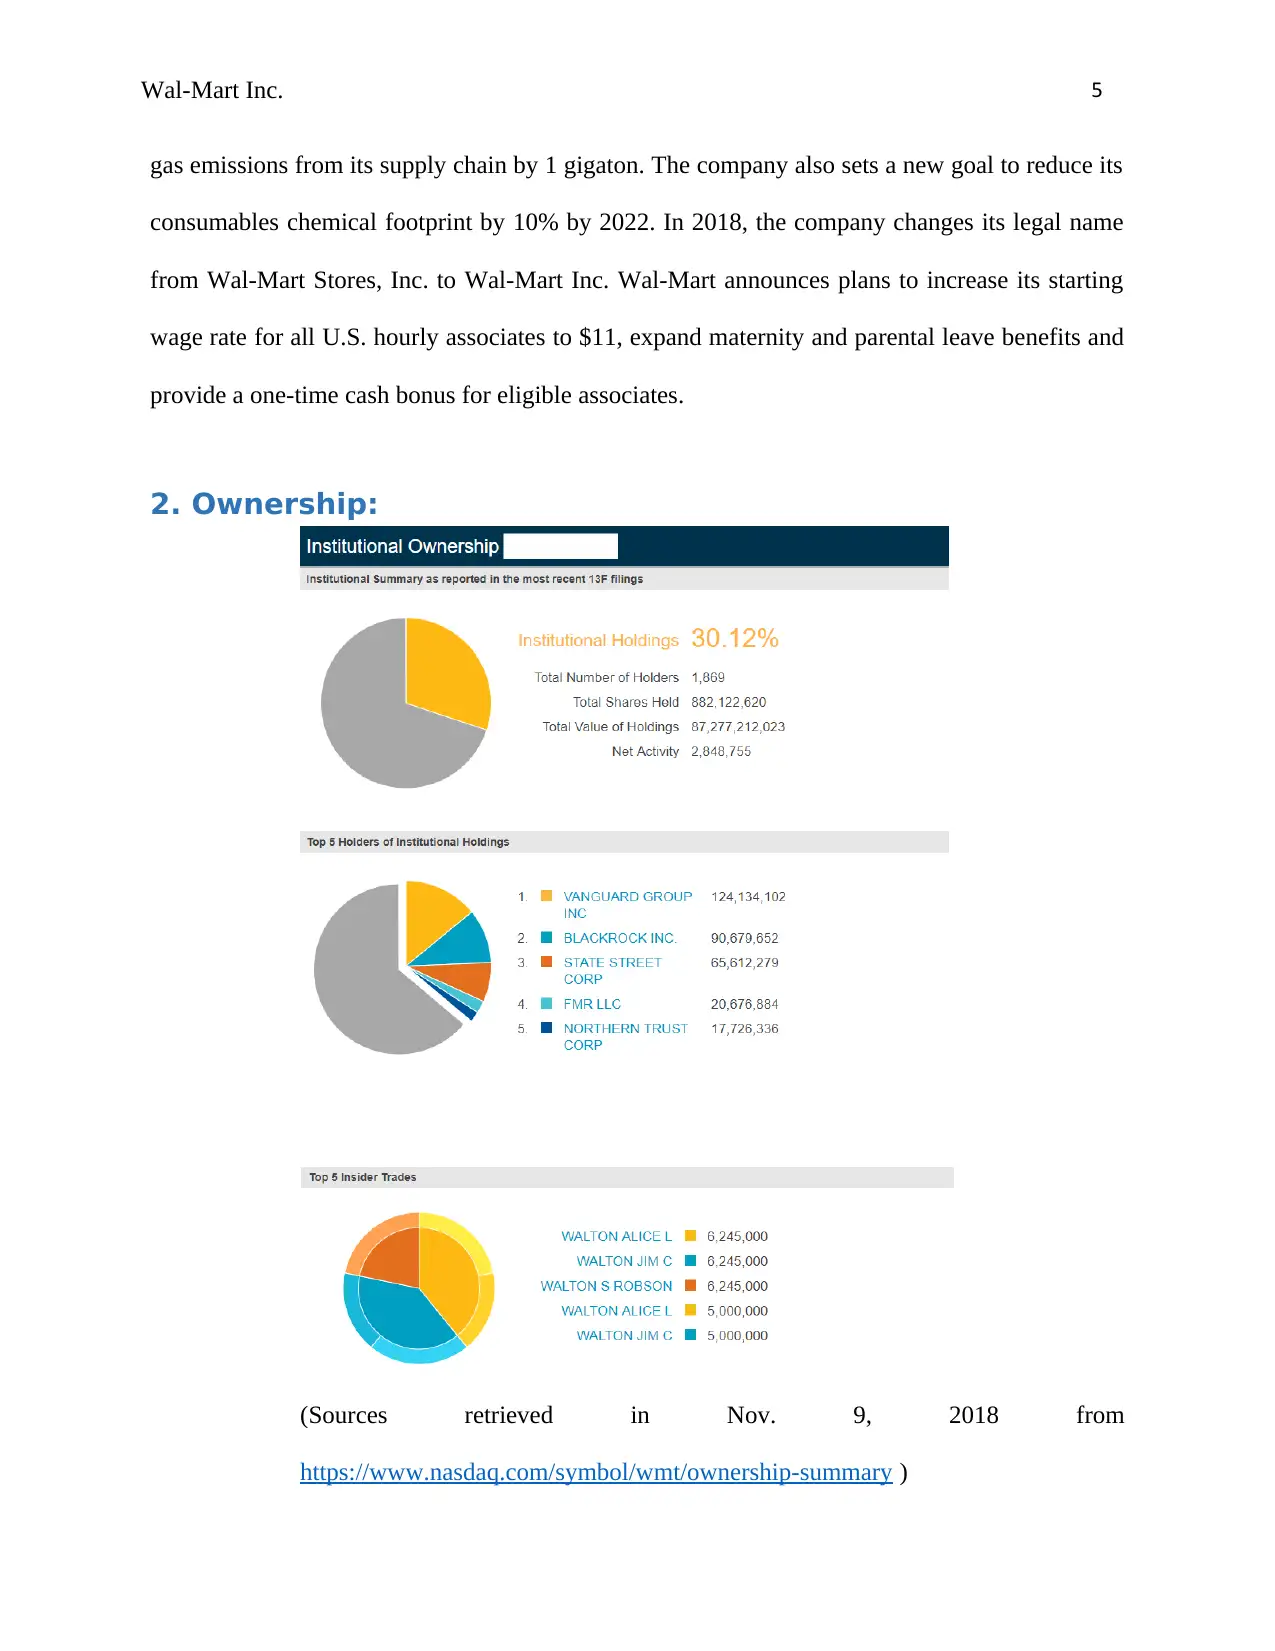
2. Ownership:
(Sources retrieved in Nov. 9, 2018 from
https://www.nasdaq.com/symbol/wmt/ownership-summary )
gas emissions from its supply chain by 1 gigaton. The company also sets a new goal to reduce its
consumables chemical footprint by 10% by 2022. In 2018, the company changes its legal name
from Wal-Mart Stores, Inc. to Wal-Mart Inc. Wal-Mart announces plans to increase its starting
wage rate for all U.S. hourly associates to $11, expand maternity and parental leave benefits and
provide a one-time cash bonus for eligible associates.
2. Ownership:
(Sources retrieved in Nov. 9, 2018 from
https://www.nasdaq.com/symbol/wmt/ownership-summary )
Wal-Mart Inc. 6
The total number of holders of the Wal-Mart’s were 1,869 with 882,122,620 shares were held.
Total number of holdings was 87,277,212,023 with the net activities of 2,848,755. According to
the table, the institutional holdings accounted for a little bit more than a quarter with 30.12%.
Which means that the other holdings were make up the larger percent of nearly 70%.
Until November 9, 2018, there were 5 largest insider trades which are all come from the
Waltons. Walton Alice L, Walton S Robson, and Walton Jim C traded the same biggest number
of share a time with 6,425,000 shares. The smallest number of share traded were 5,000,000 a
time. However, Both Alice and Jim did trade the largest shares of 12,850,000 shares each person.
Therefore in the top 5 insider trade, Robson had the smallest portion.
3. Products/services
Wal-Mart is a multidisciplinary company. It offers a wide variety of services and facilities
ranging from currency services, online shopping to health care and pets services. Overall, there
are 3 main services that Wal-Mart has already provided.
- Money Services:
o Credit & Prepaid Debit Cards
Wal-Mart Credit Card
Wal-Mart MoneyCard
American Express Bluebird
o Send & Receive Money
Money Transfers
Bill Pay & Money Orders
Check Cashing
⊘ This is a preview!⊘
Do you want full access?
Subscribe today to unlock all pages.
Trusted by 1+ million students worldwide
Wal-Mart Inc. 7
o Gift Cards
Walmart Gift Cards
Walmart eGift Cards
Visa/MasterCard/AMEX Gift Cards
- Product Services
o Protection plans
Walmart Protection Plans
File a Claim
o In-home Services
TV Wall Mounting
Furniture Assembly
Smart Home
- Business Services
o Walmart for Business
Corporate Gift Card Program
Promotional Products
Business Credit Card
Paraphrase This Document
Need a fresh take? Get an instant paraphrase of this document with our AI Paraphraser
Wal-Mart Inc. 8
II. VERTICAL ANALYSIS
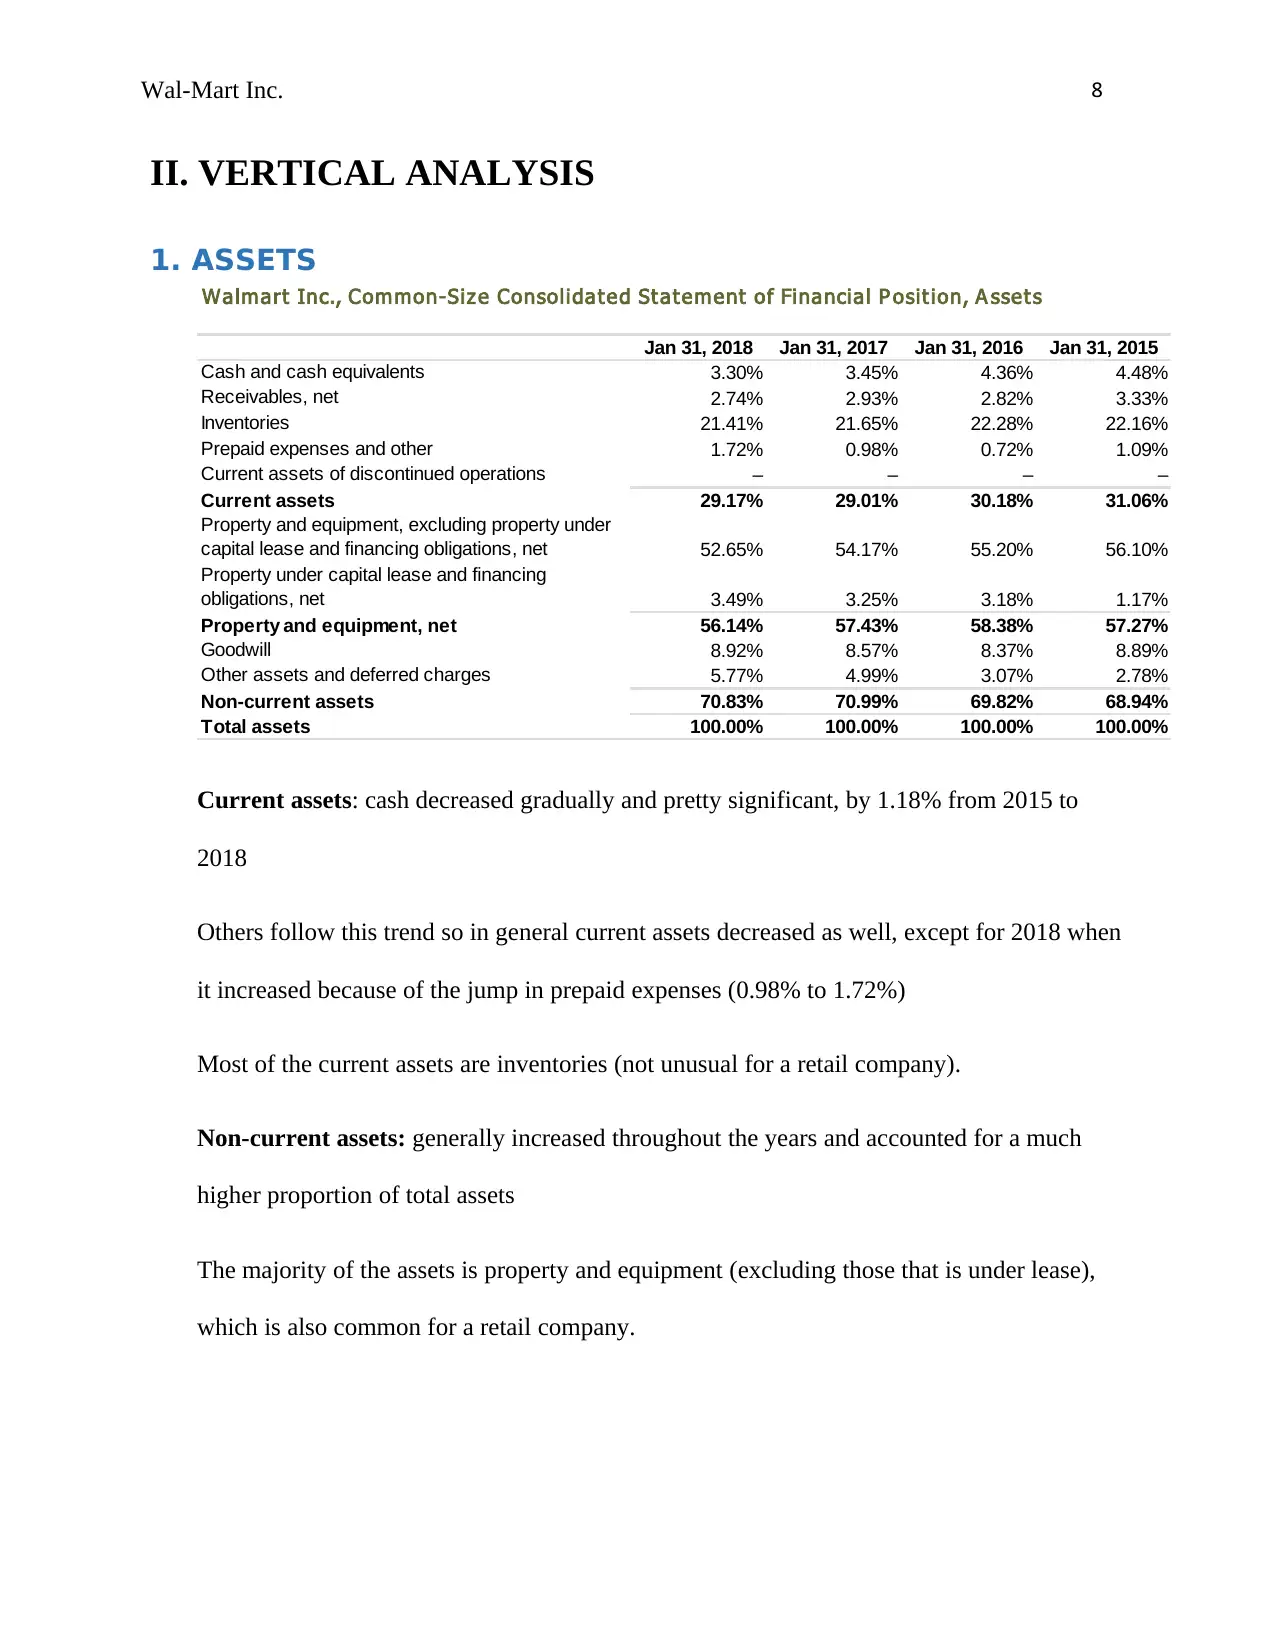
1. ASSETS
Walmart Inc., Common-Siz e Consolidat ed St at ement of Financial P osit ion, A sset s
Jan 31, 2018 Jan 31, 2017 Jan 31, 2016 Jan 31, 2015
Cash and cash equivalents 3.30% 3.45% 4.36% 4.48%
Receivables, net 2.74% 2.93% 2.82% 3.33%
Inventories 21.41% 21.65% 22.28% 22.16%
Prepaid expenses and other 1.72% 0.98% 0.72% 1.09%
Current assets of discontinued operations – – – –
Current assets 29.17% 29.01% 30.18% 31.06%
Property and equipment, excluding property under
capital lease and financing obligations, net 52.65% 54.17% 55.20% 56.10%
Property under capital lease and financing
obligations, net 3.49% 3.25% 3.18% 1.17%
Property and equipment, net 56.14% 57.43% 58.38% 57.27%
Goodwill 8.92% 8.57% 8.37% 8.89%
Other assets and deferred charges 5.77% 4.99% 3.07% 2.78%
Non-current assets 70.83% 70.99% 69.82% 68.94%
Total assets 100.00% 100.00% 100.00% 100.00%
Current assets: cash decreased gradually and pretty significant, by 1.18% from 2015 to
2018
Others follow this trend so in general current assets decreased as well, except for 2018 when
it increased because of the jump in prepaid expenses (0.98% to 1.72%)
Most of the current assets are inventories (not unusual for a retail company).
Non-current assets: generally increased throughout the years and accounted for a much
higher proportion of total assets
The majority of the assets is property and equipment (excluding those that is under lease),
which is also common for a retail company.
II. VERTICAL ANALYSIS
1. ASSETS
Walmart Inc., Common-Siz e Consolidat ed St at ement of Financial P osit ion, A sset s
Jan 31, 2018 Jan 31, 2017 Jan 31, 2016 Jan 31, 2015
Cash and cash equivalents 3.30% 3.45% 4.36% 4.48%
Receivables, net 2.74% 2.93% 2.82% 3.33%
Inventories 21.41% 21.65% 22.28% 22.16%
Prepaid expenses and other 1.72% 0.98% 0.72% 1.09%
Current assets of discontinued operations – – – –
Current assets 29.17% 29.01% 30.18% 31.06%
Property and equipment, excluding property under
capital lease and financing obligations, net 52.65% 54.17% 55.20% 56.10%
Property under capital lease and financing
obligations, net 3.49% 3.25% 3.18% 1.17%
Property and equipment, net 56.14% 57.43% 58.38% 57.27%
Goodwill 8.92% 8.57% 8.37% 8.89%
Other assets and deferred charges 5.77% 4.99% 3.07% 2.78%
Non-current assets 70.83% 70.99% 69.82% 68.94%
Total assets 100.00% 100.00% 100.00% 100.00%
Current assets: cash decreased gradually and pretty significant, by 1.18% from 2015 to
2018
Others follow this trend so in general current assets decreased as well, except for 2018 when
it increased because of the jump in prepaid expenses (0.98% to 1.72%)
Most of the current assets are inventories (not unusual for a retail company).
Non-current assets: generally increased throughout the years and accounted for a much
higher proportion of total assets
The majority of the assets is property and equipment (excluding those that is under lease),
which is also common for a retail company.
Wal-Mart Inc. 9
2. LIABILITIES AND STOCKHOLDERS’ EQUITY:
Walmart Inc., Common-Siz e Consolidat ed St at ement of Financial P osit ion, Liabilit ies and St ock holders' E
Jan 31, 2018 Jan 31, 2017 Jan 31, 2016 Jan 31, 2015
Short-term borrowings 2.57% 0.55% 1.36% 0.78%
Accounts payable 22.54% 20.84% 19.28% 18.86%
Accrued wages and benefits 3.42% 3.07% 2.91% 2.43%
Self-insurance 1.83% 1.97% 1.71% 1.62%
Accrued non-income taxes 1.50% 1.42% 1.27% 1.27%
Deferred gift card revenue 0.99% 0.93% – –
Other 3.08% 3.00% 3.93% 4.07%
Accrued liabilities 10.82% 10.39% 9.82% 9.40%
Accrued income taxes 0.32% 0.46% 0.26% 0.50%
Long-term debt due within one year 1.83% 1.13% 1.38% 2.36%
Capital lease and financing obligations due within
one year 0.33% 0.28% 0.28% 0.14%
Current liabilities of discontinued operations – – – –
Current liabilities 38.39% 33.66% 32.38% 32.04%
Long-term debt, excluding due within one year 14.69% 18.11% 19.15% 20.17%
Long-term capital lease and financing obligations,
excluding due within one year 3.32% 3.02% 2.91% 1.28%
Deferred income taxes and other 4.08% 4.70% 3.67% 4.32%
Non-current liabilities 22.09% 25.83% 25.73% 25.77%
Total liabilities 60.48% 59.49% 58.11% 57.81%
Redeemable noncontrolling interest – – – –
Common stock 0.14% 0.15% 0.16% 0.16%
Capital in excess of par value 1.29% 1.19% 0.90% 1.21%
Retained earnings 41.61% 44.94% 45.10% 42.11%
Accumulated other comprehensive loss -4.98% -7.16% -5.81% -3.52%
Total Walmart shareholders' equity 38.07% 39.13% 40.36% 39.96%
Nonredeemable noncontrolling interest 1.44% 1.38% 1.54% 2.23%
Total equity 39.52% 40.51% 41.89% 42.19%
Total liabilities, redeemable noncontrolling
interest, and equity 100.00% 100.00% 100.00% 100.00%
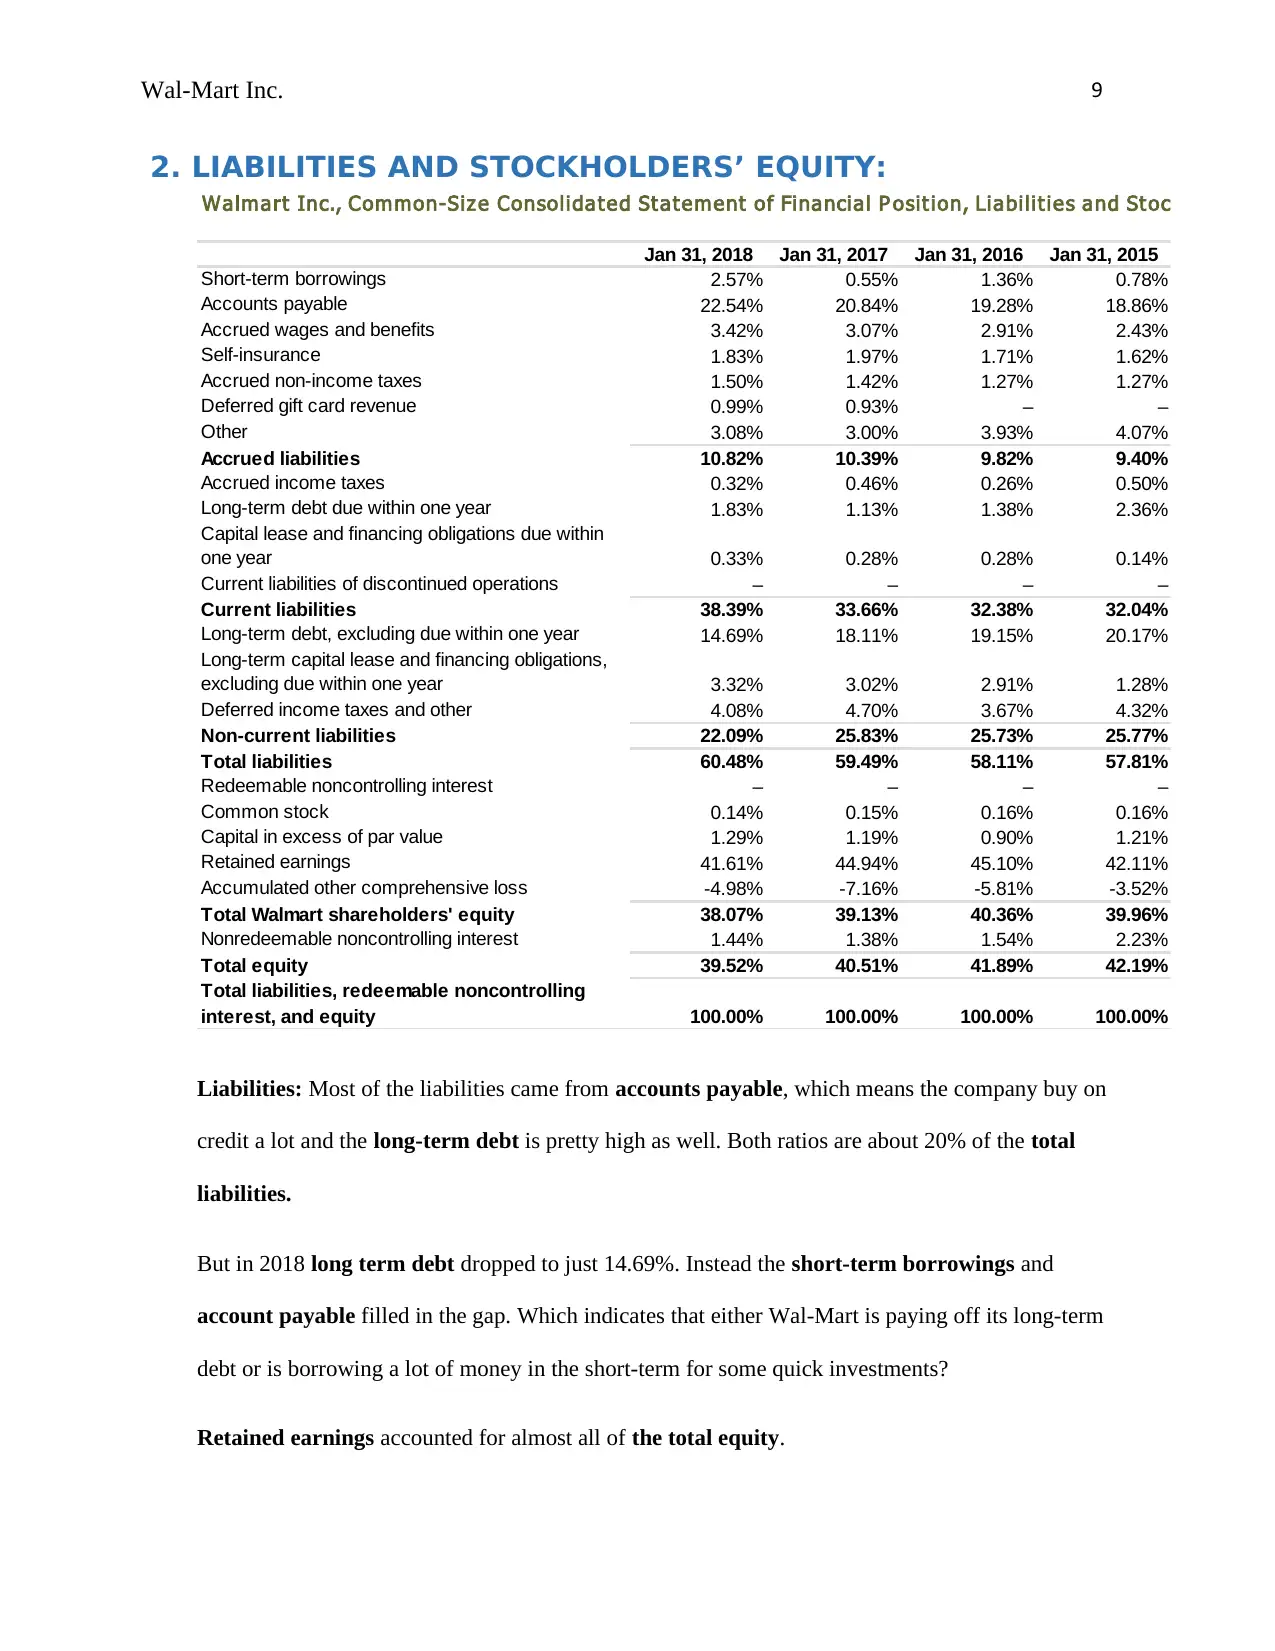
Liabilities: Most of the liabilities came from accounts payable, which means the company buy on
credit a lot and the long-term debt is pretty high as well. Both ratios are about 20% of the total
liabilities.
But in 2018 long term debt dropped to just 14.69%. Instead the short-term borrowings and
account payable filled in the gap. Which indicates that either Wal-Mart is paying off its long-term
debt or is borrowing a lot of money in the short-term for some quick investments?
Retained earnings accounted for almost all of the total equity.
2. LIABILITIES AND STOCKHOLDERS’ EQUITY:
Walmart Inc., Common-Siz e Consolidat ed St at ement of Financial P osit ion, Liabilit ies and St ock holders' E
Jan 31, 2018 Jan 31, 2017 Jan 31, 2016 Jan 31, 2015
Short-term borrowings 2.57% 0.55% 1.36% 0.78%
Accounts payable 22.54% 20.84% 19.28% 18.86%
Accrued wages and benefits 3.42% 3.07% 2.91% 2.43%
Self-insurance 1.83% 1.97% 1.71% 1.62%
Accrued non-income taxes 1.50% 1.42% 1.27% 1.27%
Deferred gift card revenue 0.99% 0.93% – –
Other 3.08% 3.00% 3.93% 4.07%
Accrued liabilities 10.82% 10.39% 9.82% 9.40%
Accrued income taxes 0.32% 0.46% 0.26% 0.50%
Long-term debt due within one year 1.83% 1.13% 1.38% 2.36%
Capital lease and financing obligations due within
one year 0.33% 0.28% 0.28% 0.14%
Current liabilities of discontinued operations – – – –
Current liabilities 38.39% 33.66% 32.38% 32.04%
Long-term debt, excluding due within one year 14.69% 18.11% 19.15% 20.17%
Long-term capital lease and financing obligations,
excluding due within one year 3.32% 3.02% 2.91% 1.28%
Deferred income taxes and other 4.08% 4.70% 3.67% 4.32%
Non-current liabilities 22.09% 25.83% 25.73% 25.77%
Total liabilities 60.48% 59.49% 58.11% 57.81%
Redeemable noncontrolling interest – – – –
Common stock 0.14% 0.15% 0.16% 0.16%
Capital in excess of par value 1.29% 1.19% 0.90% 1.21%
Retained earnings 41.61% 44.94% 45.10% 42.11%
Accumulated other comprehensive loss -4.98% -7.16% -5.81% -3.52%
Total Walmart shareholders' equity 38.07% 39.13% 40.36% 39.96%
Nonredeemable noncontrolling interest 1.44% 1.38% 1.54% 2.23%
Total equity 39.52% 40.51% 41.89% 42.19%
Total liabilities, redeemable noncontrolling
interest, and equity 100.00% 100.00% 100.00% 100.00%
Liabilities: Most of the liabilities came from accounts payable, which means the company buy on
credit a lot and the long-term debt is pretty high as well. Both ratios are about 20% of the total
liabilities.
But in 2018 long term debt dropped to just 14.69%. Instead the short-term borrowings and
account payable filled in the gap. Which indicates that either Wal-Mart is paying off its long-term
debt or is borrowing a lot of money in the short-term for some quick investments?
Retained earnings accounted for almost all of the total equity.
⊘ This is a preview!⊘
Do you want full access?
Subscribe today to unlock all pages.
Trusted by 1+ million students worldwide
Wal-Mart Inc. 10
3. INCOME STATEMENT
Walmart Inc., Common-Siz e Consolidat ed Income St at ement
12 months ended Jan 31, 2018 Jan 31, 2017 Jan 31, 2016 Jan 31, 2015
Net sales 100.00% 100.00% 100.00% 100.00%
Cost of sales -75.32% -75.06% -75.42% -75.71%
Gross profit 24.68% 24.94% 24.58% 24.29%
Membership and other income 0.92% 0.95% 0.73% 0.71%
Operating, selling, general and administrative
expenses -21.48% -21.16% -20.28% -19.37%
Operating income 4.12% 4.73% 5.04% 5.63%
Interest expense, debt, capital lease and financing
obligations -0.47% -0.49% -0.53% -0.51%
Interest income 0.03% 0.02% 0.02% 0.02%
Interest, net -0.44% -0.47% -0.52% -0.49%
Loss on extinguishment of debt -0.63% – – –
Income from continuing operations before
income taxes 3.05% 4.26% 4.52% 5.14%
Provision for income taxes -0.93% -1.29% -1.37% -1.66%
Income from continuing operations 2.12% 2.97% 3.15% 3.49%
Income from discontinued operations, net of
income taxes – – – 0.06%
Consolidated net income 2.12% 2.97% 3.15% 3.55%
Consolidated net income attributable to
noncontrolling interest -0.13% -0.14% -0.08% -0.15%
Consolidated net income attributable to
Walmart 1.99% 2.83% 3.07% 3.39%
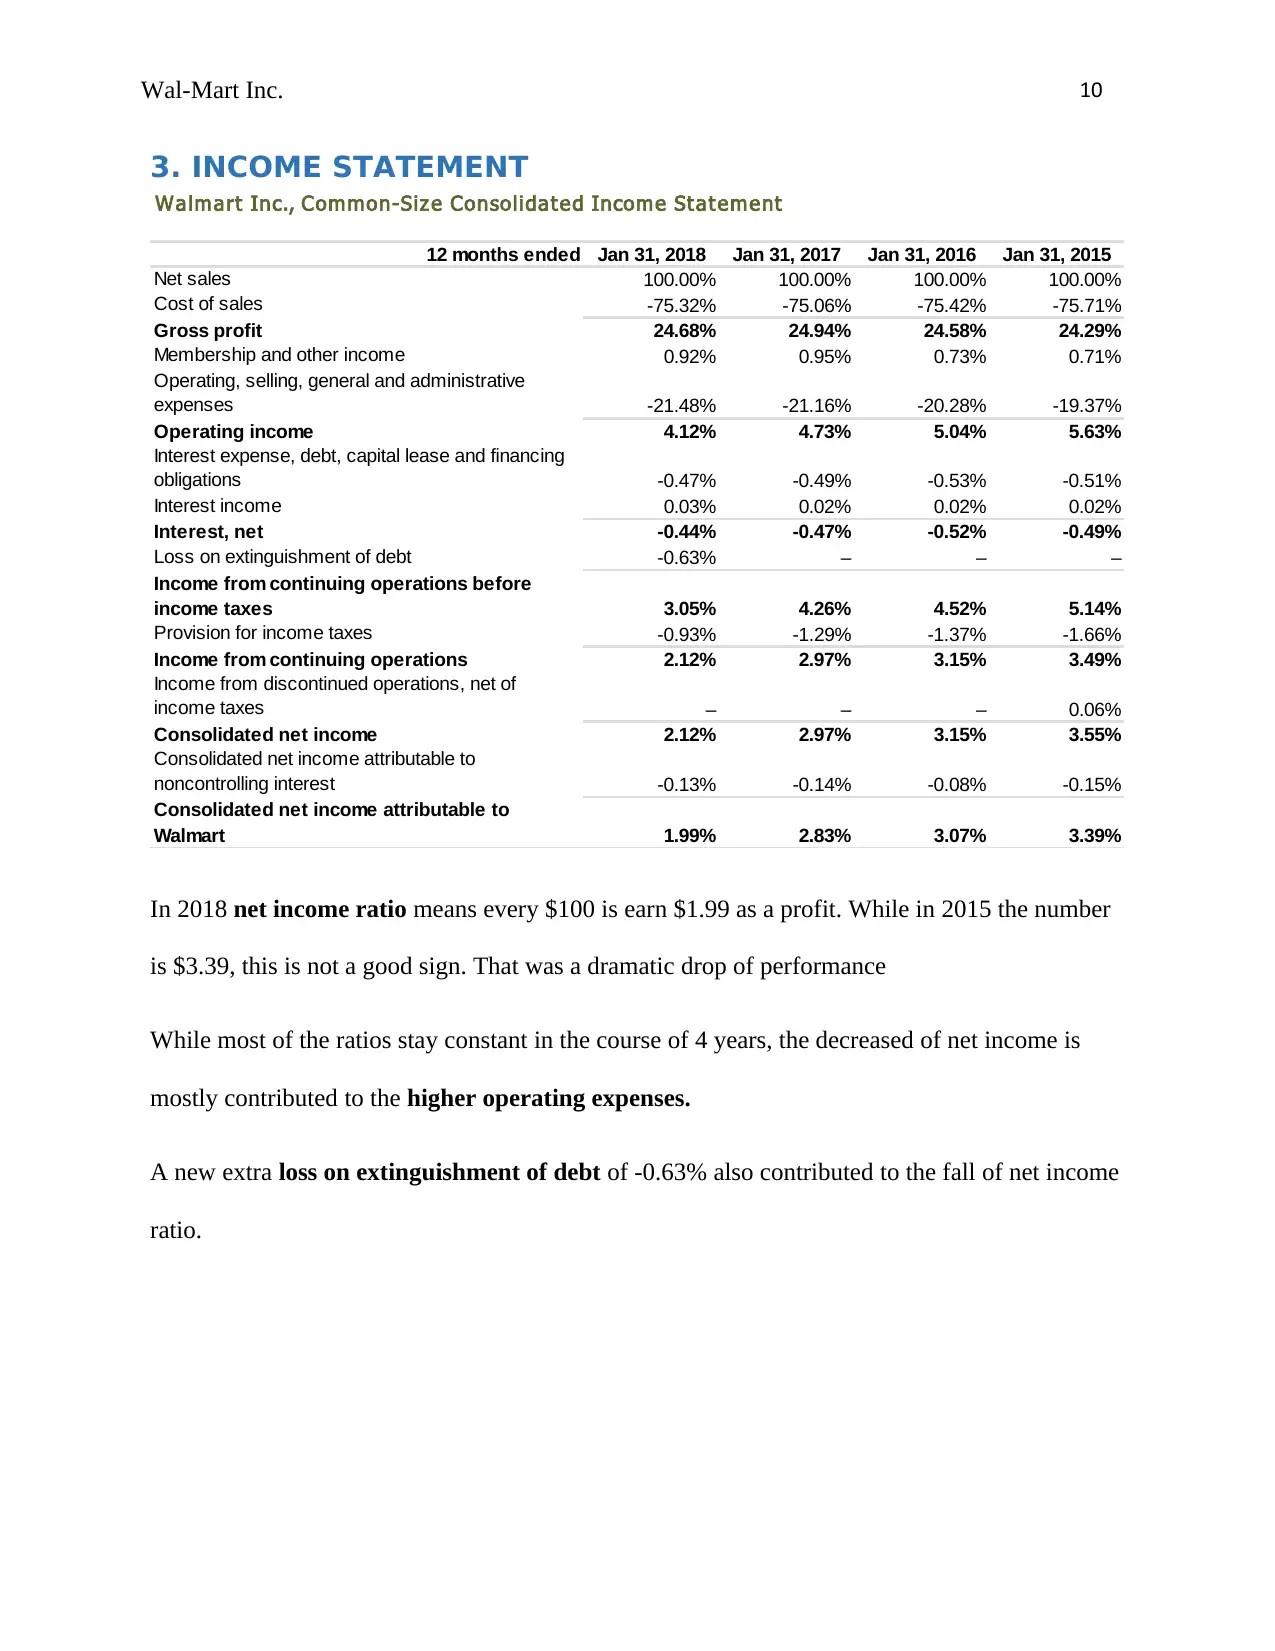
In 2018 net income ratio means every $100 is earn $1.99 as a profit. While in 2015 the number
is $3.39, this is not a good sign. That was a dramatic drop of performance
While most of the ratios stay constant in the course of 4 years, the decreased of net income is
mostly contributed to the higher operating expenses.
A new extra loss on extinguishment of debt of -0.63% also contributed to the fall of net income
ratio.
3. INCOME STATEMENT
Walmart Inc., Common-Siz e Consolidat ed Income St at ement
12 months ended Jan 31, 2018 Jan 31, 2017 Jan 31, 2016 Jan 31, 2015
Net sales 100.00% 100.00% 100.00% 100.00%
Cost of sales -75.32% -75.06% -75.42% -75.71%
Gross profit 24.68% 24.94% 24.58% 24.29%
Membership and other income 0.92% 0.95% 0.73% 0.71%
Operating, selling, general and administrative
expenses -21.48% -21.16% -20.28% -19.37%
Operating income 4.12% 4.73% 5.04% 5.63%
Interest expense, debt, capital lease and financing
obligations -0.47% -0.49% -0.53% -0.51%
Interest income 0.03% 0.02% 0.02% 0.02%
Interest, net -0.44% -0.47% -0.52% -0.49%
Loss on extinguishment of debt -0.63% – – –
Income from continuing operations before
income taxes 3.05% 4.26% 4.52% 5.14%
Provision for income taxes -0.93% -1.29% -1.37% -1.66%
Income from continuing operations 2.12% 2.97% 3.15% 3.49%
Income from discontinued operations, net of
income taxes – – – 0.06%
Consolidated net income 2.12% 2.97% 3.15% 3.55%
Consolidated net income attributable to
noncontrolling interest -0.13% -0.14% -0.08% -0.15%
Consolidated net income attributable to
Walmart 1.99% 2.83% 3.07% 3.39%
In 2018 net income ratio means every $100 is earn $1.99 as a profit. While in 2015 the number
is $3.39, this is not a good sign. That was a dramatic drop of performance
While most of the ratios stay constant in the course of 4 years, the decreased of net income is
mostly contributed to the higher operating expenses.
A new extra loss on extinguishment of debt of -0.63% also contributed to the fall of net income
ratio.
Paraphrase This Document
Need a fresh take? Get an instant paraphrase of this document with our AI Paraphraser
Wal-Mart Inc. 11
III. HORIZONTAL ANALYSIS
1. ASSETS
Walmart Inc., Consolidat ed St atement of Financial P osition, A ssets
USD $ in millions
Jan 31, 2018 Jan 31, 2017 Jan 31, 2016 2018 2017 2016
Cash and cash equivalents 6,756 6,867 8,705 -2% -21% 0%
Receivables, net 5,614 5,835 5,624 -4% 4% 0%
Inventories 43,783 43,046 44,469 2% -3% 0%
Prepaid expenses and other 3,511 1,941 1,441 81% 35% 0%
Current assets of discontinued operations – – –
Current assets 59,664 57,689 60,239 3% -4% 0%
Property and equipment, excluding property under
capital lease and financing obligations, net 107,675 107,710 110,171 0% -2% 0%
Property under capital lease and financing
obligations, net 7,143 6,468 6,345 10% 2% 0%
Property and equipment, net 114,818 114,178 116,516 1% -2% 0%
Goodwill 18,242 17,037 16,695 7% 2% 0%
Other assets and deferred charges 11,798 9,921 6,131 19% 62% 0%
Non-current assets 144,858 141,136 139,342 3% 1% 0%
Total assets 204,522 198,825 199,581 3% 0% 0%
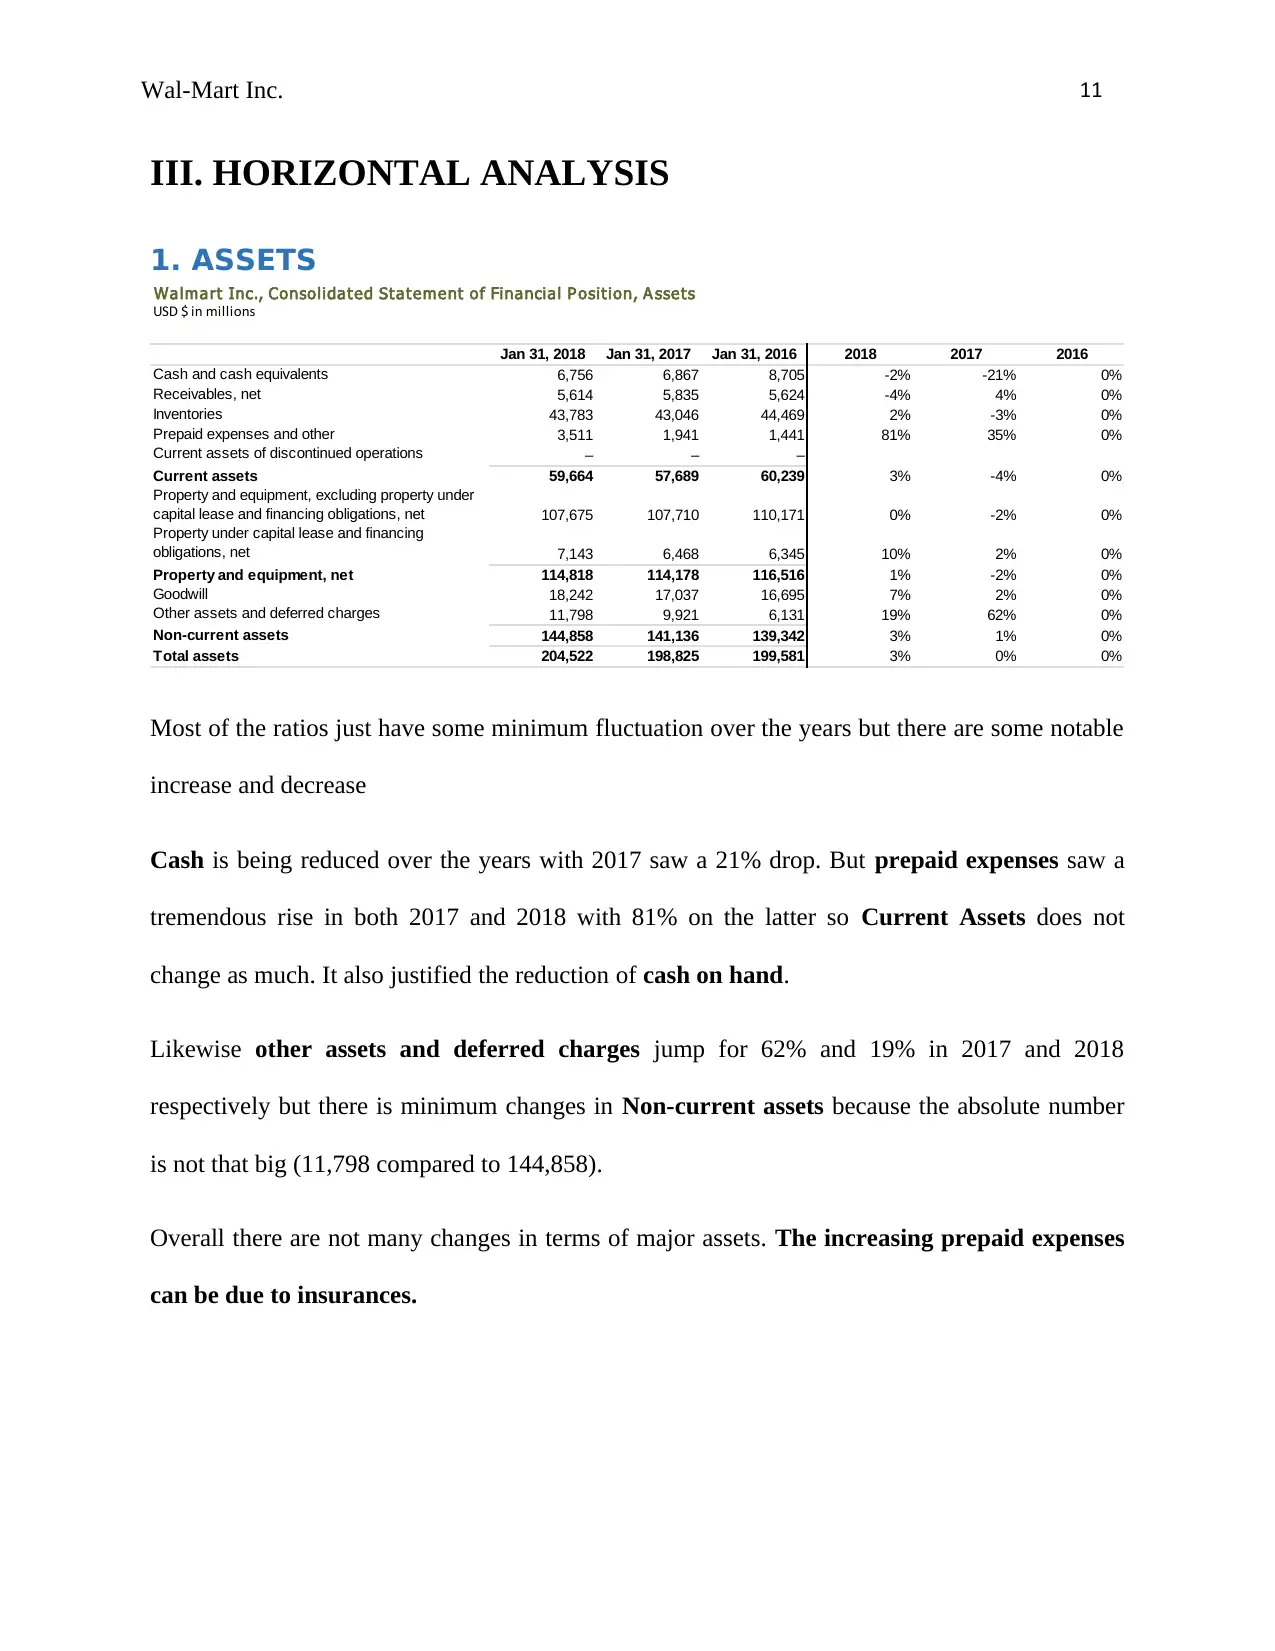
Most of the ratios just have some minimum fluctuation over the years but there are some notable
increase and decrease
Cash is being reduced over the years with 2017 saw a 21% drop. But prepaid expenses saw a
tremendous rise in both 2017 and 2018 with 81% on the latter so Current Assets does not
change as much. It also justified the reduction of cash on hand.
Likewise other assets and deferred charges jump for 62% and 19% in 2017 and 2018
respectively but there is minimum changes in Non-current assets because the absolute number
is not that big (11,798 compared to 144,858).
Overall there are not many changes in terms of major assets. The increasing prepaid expenses
can be due to insurances.
III. HORIZONTAL ANALYSIS
1. ASSETS
Walmart Inc., Consolidat ed St atement of Financial P osition, A ssets
USD $ in millions
Jan 31, 2018 Jan 31, 2017 Jan 31, 2016 2018 2017 2016
Cash and cash equivalents 6,756 6,867 8,705 -2% -21% 0%
Receivables, net 5,614 5,835 5,624 -4% 4% 0%
Inventories 43,783 43,046 44,469 2% -3% 0%
Prepaid expenses and other 3,511 1,941 1,441 81% 35% 0%
Current assets of discontinued operations – – –
Current assets 59,664 57,689 60,239 3% -4% 0%
Property and equipment, excluding property under
capital lease and financing obligations, net 107,675 107,710 110,171 0% -2% 0%
Property under capital lease and financing
obligations, net 7,143 6,468 6,345 10% 2% 0%
Property and equipment, net 114,818 114,178 116,516 1% -2% 0%
Goodwill 18,242 17,037 16,695 7% 2% 0%
Other assets and deferred charges 11,798 9,921 6,131 19% 62% 0%
Non-current assets 144,858 141,136 139,342 3% 1% 0%
Total assets 204,522 198,825 199,581 3% 0% 0%
Most of the ratios just have some minimum fluctuation over the years but there are some notable
increase and decrease
Cash is being reduced over the years with 2017 saw a 21% drop. But prepaid expenses saw a
tremendous rise in both 2017 and 2018 with 81% on the latter so Current Assets does not
change as much. It also justified the reduction of cash on hand.
Likewise other assets and deferred charges jump for 62% and 19% in 2017 and 2018
respectively but there is minimum changes in Non-current assets because the absolute number
is not that big (11,798 compared to 144,858).
Overall there are not many changes in terms of major assets. The increasing prepaid expenses
can be due to insurances.
Wal-Mart Inc. 12
2. LIABILITES AND STOCKHOLDERS’ EQUITY
Walmart Inc., Consolidat ed St atement of Financial P osition, Liabilit ies and Stock holders' Equity
USD $ in millions
Jan 31, 2018 Jan 31, 2017 Jan 31, 2016 2018 2017 2016
Short-term borrowings 5,257 1,099 2,708 378% -59% 0%
Accounts payable 46,092 41,433 38,487 11% 8% 0%
Accrued wages and benefits 6,998 6,105 5,814 15% 5% 0%
Self-insurance 3,737 3,922 3,414 -5% 15% 0%
Accrued non-income taxes 3,073 2,816 2,544 9% 11% 0%
Deferred gift card revenue 2,017 1,856 – 9%
Other 6,297 5,955 7,835 6% -24% 0%
Accrued liabilities 22,122 20,654 19,607 7% 5% 0%
Accrued income taxes 645 921 521 -30% 77% 0%
Long-term debt due within one year 3,738 2,256 2,745 66% -18% 0%
Capital lease and financing obligations due within
one year 667 565 551 18% 3% 0%
Current liabilities of discontinued operations – – –
Current liabilities 78,521 66,928 64,619 17% 4% 0%
Long-term debt, excluding due within one year 30,045 36,015 38,214 -17% -6% 0%
Long-term capital lease and financing obligations,
excluding due within one year 6,780 6,003 5,816 13% 3% 0%
Deferred income taxes and other 8,354 9,344 7,321 -11% 28% 0%
Non-current liabilities 45,179 51,362 51,351 -12% 0% 0%
Total liabilities 123,700 118,290 115,970 5% 2% 0%
Redeemable noncontrolling interest – – –
Common stock 295 305 317 -3% -4% 0%
Capital in excess of par value 2,648 2,371 1,805 12% 31% 0%
Retained earnings 85,107 89,354 90,021 -5% -1% 0%
Accumulated other comprehensive loss -10,181 -14,232 -11,597 -28% 23% 0%
Total Walmart shareholders' equity 77,869 77,798 80,546 0% -3% 0%
Nonredeemable noncontrolling interest 2,953 2,737 3,065 8% -11% 0%
Total equity 80,822 80,535 83,611 0% -4% 0%
Total liabilities, redeemable noncontrolling
interest, and equity 204,522 198,825 199,581 3% 0% 0%
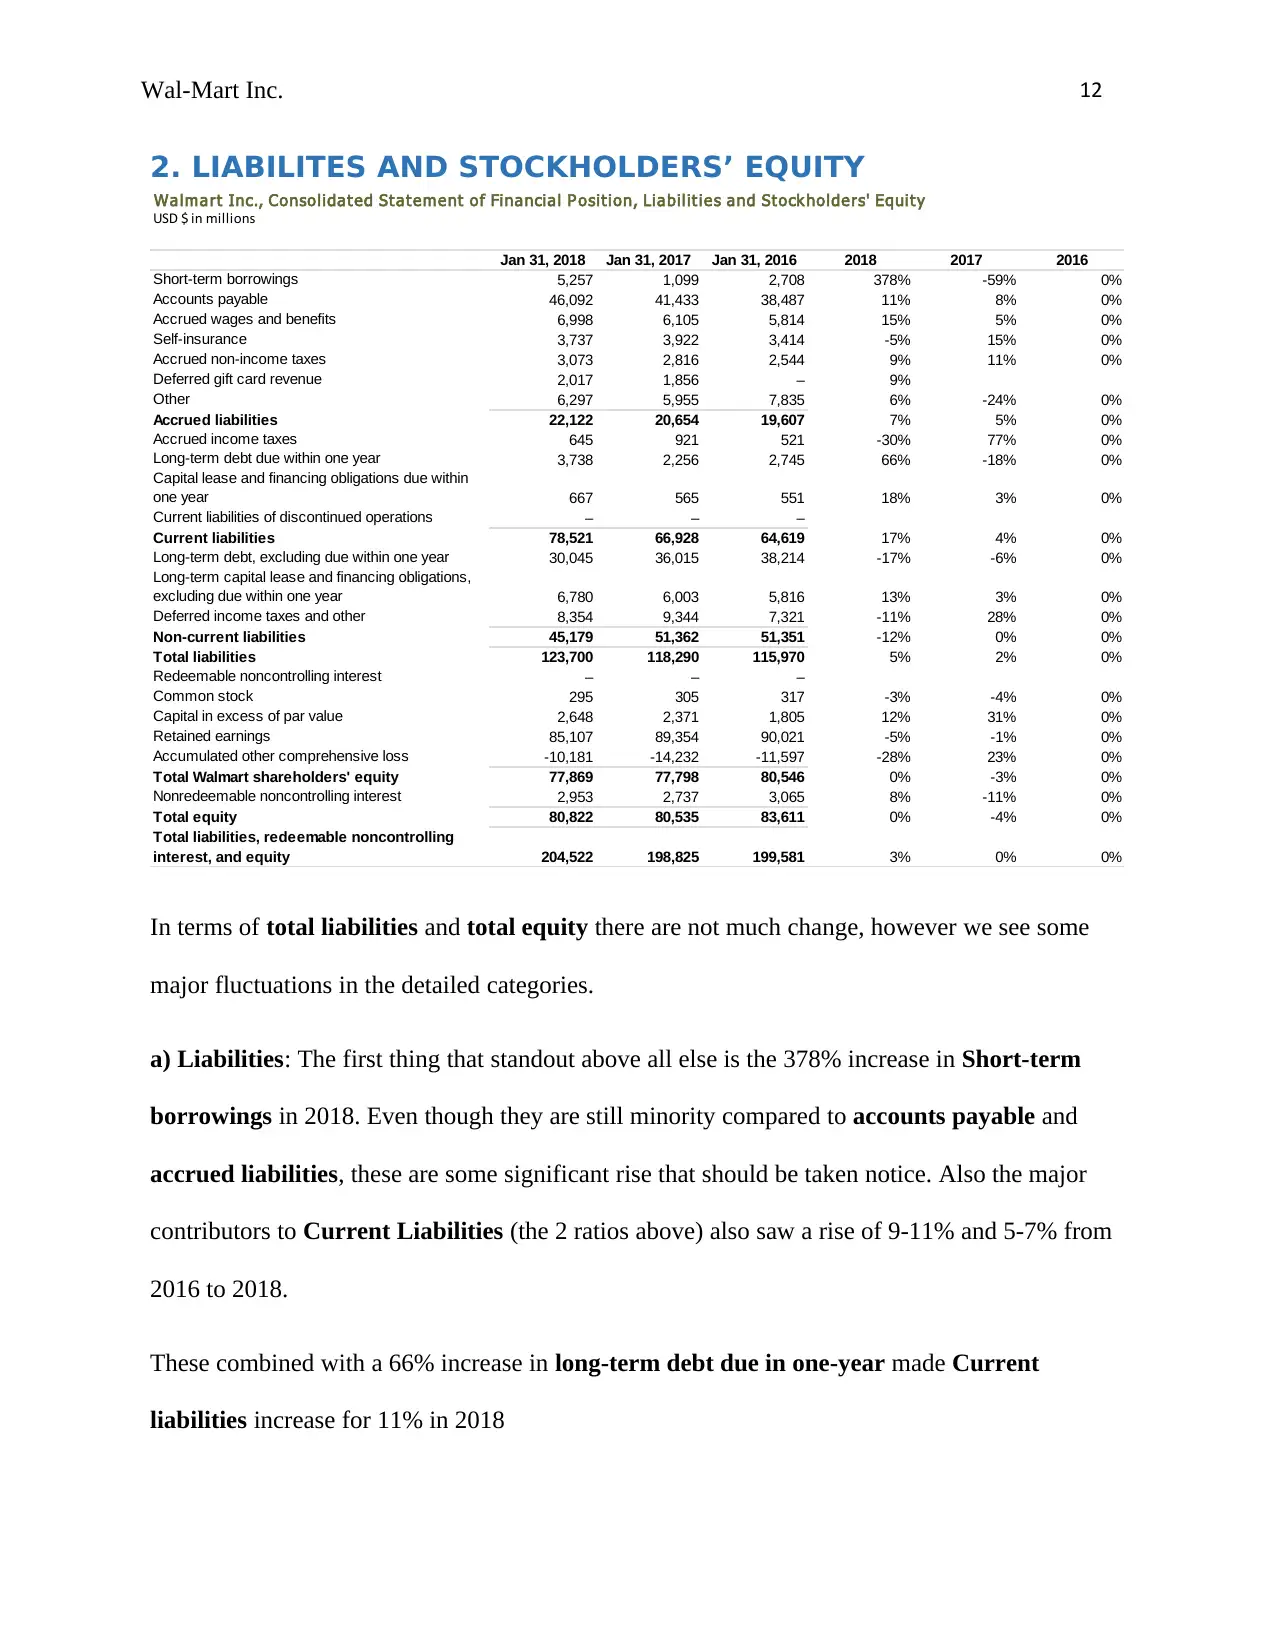
In terms of total liabilities and total equity there are not much change, however we see some
major fluctuations in the detailed categories.
a) Liabilities: The first thing that standout above all else is the 378% increase in Short-term
borrowings in 2018. Even though they are still minority compared to accounts payable and
accrued liabilities, these are some significant rise that should be taken notice. Also the major
contributors to Current Liabilities (the 2 ratios above) also saw a rise of 9-11% and 5-7% from
2016 to 2018.
These combined with a 66% increase in long-term debt due in one-year made Current
liabilities increase for 11% in 2018
2. LIABILITES AND STOCKHOLDERS’ EQUITY
Walmart Inc., Consolidat ed St atement of Financial P osition, Liabilit ies and Stock holders' Equity
USD $ in millions
Jan 31, 2018 Jan 31, 2017 Jan 31, 2016 2018 2017 2016
Short-term borrowings 5,257 1,099 2,708 378% -59% 0%
Accounts payable 46,092 41,433 38,487 11% 8% 0%
Accrued wages and benefits 6,998 6,105 5,814 15% 5% 0%
Self-insurance 3,737 3,922 3,414 -5% 15% 0%
Accrued non-income taxes 3,073 2,816 2,544 9% 11% 0%
Deferred gift card revenue 2,017 1,856 – 9%
Other 6,297 5,955 7,835 6% -24% 0%
Accrued liabilities 22,122 20,654 19,607 7% 5% 0%
Accrued income taxes 645 921 521 -30% 77% 0%
Long-term debt due within one year 3,738 2,256 2,745 66% -18% 0%
Capital lease and financing obligations due within
one year 667 565 551 18% 3% 0%
Current liabilities of discontinued operations – – –
Current liabilities 78,521 66,928 64,619 17% 4% 0%
Long-term debt, excluding due within one year 30,045 36,015 38,214 -17% -6% 0%
Long-term capital lease and financing obligations,
excluding due within one year 6,780 6,003 5,816 13% 3% 0%
Deferred income taxes and other 8,354 9,344 7,321 -11% 28% 0%
Non-current liabilities 45,179 51,362 51,351 -12% 0% 0%
Total liabilities 123,700 118,290 115,970 5% 2% 0%
Redeemable noncontrolling interest – – –
Common stock 295 305 317 -3% -4% 0%
Capital in excess of par value 2,648 2,371 1,805 12% 31% 0%
Retained earnings 85,107 89,354 90,021 -5% -1% 0%
Accumulated other comprehensive loss -10,181 -14,232 -11,597 -28% 23% 0%
Total Walmart shareholders' equity 77,869 77,798 80,546 0% -3% 0%
Nonredeemable noncontrolling interest 2,953 2,737 3,065 8% -11% 0%
Total equity 80,822 80,535 83,611 0% -4% 0%
Total liabilities, redeemable noncontrolling
interest, and equity 204,522 198,825 199,581 3% 0% 0%
In terms of total liabilities and total equity there are not much change, however we see some
major fluctuations in the detailed categories.
a) Liabilities: The first thing that standout above all else is the 378% increase in Short-term
borrowings in 2018. Even though they are still minority compared to accounts payable and
accrued liabilities, these are some significant rise that should be taken notice. Also the major
contributors to Current Liabilities (the 2 ratios above) also saw a rise of 9-11% and 5-7% from
2016 to 2018.
These combined with a 66% increase in long-term debt due in one-year made Current
liabilities increase for 11% in 2018
⊘ This is a preview!⊘
Do you want full access?
Subscribe today to unlock all pages.
Trusted by 1+ million students worldwide
1 out of 20
Related Documents


Your All-in-One AI-Powered Toolkit for Academic Success.
+13062052269
info@desklib.com
Available 24*7 on WhatsApp / Email
![[object Object]](/_next/static/media/star-bottom.7253800d.svg)
Unlock your academic potential
Copyright © 2020–2026 A2Z Services. All Rights Reserved. Developed and managed by ZUCOL.