Business Decision Making: Walmart's Online Shopping Impact Analysis
VerifiedAdded on 2020/12/10
|23
|4616
|274
Report
AI Summary
This report examines the impact of Walmart's multi-channel shopping on high street shops and malls. The research employs a data collection plan involving questionnaires administered to students across various campuses. The methodology includes primary and secondary data sources, with a focus on qualitative research and sampling techniques like random and cluster sampling. The report details the design of the questionnaire, covering questions about online shopping preferences, risk perceptions, and buying decisions. Data interpretation utilizes measures of central tendency, and the findings are presented through various charts and graphs, including trend lines, with a formal report summarizing the key insights. The report also discusses the importance of information systems, critical paths, Gantt charts, and financial tools in the decision-making process, ultimately aiming to provide valuable insights for Walmart's business strategies.
Business Decision making
Paraphrase This Document
Need a fresh take? Get an instant paraphrase of this document with our AI Paraphraser
Table of Contents
INTRODUCTION...........................................................................................................................1
TASK 1............................................................................................................................................1
1.1: Data collection plan from students across all campuses......................................................1
1.2: Research methodology and sampling framework................................................................2
1.3: Designing a set of questionnaire..........................................................................................3
TASK 2............................................................................................................................................5
2.1: Interpretation data collected from the research by using representative value....................5
2.2: Analysing of results of the research and draw proper conclusion .....................................8
2.3: Analysing the data as measure of dispersion.......................................................................8
2.4 Role of quartiles, percentiles and the correlation coefficient to draw useful conclusion......9
TASK 3............................................................................................................................................9
3.1: Analysing through using various charts and graphs...........................................................9
3.2: Trend line...........................................................................................................................14
3.3: Covered in poster...............................................................................................................15
3.4: Formal report......................................................................................................................15
TASK 4..........................................................................................................................................15
4.1 Importance of type of various information system.............................................................15
4.2 Critical path and Gantt chart subject to attain estimated things..........................................17
4.3 Implication of financial tools for better understanding decision making process..............19
CONCLUSION..............................................................................................................................20
REFERENCES..............................................................................................................................21
INTRODUCTION
Nowadays, it has been seen that technological innovation has made people think to
change their perception to becomes more concern about increasing the standard of living. With
the help of multi-channel shopping social cites are playing one of the major role in attracting
more toward online shopping. The “Walmart” is one of the major shopping market where all
essential products as per the requirements of customer are already available. This will assist them
to not move from anywhere to buy products. This project research aims to collected necessary
information about impacts on high street shops and mall with the opening of multi-channel
shops. For this purpose, an effective data collection plan with appropriate methodology is being
made to get more valuable outcome for the company. Analysis of data is done through using
measure of dispersion and measure of central tendency. Reporting of all effective findings that
are collected from the research work are summaries through using charts that are helpful at the
time of preparing report of the company. With appropriate collection of data to make valuable
decision making are done in effective manner (Barlett, 2016).
TASK 1
1.1: Data collection plan from students across all campuses
A research is a said to be effective system of investigation into the study material and
sources in respect to determine facts to reach at new outcomes. It is methodical examine in
respect to show a hypothesis or reach certain conclusion. As per the mentioned case of
technological innovations that is being seen in plenty of students that are using apps and
interested in shopping in any free period of time. They used to buy online as well as offline mode
to shop various products as per there requirements. To known about their perception every day
experiences about using technological changes a well organise research is being conducted. This
major sources of data collection is being taken from young students from various campuses and
from those that are visiting regularly into shopping malls. In this process researchers would be
liable to use two important data collection methods (Beach and Lipshitz, 2017). Such as:
Primary sources: It is known as utmost important source because the data gathered from
this particular sources in more real and accurate. The chances of bias is not there so that better
outcomes can be attain more likely. Some of vital categories of this sources is discussed
underneath:
1
⊘ This is a preview!⊘
Do you want full access?
Subscribe today to unlock all pages.
Trusted by 1+ million students worldwide
Interviews: It is one to one interaction among student to determine, whether perception
of students those are using of digital facilities are satisfied from there services.
Questionnaire: It happens to be the set of printed or written questions with having
multiple answers for the purpose of research or any statistical study. This sources can
easily be helpful to get more reliable outcomes without making any direct link.
Secondary sources: It is known as appropriate data that are collected through someone
other than the users. These are basically used data that are already been published or uses by
someone else. The major sources of data collection is taken from journals, statements and past
records (Blondel and Müller-Rommel, 2016).
1.2: Research methodology and sampling framework
In respect to conduct a well organise research work, it is essential to make use of
appropriate methods that are reliable in making business decisions more effective. The methods
can consists of publication research, interviews and other researchers tools that could consists of
both present and historical data gather from this particular research. Method will be used to
conduct research in more consider manner as a good practices that is helpful in respect to get
more perfect sampling of students groups. There are various research method that get use to
determine for a project which is required by managers of a company while making proper
consultants with experts parties. Walmart need to come into online shopping aspects in well
organise manner that is being used to determine things in more better manner. Henceforth, they
want to analyse appropriate consideration of various aspects for which effective questionnaire
research will be going to be taken places. In this respect, different research methodologies get
take place that are discussed underneath:
Qualitative research: This particular research is based on numerical aspects of number
that are collected during research work. It aims to measure the quantity or amount and compare it
with past record as well as tried to estimate for future outcomes. It facilitate and enable in
designing and evaluating the better results of an organisation (Drucker, 2017). Thus,
management used to organise a research by using data that are gather for the motive of increase
value to stakeholders so that better outcomes can be attain in more effective manner. This will
results in defining advantages attributes so that important results which would be helpful in near
future time. The research tools enable in Walmart things properly so that effective aims can be
gain in future period.
2
Paraphrase This Document
Need a fresh take? Get an instant paraphrase of this document with our AI Paraphraser
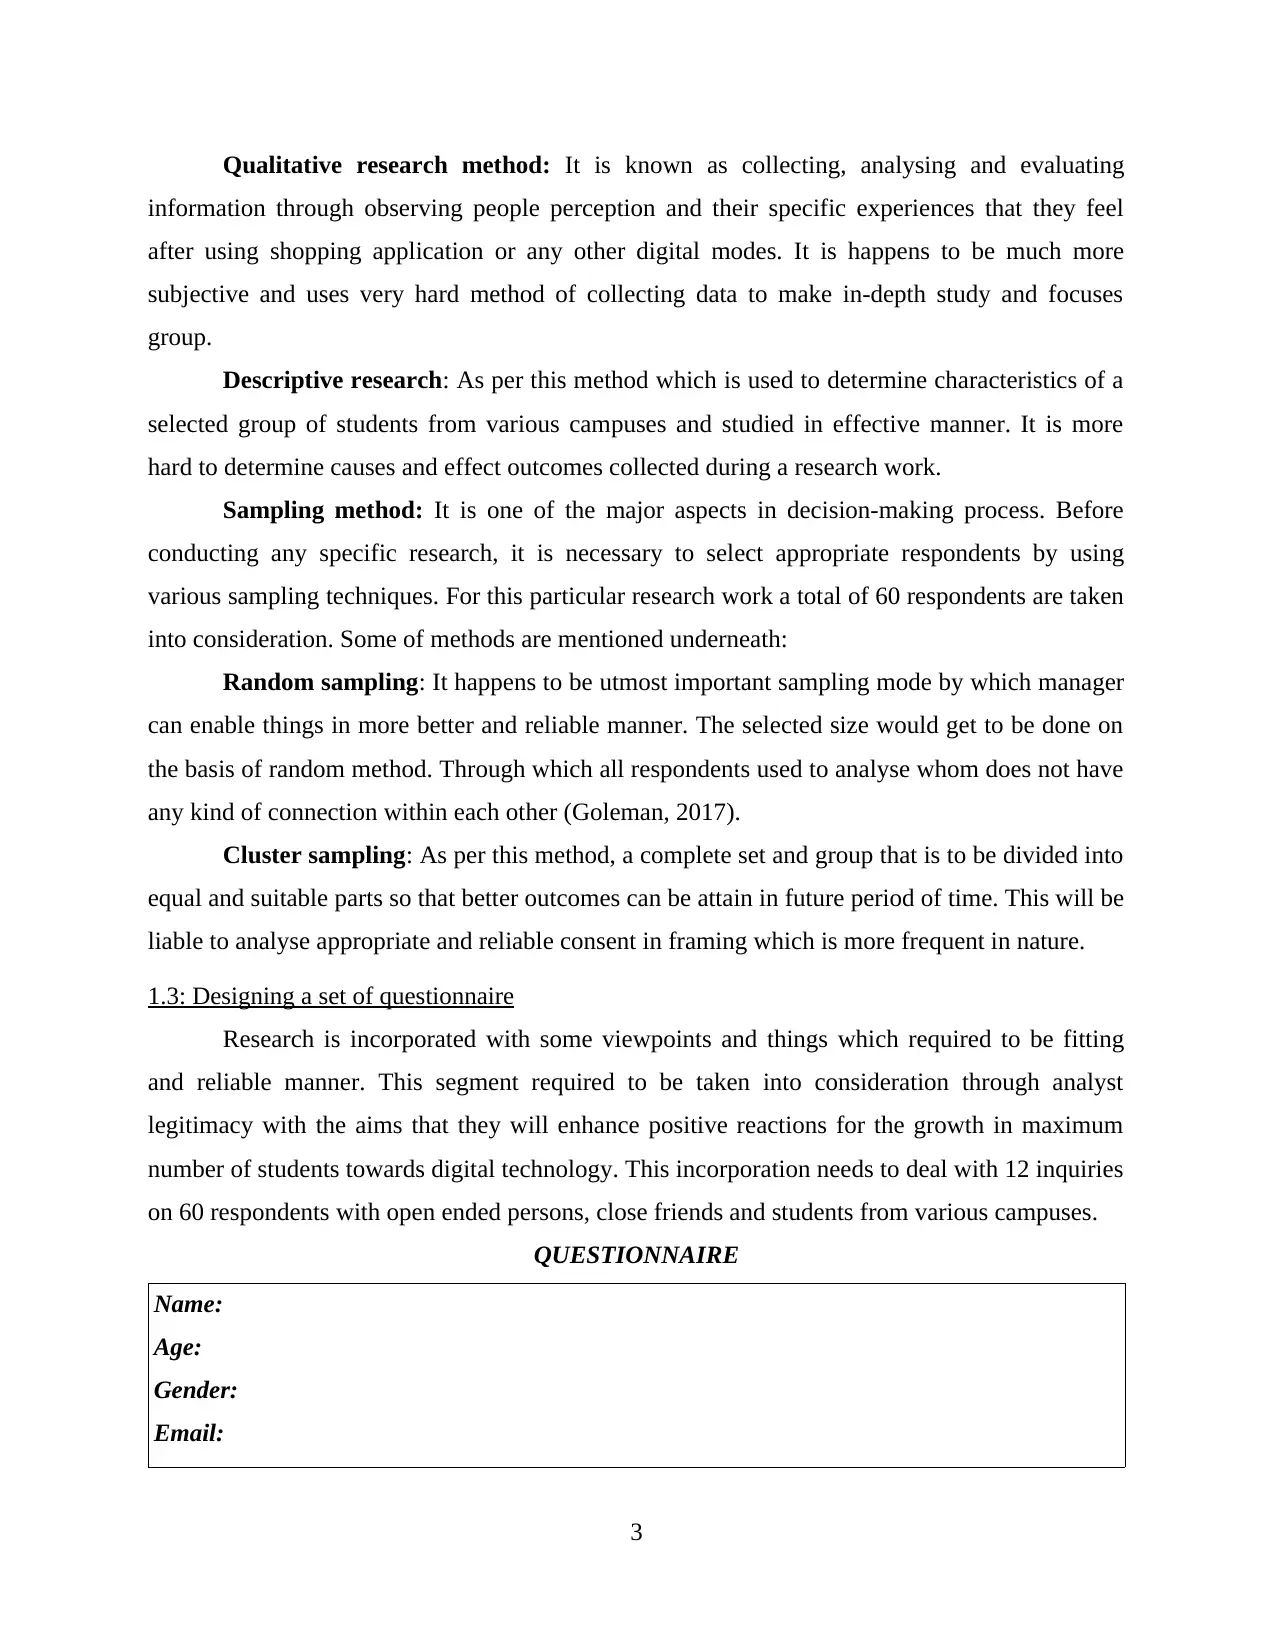
Qualitative research method: It is known as collecting, analysing and evaluating
information through observing people perception and their specific experiences that they feel
after using shopping application or any other digital modes. It is happens to be much more
subjective and uses very hard method of collecting data to make in-depth study and focuses
group.
Descriptive research: As per this method which is used to determine characteristics of a
selected group of students from various campuses and studied in effective manner. It is more
hard to determine causes and effect outcomes collected during a research work.
Sampling method: It is one of the major aspects in decision-making process. Before
conducting any specific research, it is necessary to select appropriate respondents by using
various sampling techniques. For this particular research work a total of 60 respondents are taken
into consideration. Some of methods are mentioned underneath:
Random sampling: It happens to be utmost important sampling mode by which manager
can enable things in more better and reliable manner. The selected size would get to be done on
the basis of random method. Through which all respondents used to analyse whom does not have
any kind of connection within each other (Goleman, 2017).
Cluster sampling: As per this method, a complete set and group that is to be divided into
equal and suitable parts so that better outcomes can be attain in future period of time. This will be
liable to analyse appropriate and reliable consent in framing which is more frequent in nature.
1.3: Designing a set of questionnaire
Research is incorporated with some viewpoints and things which required to be fitting
and reliable manner. This segment required to be taken into consideration through analyst
legitimacy with the aims that they will enhance positive reactions for the growth in maximum
number of students towards digital technology. This incorporation needs to deal with 12 inquiries
on 60 respondents with open ended persons, close friends and students from various campuses.
QUESTIONNAIRE
Name:
Age:
Gender:
Email:
3
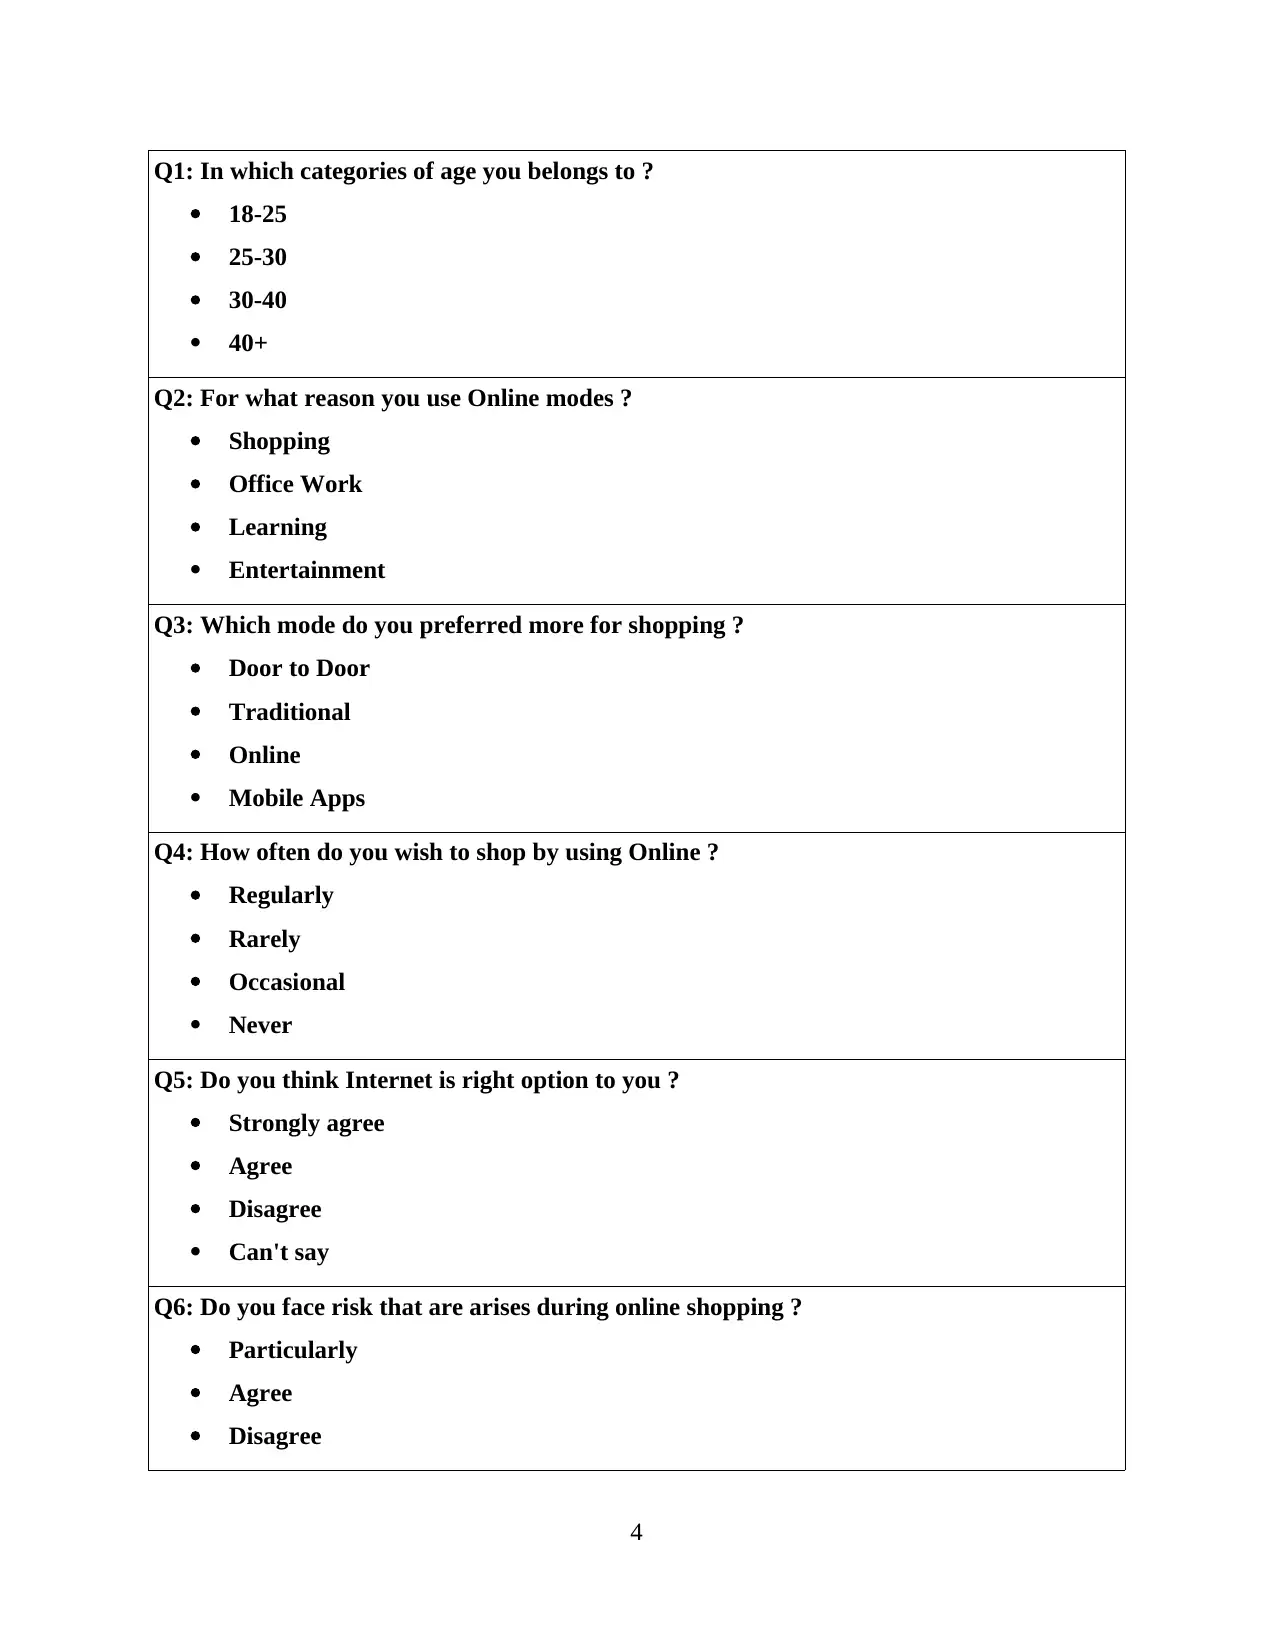
Q1: In which categories of age you belongs to ?
18-25
25-30
30-40
40+
Q2: For what reason you use Online modes ?
Shopping
Office Work
Learning
Entertainment
Q3: Which mode do you preferred more for shopping ?
Door to Door
Traditional
Online
Mobile Apps
Q4: How often do you wish to shop by using Online ?
Regularly
Rarely
Occasional
Never
Q5: Do you think Internet is right option to you ?
Strongly agree
Agree
Disagree
Can't say
Q6: Do you face risk that are arises during online shopping ?
Particularly
Agree
Disagree
4
⊘ This is a preview!⊘
Do you want full access?
Subscribe today to unlock all pages.
Trusted by 1+ million students worldwide
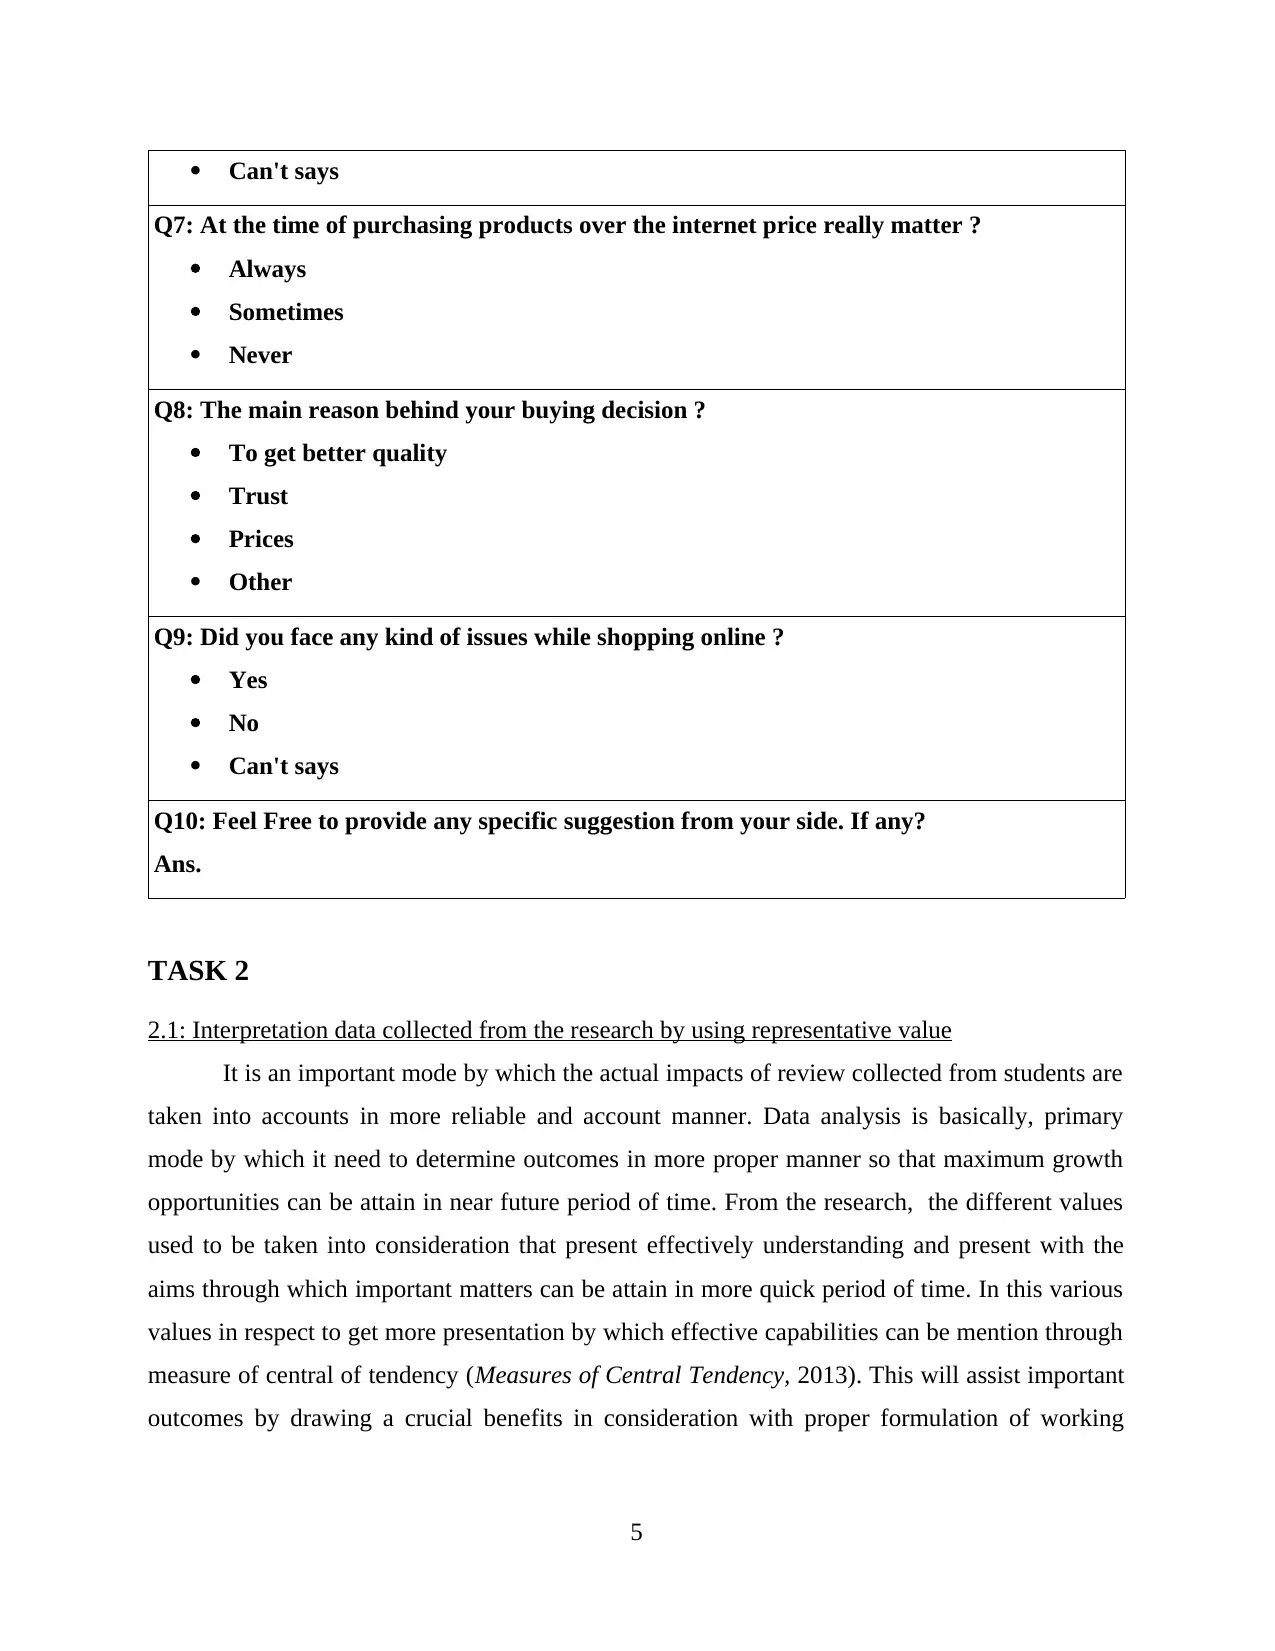
Can't says
Q7: At the time of purchasing products over the internet price really matter ?
Always
Sometimes
Never
Q8: The main reason behind your buying decision ?
To get better quality
Trust
Prices
Other
Q9: Did you face any kind of issues while shopping online ?
Yes
No
Can't says
Q10: Feel Free to provide any specific suggestion from your side. If any?
Ans.
TASK 2
2.1: Interpretation data collected from the research by using representative value
It is an important mode by which the actual impacts of review collected from students are
taken into accounts in more reliable and account manner. Data analysis is basically, primary
mode by which it need to determine outcomes in more proper manner so that maximum growth
opportunities can be attain in near future period of time. From the research, the different values
used to be taken into consideration that present effectively understanding and present with the
aims through which important matters can be attain in more quick period of time. In this various
values in respect to get more presentation by which effective capabilities can be mention through
measure of central of tendency (Measures of Central Tendency, 2013). This will assist important
outcomes by drawing a crucial benefits in consideration with proper formulation of working
5
Paraphrase This Document
Need a fresh take? Get an instant paraphrase of this document with our AI Paraphraser
management tools and techniques. This would represent proper analysis in order to get proper
results in order to suitable align information into considerations.
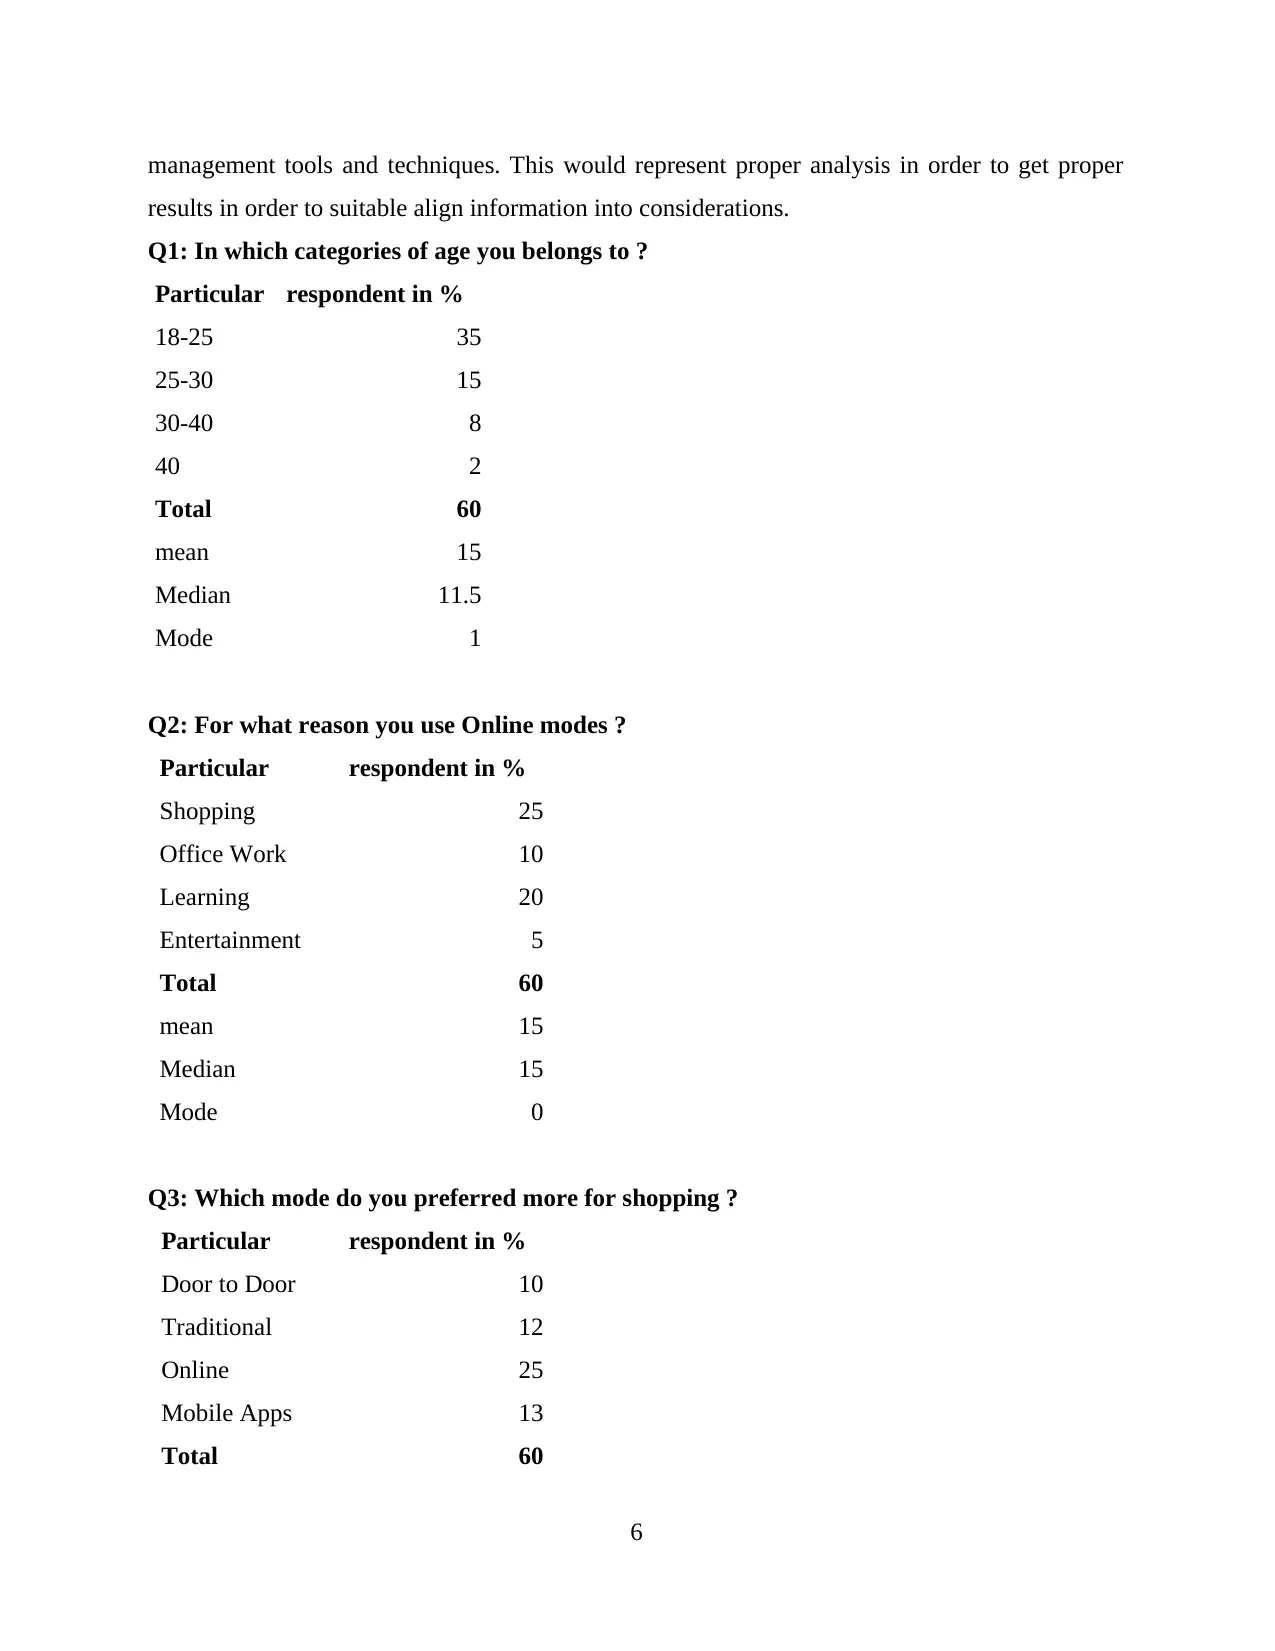
Q1: In which categories of age you belongs to ?
Particular respondent in %
18-25 35
25-30 15
30-40 8
40 2
Total 60
mean 15
Median 11.5
Mode 1
Q2: For what reason you use Online modes ?
Particular respondent in %
Shopping 25
Office Work 10
Learning 20
Entertainment 5
Total 60
mean 15
Median 15
Mode 0
Q3: Which mode do you preferred more for shopping ?
Particular respondent in %
Door to Door 10
Traditional 12
Online 25
Mobile Apps 13
Total 60
6
results in order to suitable align information into considerations.
Q1: In which categories of age you belongs to ?
Particular respondent in %
18-25 35
25-30 15
30-40 8
40 2
Total 60
mean 15
Median 11.5
Mode 1
Q2: For what reason you use Online modes ?
Particular respondent in %
Shopping 25
Office Work 10
Learning 20
Entertainment 5
Total 60
mean 15
Median 15
Mode 0
Q3: Which mode do you preferred more for shopping ?
Particular respondent in %
Door to Door 10
Traditional 12
Online 25
Mobile Apps 13
Total 60
6
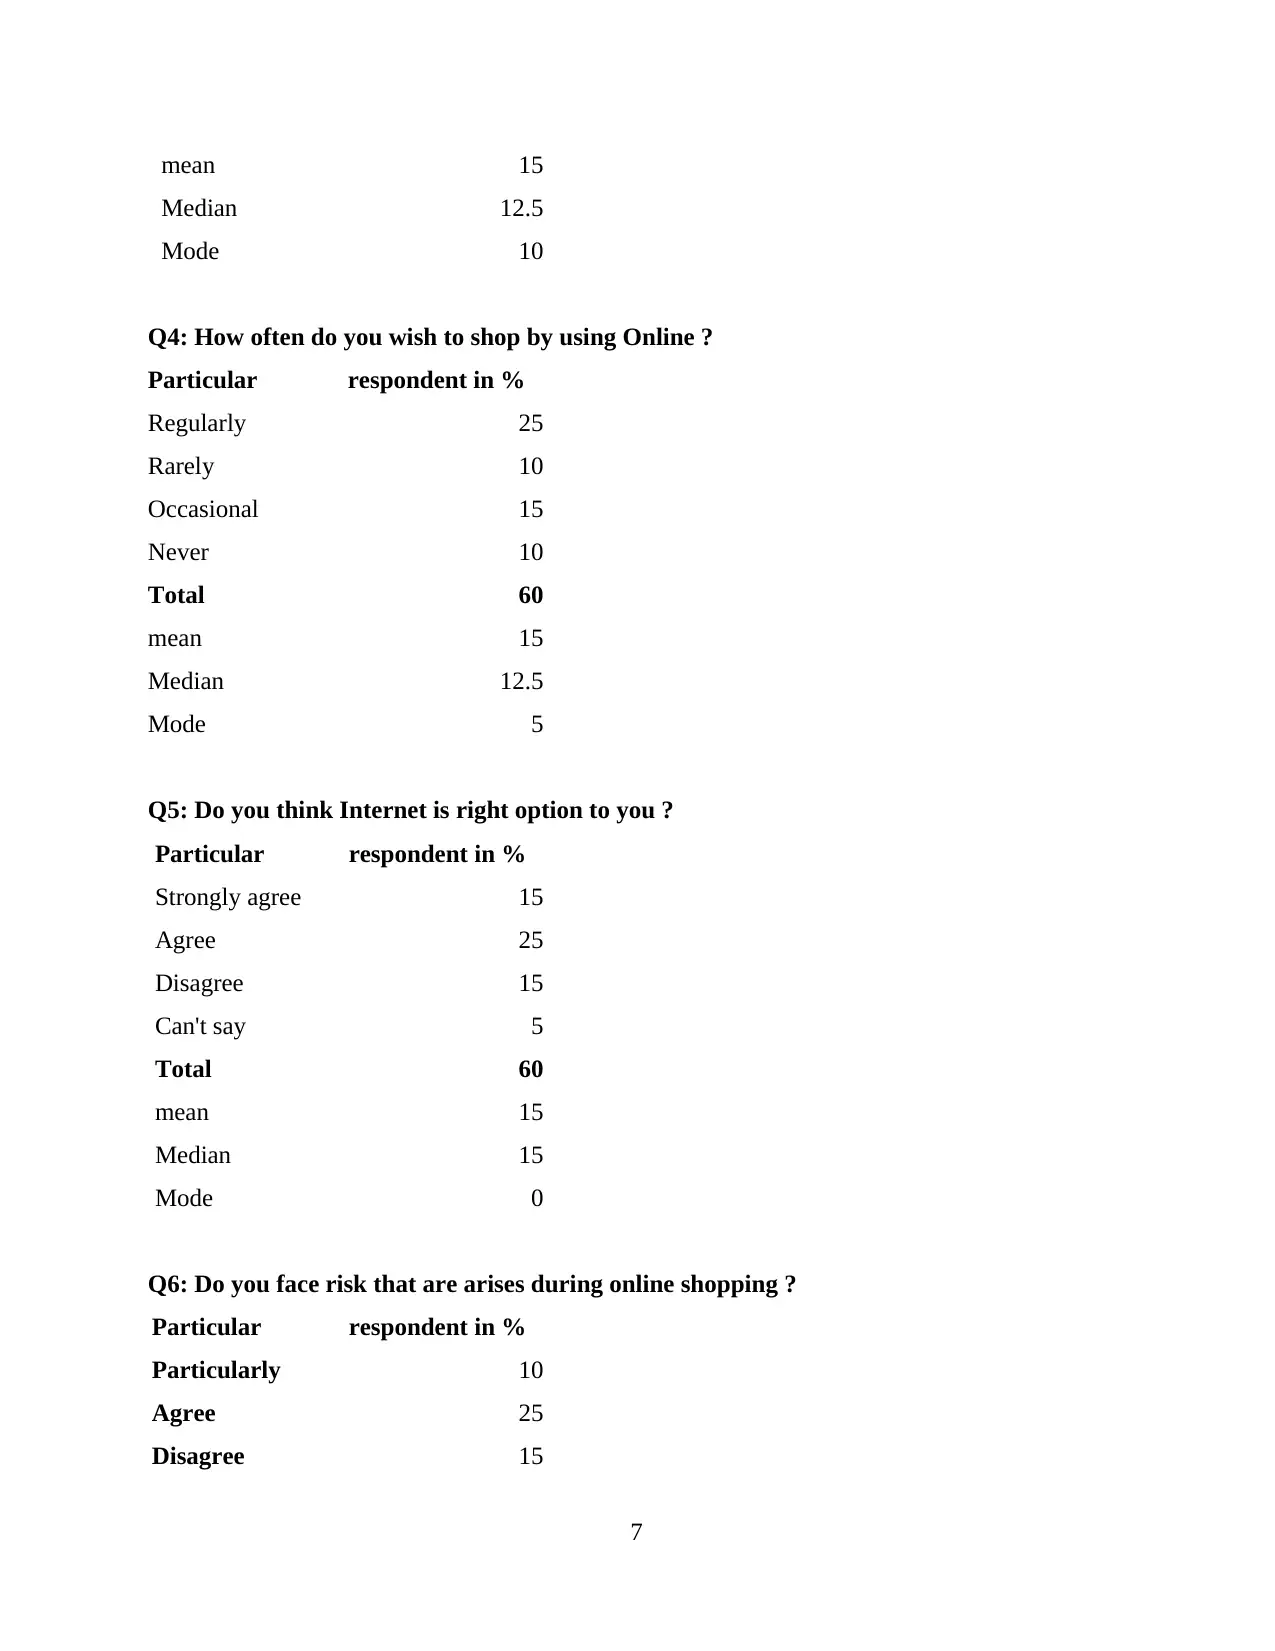
mean 15
Median 12.5
Mode 10
Q4: How often do you wish to shop by using Online ?
Particular respondent in %
Regularly 25
Rarely 10
Occasional 15
Never 10
Total 60
mean 15
Median 12.5
Mode 5
Q5: Do you think Internet is right option to you ?
Particular respondent in %
Strongly agree 15
Agree 25
Disagree 15
Can't say 5
Total 60
mean 15
Median 15
Mode 0
Q6: Do you face risk that are arises during online shopping ?
Particular respondent in %
Particularly 10
Agree 25
Disagree 15
7
Median 12.5
Mode 10
Q4: How often do you wish to shop by using Online ?
Particular respondent in %
Regularly 25
Rarely 10
Occasional 15
Never 10
Total 60
mean 15
Median 12.5
Mode 5
Q5: Do you think Internet is right option to you ?
Particular respondent in %
Strongly agree 15
Agree 25
Disagree 15
Can't say 5
Total 60
mean 15
Median 15
Mode 0
Q6: Do you face risk that are arises during online shopping ?
Particular respondent in %
Particularly 10
Agree 25
Disagree 15
7
⊘ This is a preview!⊘
Do you want full access?
Subscribe today to unlock all pages.
Trusted by 1+ million students worldwide
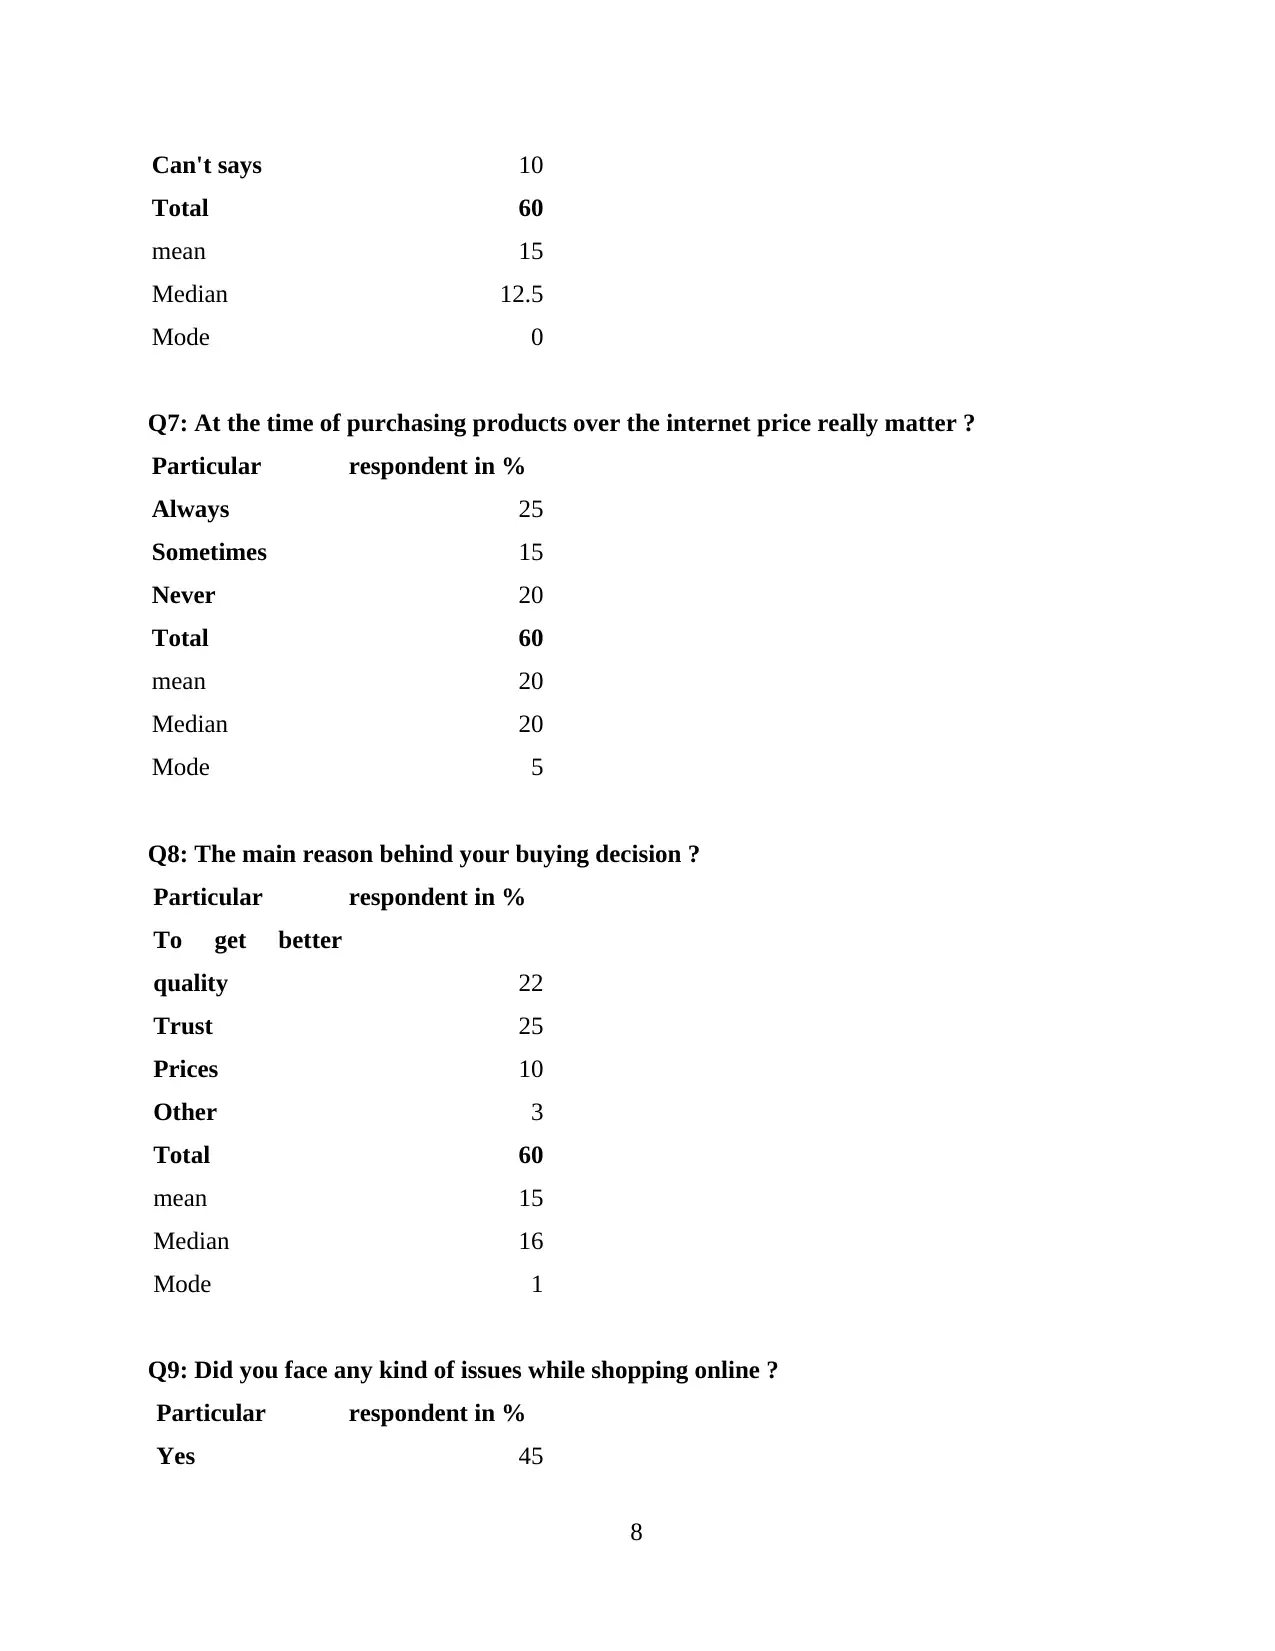
Can't says 10
Total 60
mean 15
Median 12.5
Mode 0
Q7: At the time of purchasing products over the internet price really matter ?
Particular respondent in %
Always 25
Sometimes 15
Never 20
Total 60
mean 20
Median 20
Mode 5
Q8: The main reason behind your buying decision ?
Particular respondent in %
To get better
quality 22
Trust 25
Prices 10
Other 3
Total 60
mean 15
Median 16
Mode 1
Q9: Did you face any kind of issues while shopping online ?
Particular respondent in %
Yes 45
8
Total 60
mean 15
Median 12.5
Mode 0
Q7: At the time of purchasing products over the internet price really matter ?
Particular respondent in %
Always 25
Sometimes 15
Never 20
Total 60
mean 20
Median 20
Mode 5
Q8: The main reason behind your buying decision ?
Particular respondent in %
To get better
quality 22
Trust 25
Prices 10
Other 3
Total 60
mean 15
Median 16
Mode 1
Q9: Did you face any kind of issues while shopping online ?
Particular respondent in %
Yes 45
8
Paraphrase This Document
Need a fresh take? Get an instant paraphrase of this document with our AI Paraphraser
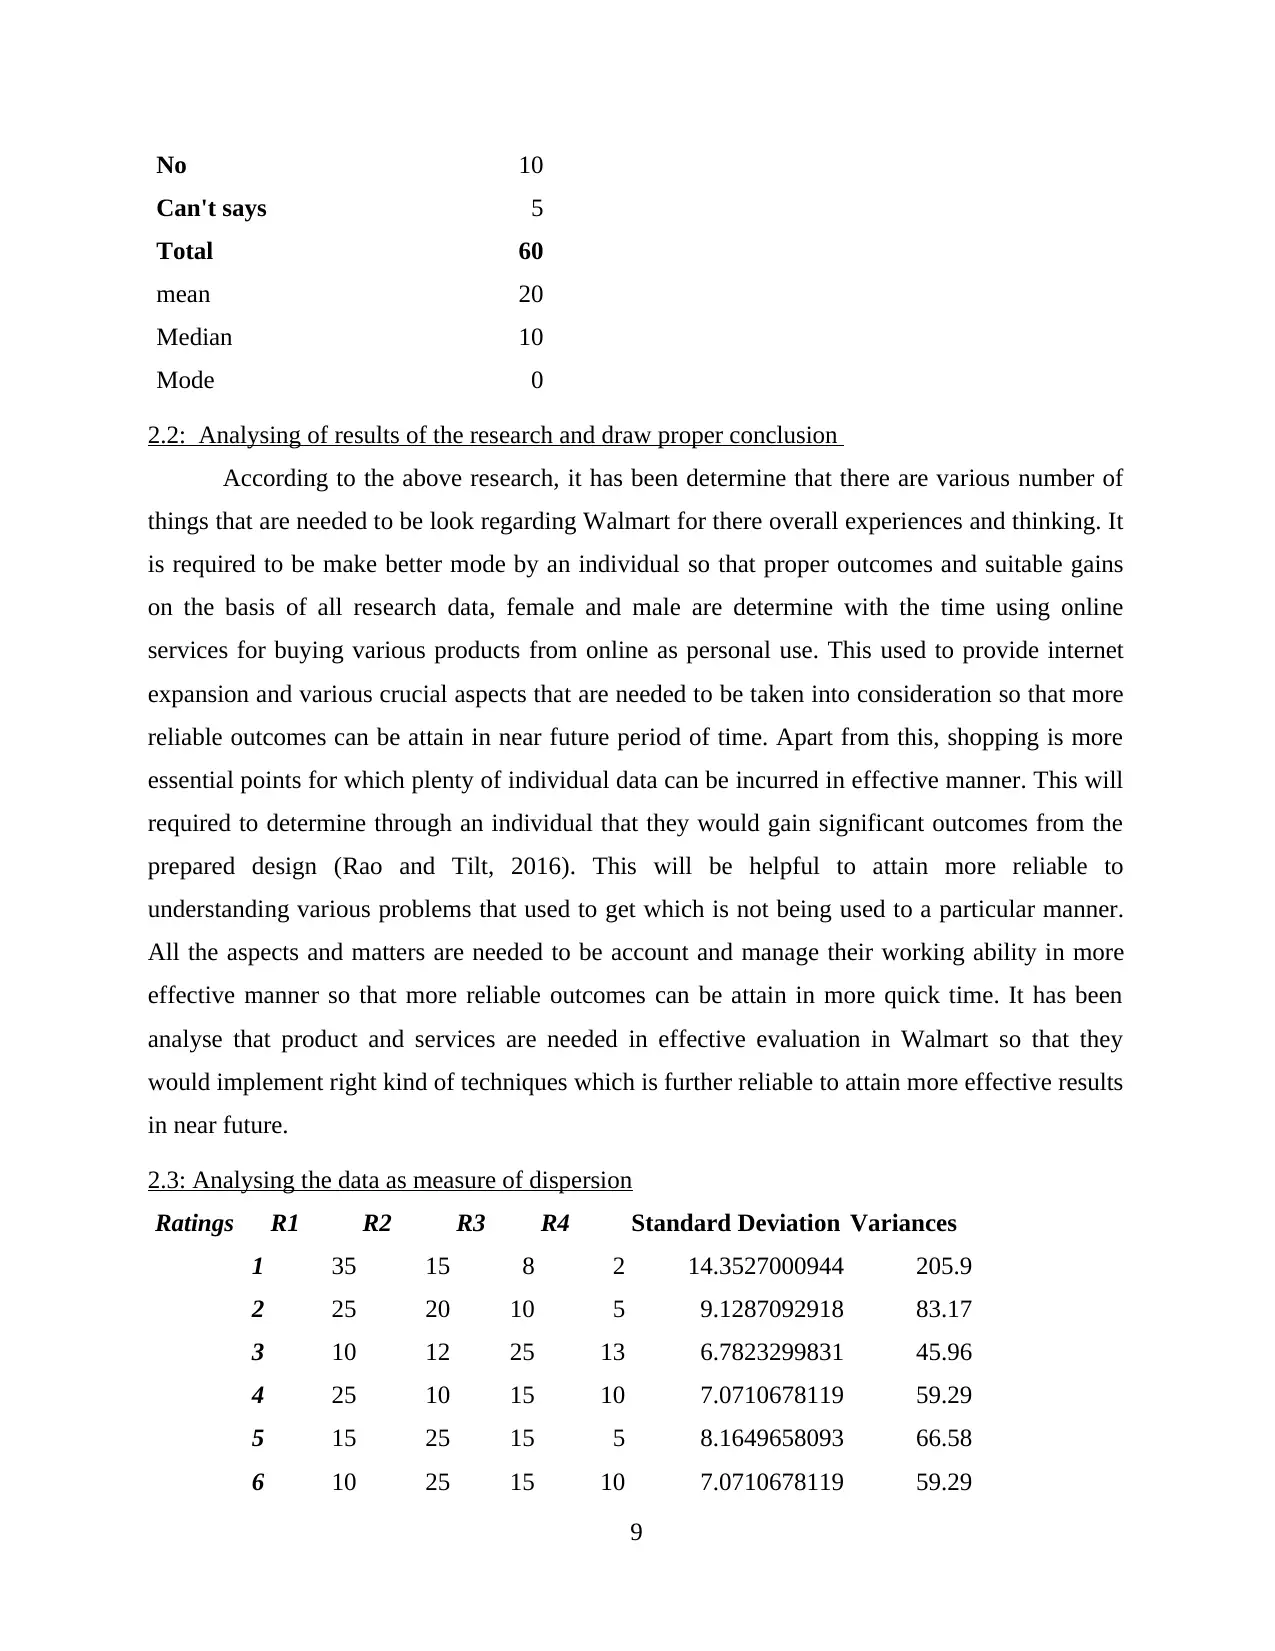
No 10
Can't says 5
Total 60
mean 20
Median 10
Mode 0
2.2: Analysing of results of the research and draw proper conclusion
According to the above research, it has been determine that there are various number of
things that are needed to be look regarding Walmart for there overall experiences and thinking. It
is required to be make better mode by an individual so that proper outcomes and suitable gains
on the basis of all research data, female and male are determine with the time using online
services for buying various products from online as personal use. This used to provide internet
expansion and various crucial aspects that are needed to be taken into consideration so that more
reliable outcomes can be attain in near future period of time. Apart from this, shopping is more
essential points for which plenty of individual data can be incurred in effective manner. This will
required to determine through an individual that they would gain significant outcomes from the
prepared design (Rao and Tilt, 2016). This will be helpful to attain more reliable to
understanding various problems that used to get which is not being used to a particular manner.
All the aspects and matters are needed to be account and manage their working ability in more
effective manner so that more reliable outcomes can be attain in more quick time. It has been
analyse that product and services are needed in effective evaluation in Walmart so that they
would implement right kind of techniques which is further reliable to attain more effective results
in near future.
2.3: Analysing the data as measure of dispersion
Ratings R1 R2 R3 R4 Standard Deviation Variances
1 35 15 8 2 14.3527000944 205.9
2 25 20 10 5 9.1287092918 83.17
3 10 12 25 13 6.7823299831 45.96
4 25 10 15 10 7.0710678119 59.29
5 15 25 15 5 8.1649658093 66.58
6 10 25 15 10 7.0710678119 59.29
9
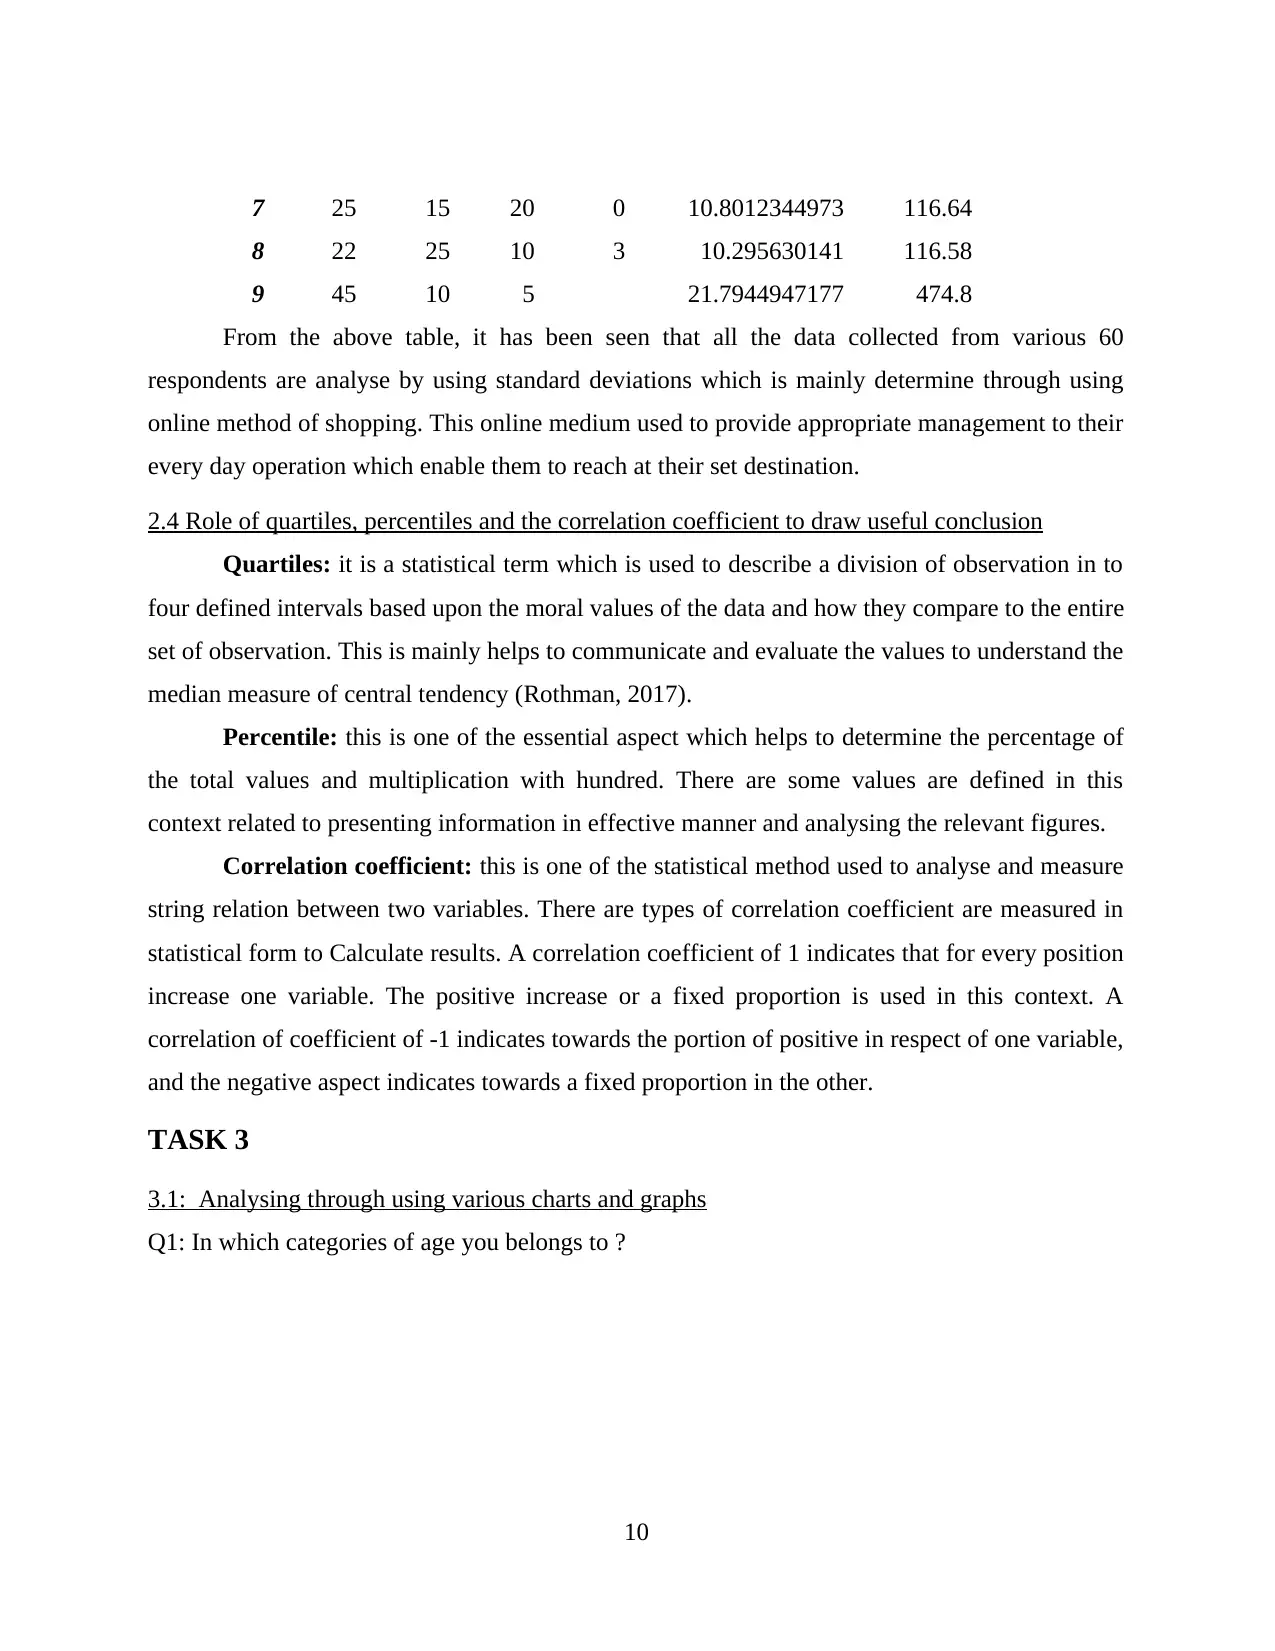
7 25 15 20 0 10.8012344973 116.64
8 22 25 10 3 10.295630141 116.58
9 45 10 5 21.7944947177 474.8
From the above table, it has been seen that all the data collected from various 60
respondents are analyse by using standard deviations which is mainly determine through using
online method of shopping. This online medium used to provide appropriate management to their
every day operation which enable them to reach at their set destination.
2.4 Role of quartiles, percentiles and the correlation coefficient to draw useful conclusion
Quartiles: it is a statistical term which is used to describe a division of observation in to
four defined intervals based upon the moral values of the data and how they compare to the entire
set of observation. This is mainly helps to communicate and evaluate the values to understand the
median measure of central tendency (Rothman, 2017).
Percentile: this is one of the essential aspect which helps to determine the percentage of
the total values and multiplication with hundred. There are some values are defined in this
context related to presenting information in effective manner and analysing the relevant figures.
Correlation coefficient: this is one of the statistical method used to analyse and measure
string relation between two variables. There are types of correlation coefficient are measured in
statistical form to Calculate results. A correlation coefficient of 1 indicates that for every position
increase one variable. The positive increase or a fixed proportion is used in this context. A
correlation of coefficient of -1 indicates towards the portion of positive in respect of one variable,
and the negative aspect indicates towards a fixed proportion in the other.
TASK 3
3.1: Analysing through using various charts and graphs
Q1: In which categories of age you belongs to ?
10
⊘ This is a preview!⊘
Do you want full access?
Subscribe today to unlock all pages.
Trusted by 1+ million students worldwide
1 out of 23
Related Documents


Your All-in-One AI-Powered Toolkit for Academic Success.
+13062052269
info@desklib.com
Available 24*7 on WhatsApp / Email
![[object Object]](/_next/static/media/star-bottom.7253800d.svg)
Unlock your academic potential
Copyright © 2020–2026 A2Z Services. All Rights Reserved. Developed and managed by ZUCOL.