Walt Disney's Financial Health: A Detailed Long Term Solvency Report

Verified

Added on  2023/06/13

|4
|1133
|209
Report
AI Summary
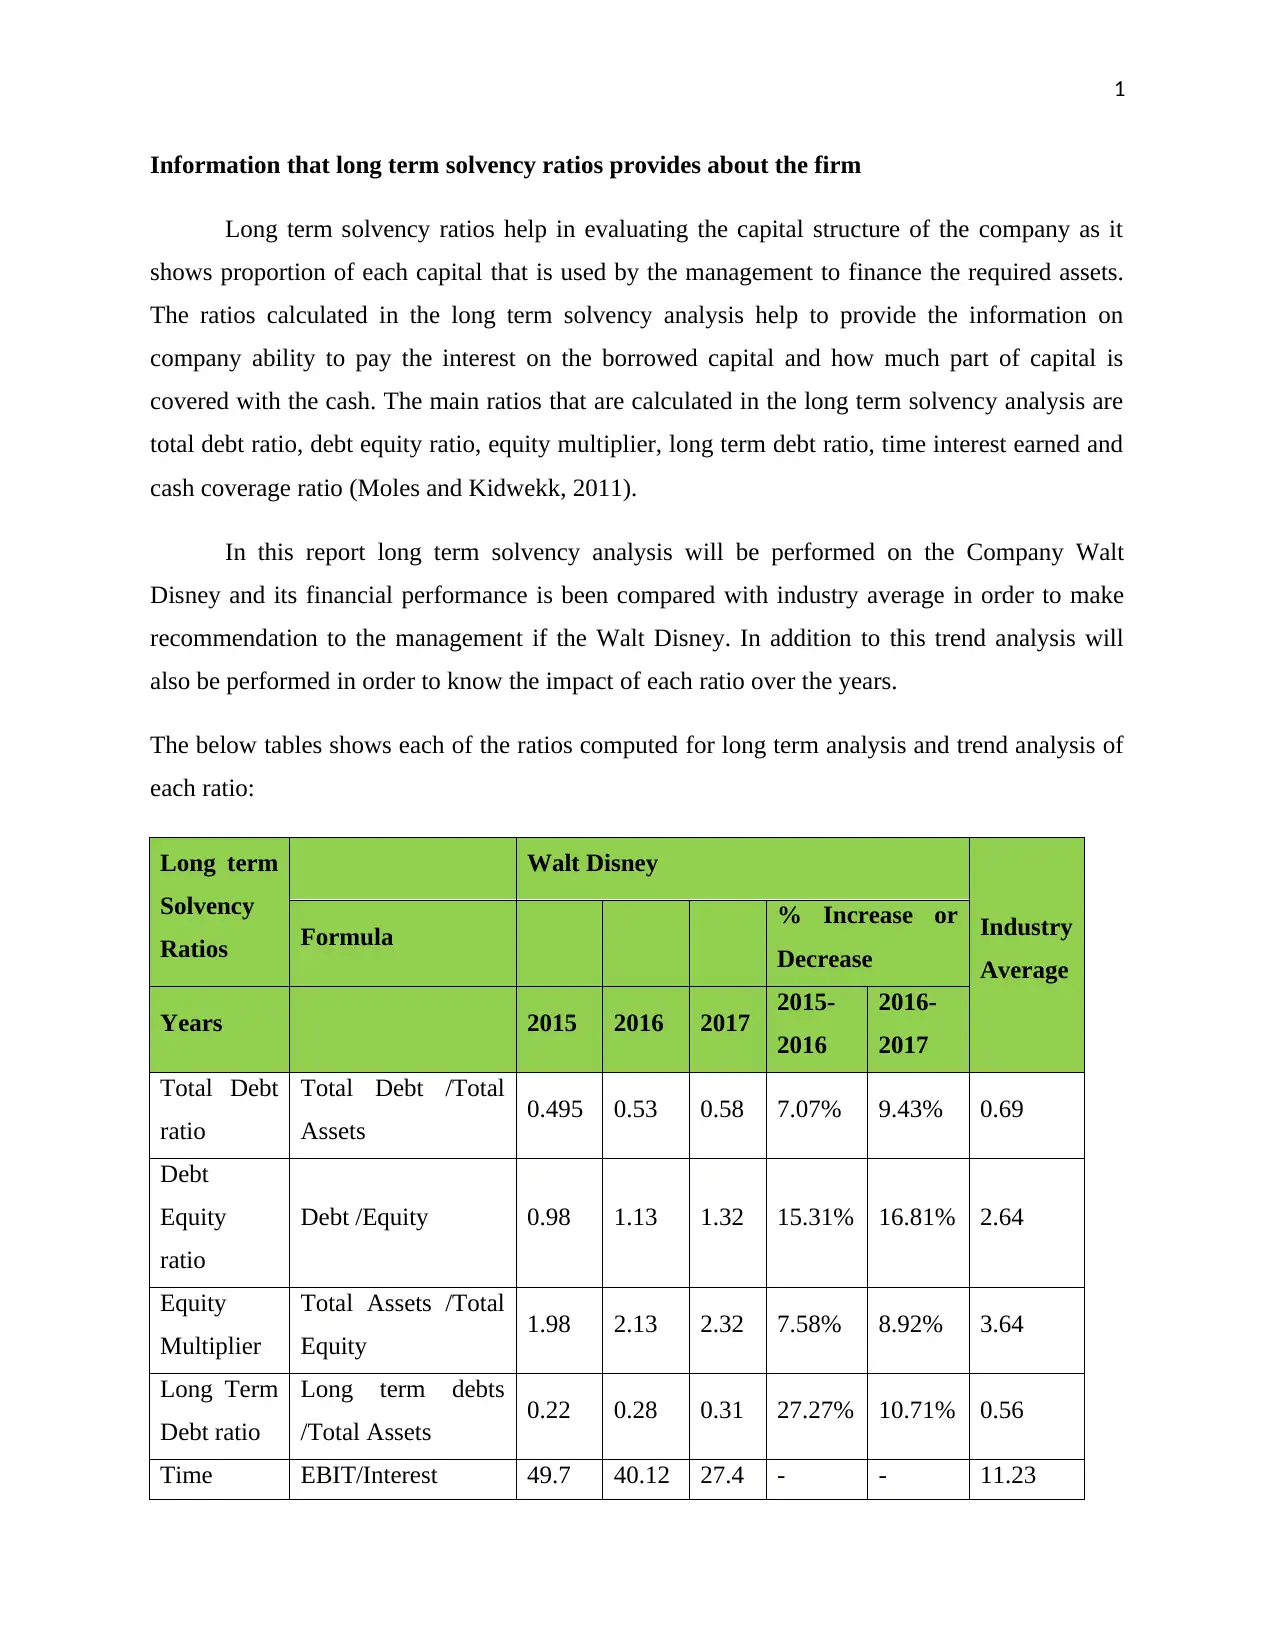
This report provides a comprehensive analysis of Walt Disney's long-term solvency, utilizing key financial ratios such as total debt ratio, debt-equity ratio, equity multiplier, long-term debt ratio, time interest earned, and cash coverage ratio. The analysis includes a trend analysis from 2015 to 2017, evaluating the company's capital structure and its ability to meet long-term financial obligations. The report also compares Walt Disney's financial performance against industry averages, offering recommendations to management regarding debt management and financial stability. The findings indicate an increasing debt ratio and decreasing interest coverage, suggesting areas for improvement in Walt Disney's financial strategy.
Document Page
1
Information that long term solvency ratios provides about the firm
Long term solvency ratios help in evaluating the capital structure of the company as it
shows proportion of each capital that is used by the management to finance the required assets.
The ratios calculated in the long term solvency analysis help to provide the information on
company ability to pay the interest on the borrowed capital and how much part of capital is
covered with the cash. The main ratios that are calculated in the long term solvency analysis are
total debt ratio, debt equity ratio, equity multiplier, long term debt ratio, time interest earned and
cash coverage ratio (Moles and Kidwekk, 2011).
In this report long term solvency analysis will be performed on the Company Walt
Disney and its financial performance is been compared with industry average in order to make
recommendation to the management if the Walt Disney. In addition to this trend analysis will
also be performed in order to know the impact of each ratio over the years.
The below tables shows each of the ratios computed for long term analysis and trend analysis of
each ratio:
Long term
Solvency
Ratios
Walt Disney
Industry
Average
Formula % Increase or
Decrease
Years 2015 2016 2017 2015-
2016
2016-
2017
Total Debt
ratio
Total Debt /Total
Assets 0.495 0.53 0.58 7.07% 9.43% 0.69
Debt
Equity
ratio
Debt /Equity 0.98 1.13 1.32 15.31% 16.81% 2.64
Equity
Multiplier
Total Assets /Total
Equity 1.98 2.13 2.32 7.58% 8.92% 3.64
Long Term
Debt ratio
Long term debts
/Total Assets 0.22 0.28 0.31 27.27% 10.71% 0.56
Time EBIT/Interest 49.7 40.12 27.4 - - 11.23
tabler-icon-diamond-filled.svg

Secure Best Marks with AI Grader

Need help grading? Try our AI Grader for instant feedback on your assignments.
Document Page
2
Interest
earned 19.28% 31.70%
Cash
Coverage
ratio
(Earnings Before
Interest and Taxes +
Non-Cash
Expenses) ÷ Interest
Expense
58.58 47.26 35.8 -
19.32%
-
24.25% 13.94
Total Debt Ratio: The ratio helps in assessing the leverage position of a company by providing
an estimate of the total debt in comparison to the total assets. As this ratio shows total amount of
debt that company owns in relation to total assets so if it increase year by year that it means
company has taken more bank loans that has increased the amount of total debt. As it can be
clearly seen form the above table that total debt ratio has been increasing from year 2015 to 2016
by 7.07% and from year 2016 to 2017 by 9.43%. The greater proportion of debt as compared to
total assets shows poor capital structure of the company. The industry average is no doubt more
that the company total debt ratio but management must look after to reduce the debt proportion
in future years (Brealey, Myers and Marcus, 2007).
Debt-Equity Ratio: It is a financial ratio used for proving an estimate of the equity and debt
used by a company for financing its assets. The main purpose of this ratio is to find out debt and
equity capital proportion at the end of particular year. As debt reflects the leverage capital and
bears the charge on company profits that it must be reduced as much as possible. It has been
found that there has been more that 15% increase in debt equity ratio in year 2016 and 2017 as
compared with their respective previous years. So both debt equity ratio and total debt clearly
indicates that capital structure of Walt Disney is not sound and there need to take necessary steps
by the management (Arnold, 2013).
Equity Multiplier Ratio: This ratio indicates the amount of fixed assets that has been financed
by the equity capital. If this ratio got increases on year to year basis that it reflects that there has
been increase in equity capital for financing the assets of the company. Looking at the above
table it can be find that equity multiplier has been increased in both 2016 and 2017 that shows
minor increase in equity capital for financing the assets of the company. The equity multiplier of
industry is 3.64 times which is almost one times more than the company equity multiplier in year
Document Page
3
2017 that indicates poor utilization if equity for financing the assets of the company (Ross, Jaffe
and Kakani, 2008).
Long-term debt ratio: It provides a measure of the percentage of the assets of a company
financed with loans or other long-term financial obligations. The above table clearly shows that
Walt Disney has taken the bank loan or any long term debt in year 2016 that has raised the long
term debt by 27.27% in year 2016. The industry average is just double the financial leverage
ratio of Walt Disney that shows company has adequate capital structure but regular rise in debt
without paying them is not for the company in future years.
Time-Interest earned: It provides a measure of the ability of a company to meet its debt
obligations. This ratio is constantly decreasing as seen from the above table that means the
income or profits available to paid the interested fees on debt capital has been regularly
decreasing due to increase in interest payment amount (Brigham and Michael, 2013).
Cash-Coverage ratio: It is used for determining the amount of cash available within company to
meet the interest expenses on its debt. It seems that cash availability to finance or to pay the
interest fees has been constantly decreasing. It reflects that there can be shortage of cash in future
years if company will raise its debt capital in rapid speed without paying them. The company
ratio is greater than industry average that shows positive financial structure of the company
(Bromwich and Bhimani, 2005).
Document Page
4
References
Arnold, G. Corporate financial management. Pearson Higher Ed. 2013. Print.
Brealey, R., Myers, S.C. and Marcus, A.J. FundamentalsofCorporate Finance. Mc Graw Hill,
New York. 2007. Print.
Brigham, F., and Michael C. Financial management: Theory & practice. Cengage Learning.
2013. Print.
Bromwich, M. and Bhimani, A. Management accounting: Pathways to progress. Cima
publishing. 2005. Print.
Moles, P. and Kidwekk, D. Corporate finance. John Wiley &sons. 2011. Print.
Ross, A., Jaffe, J. and Kakani, R.K. Corporate Finance. Pearson. 2008. Print.
chevron_up_icon
1 out of 4
circle_padding
hide_on_mobile
zoom_out_icon
[object Object]