Financial Performance Analysis of WAM Capital Limited - Report

Verified

Added on  2023/01/10

|8
|541
|85
Report
AI Summary
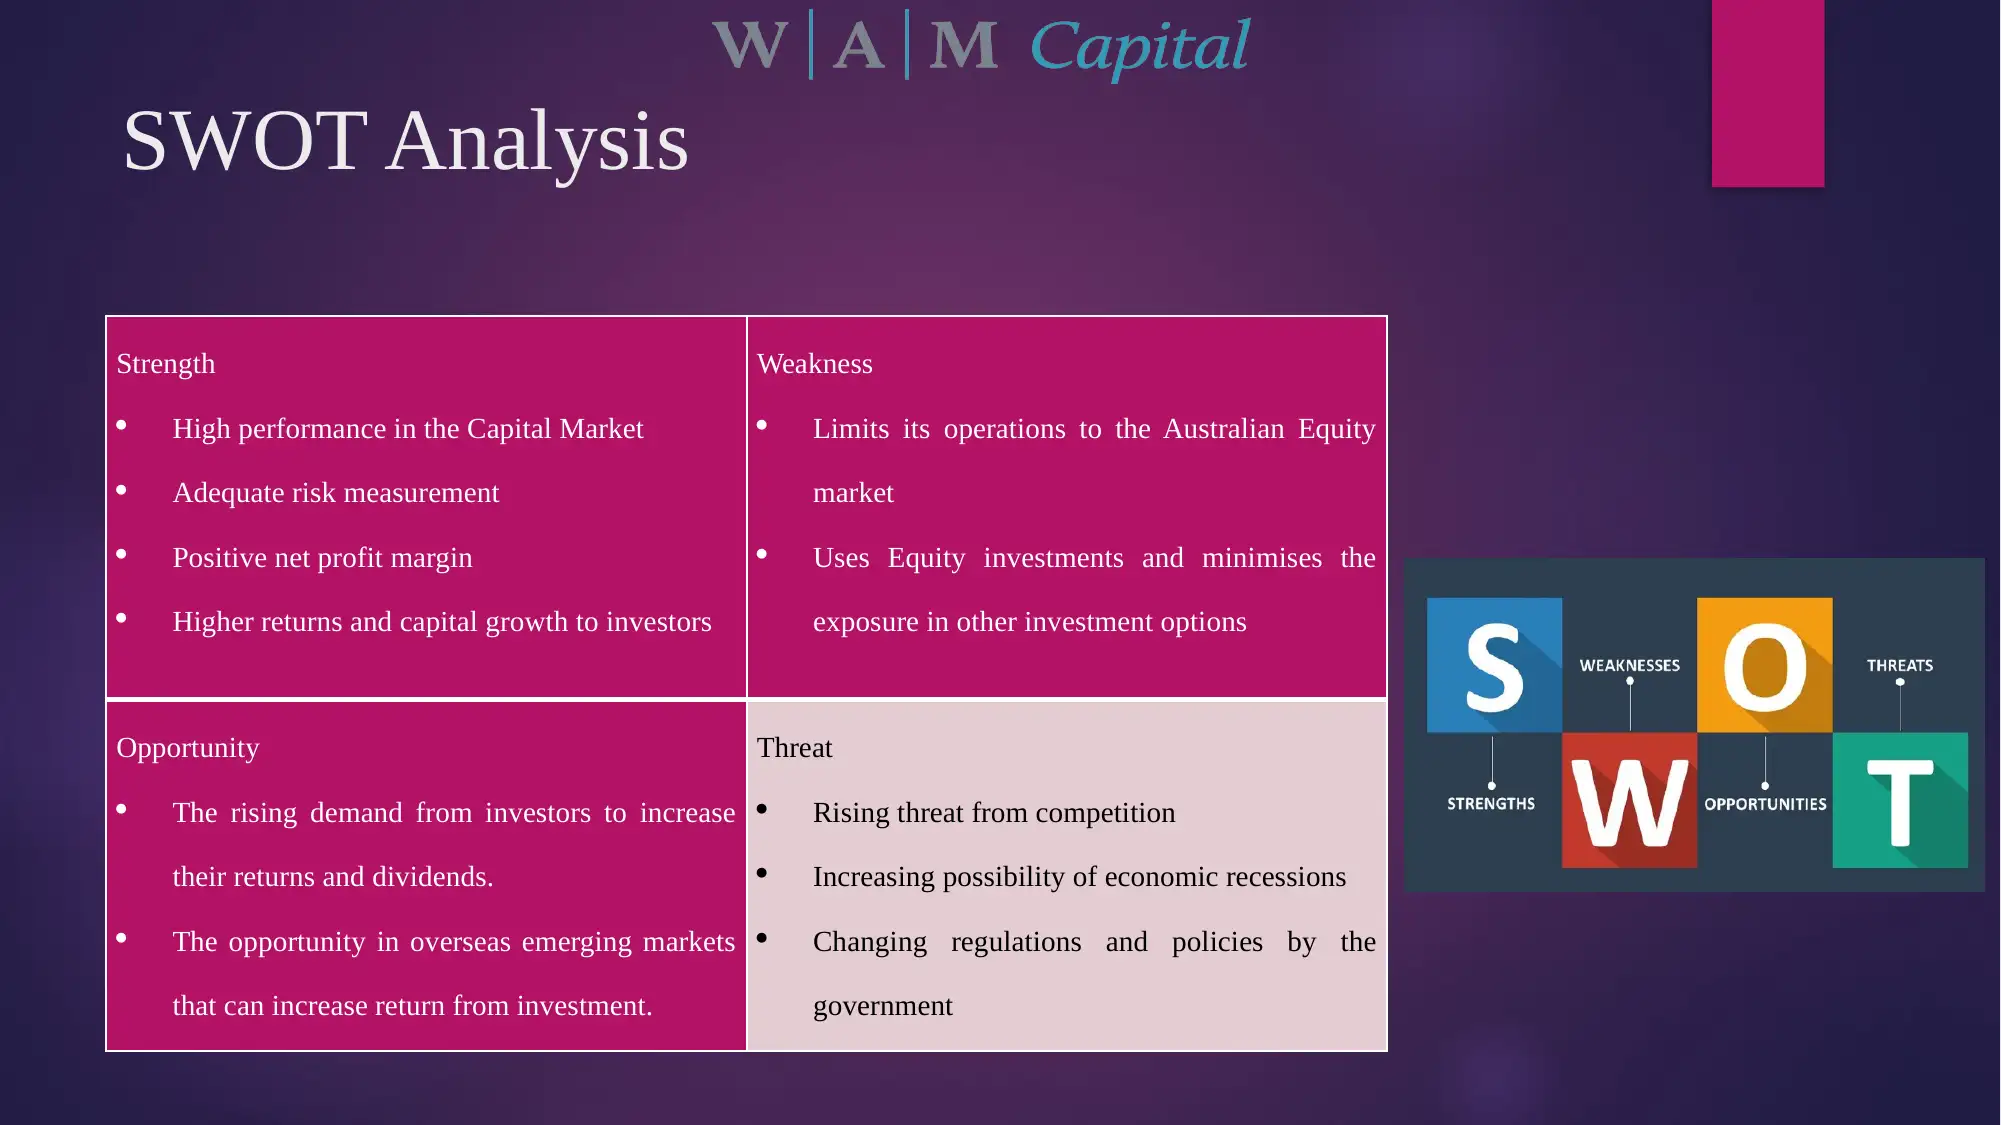
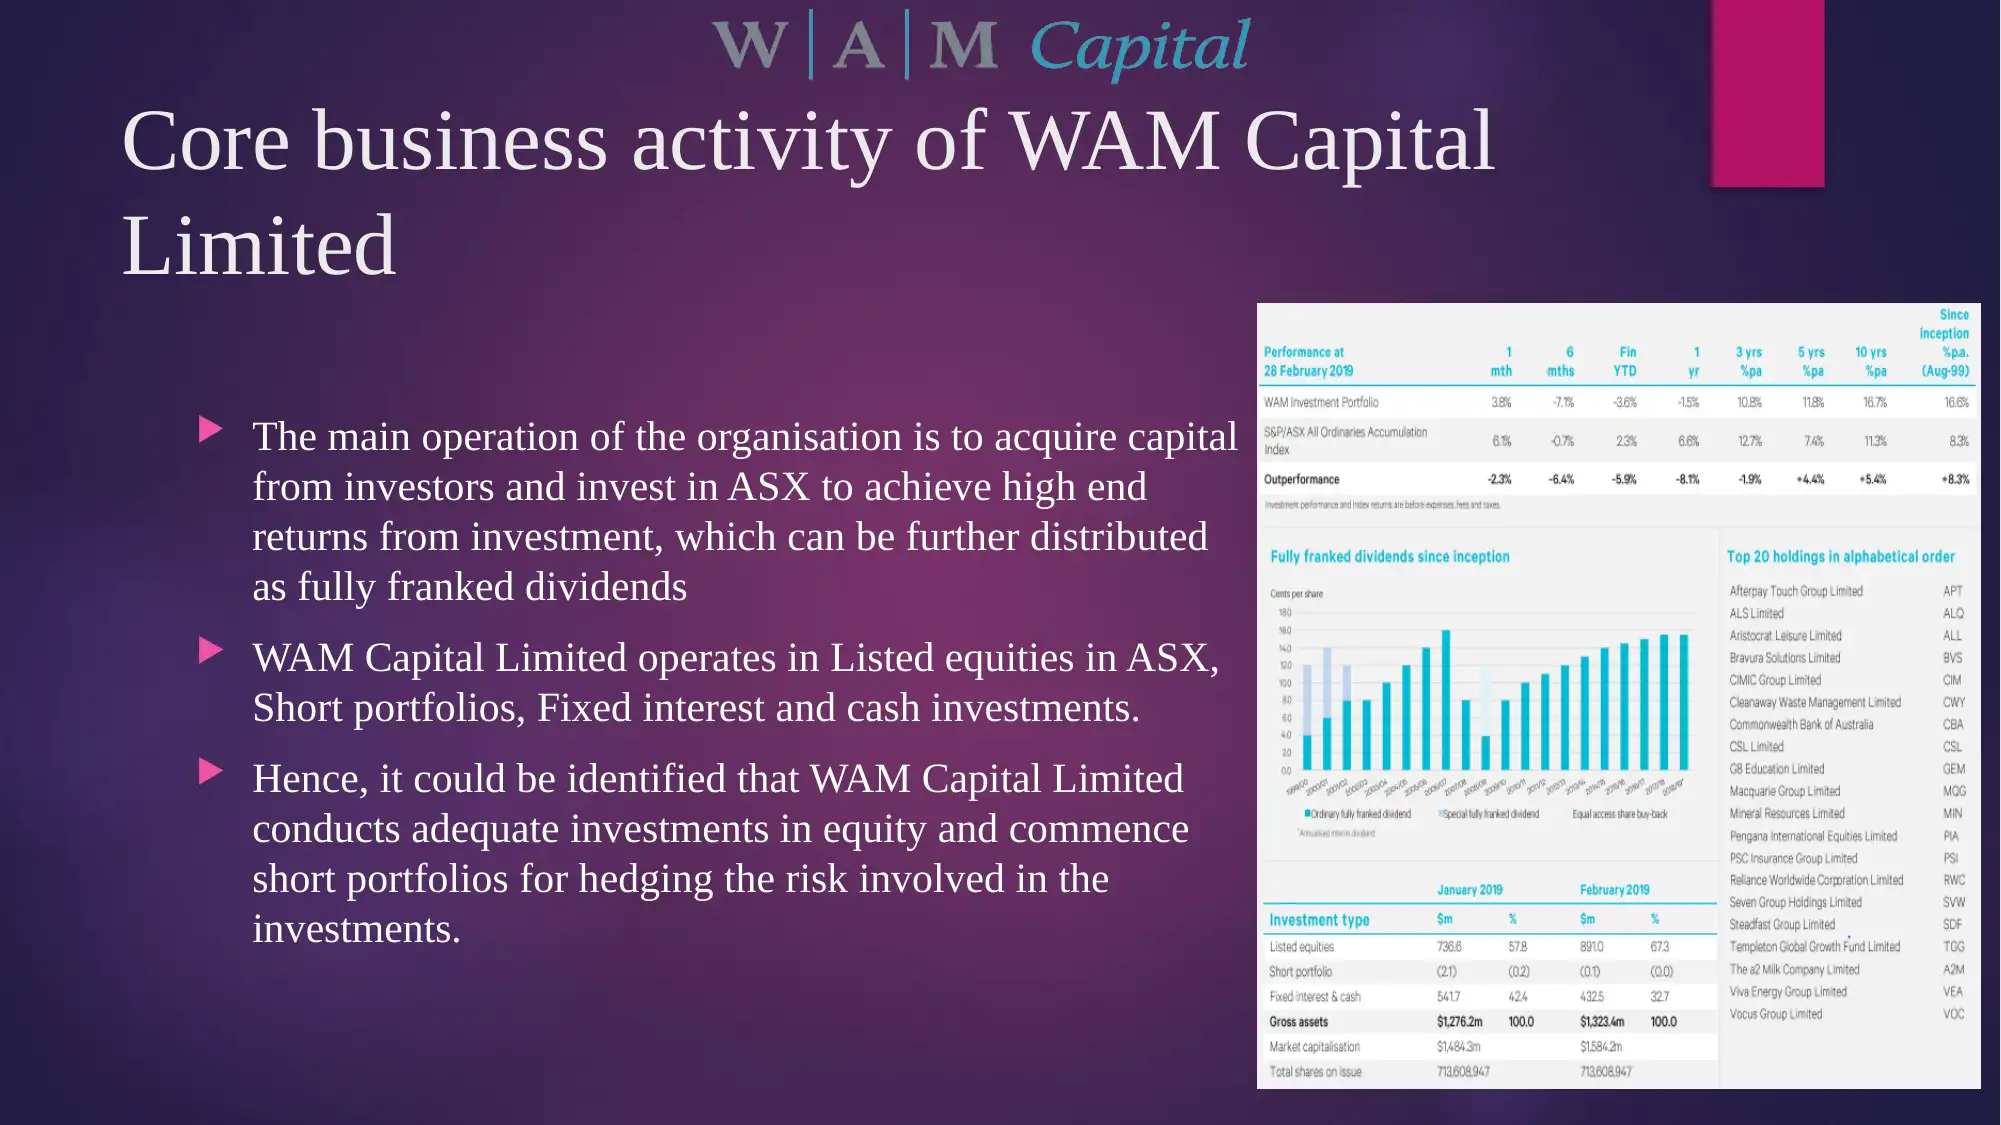
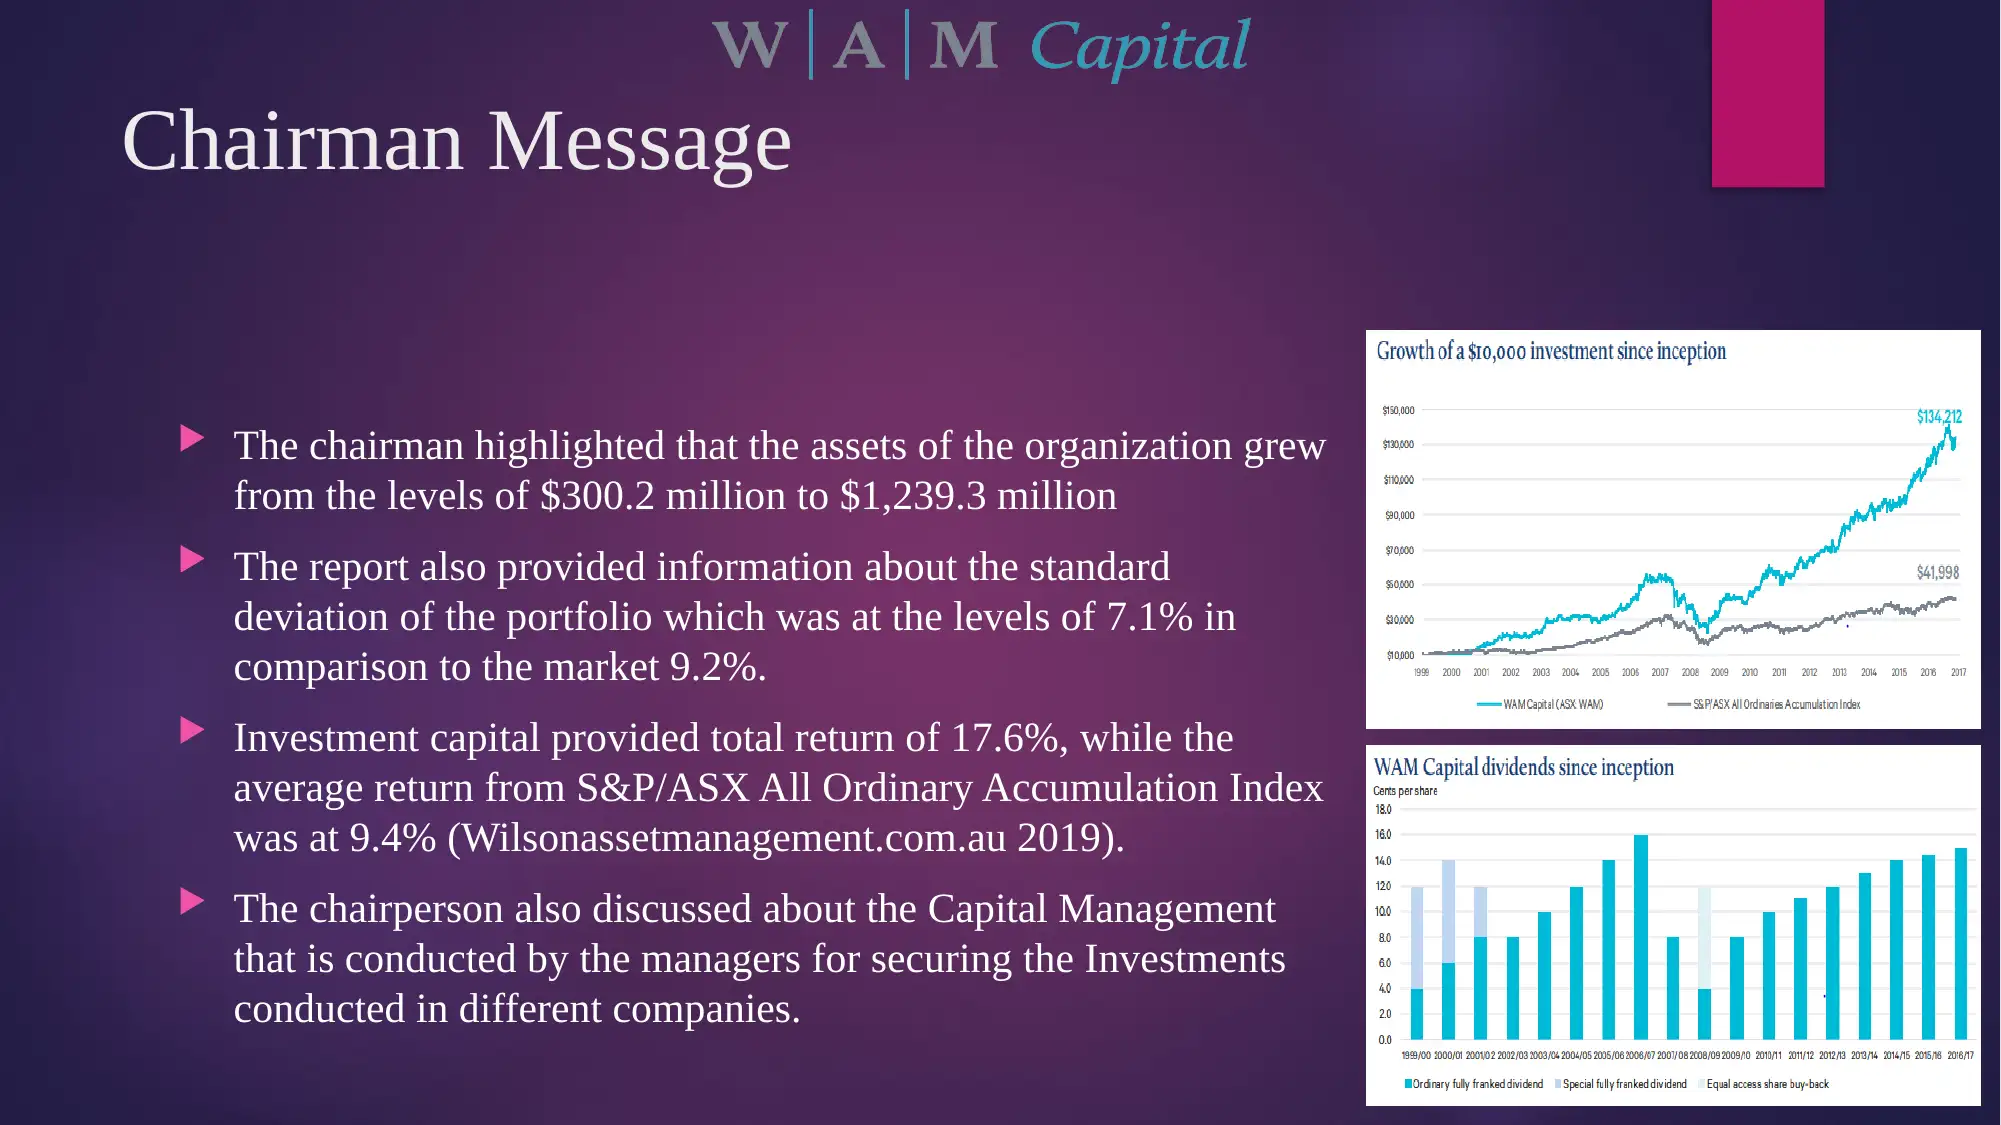
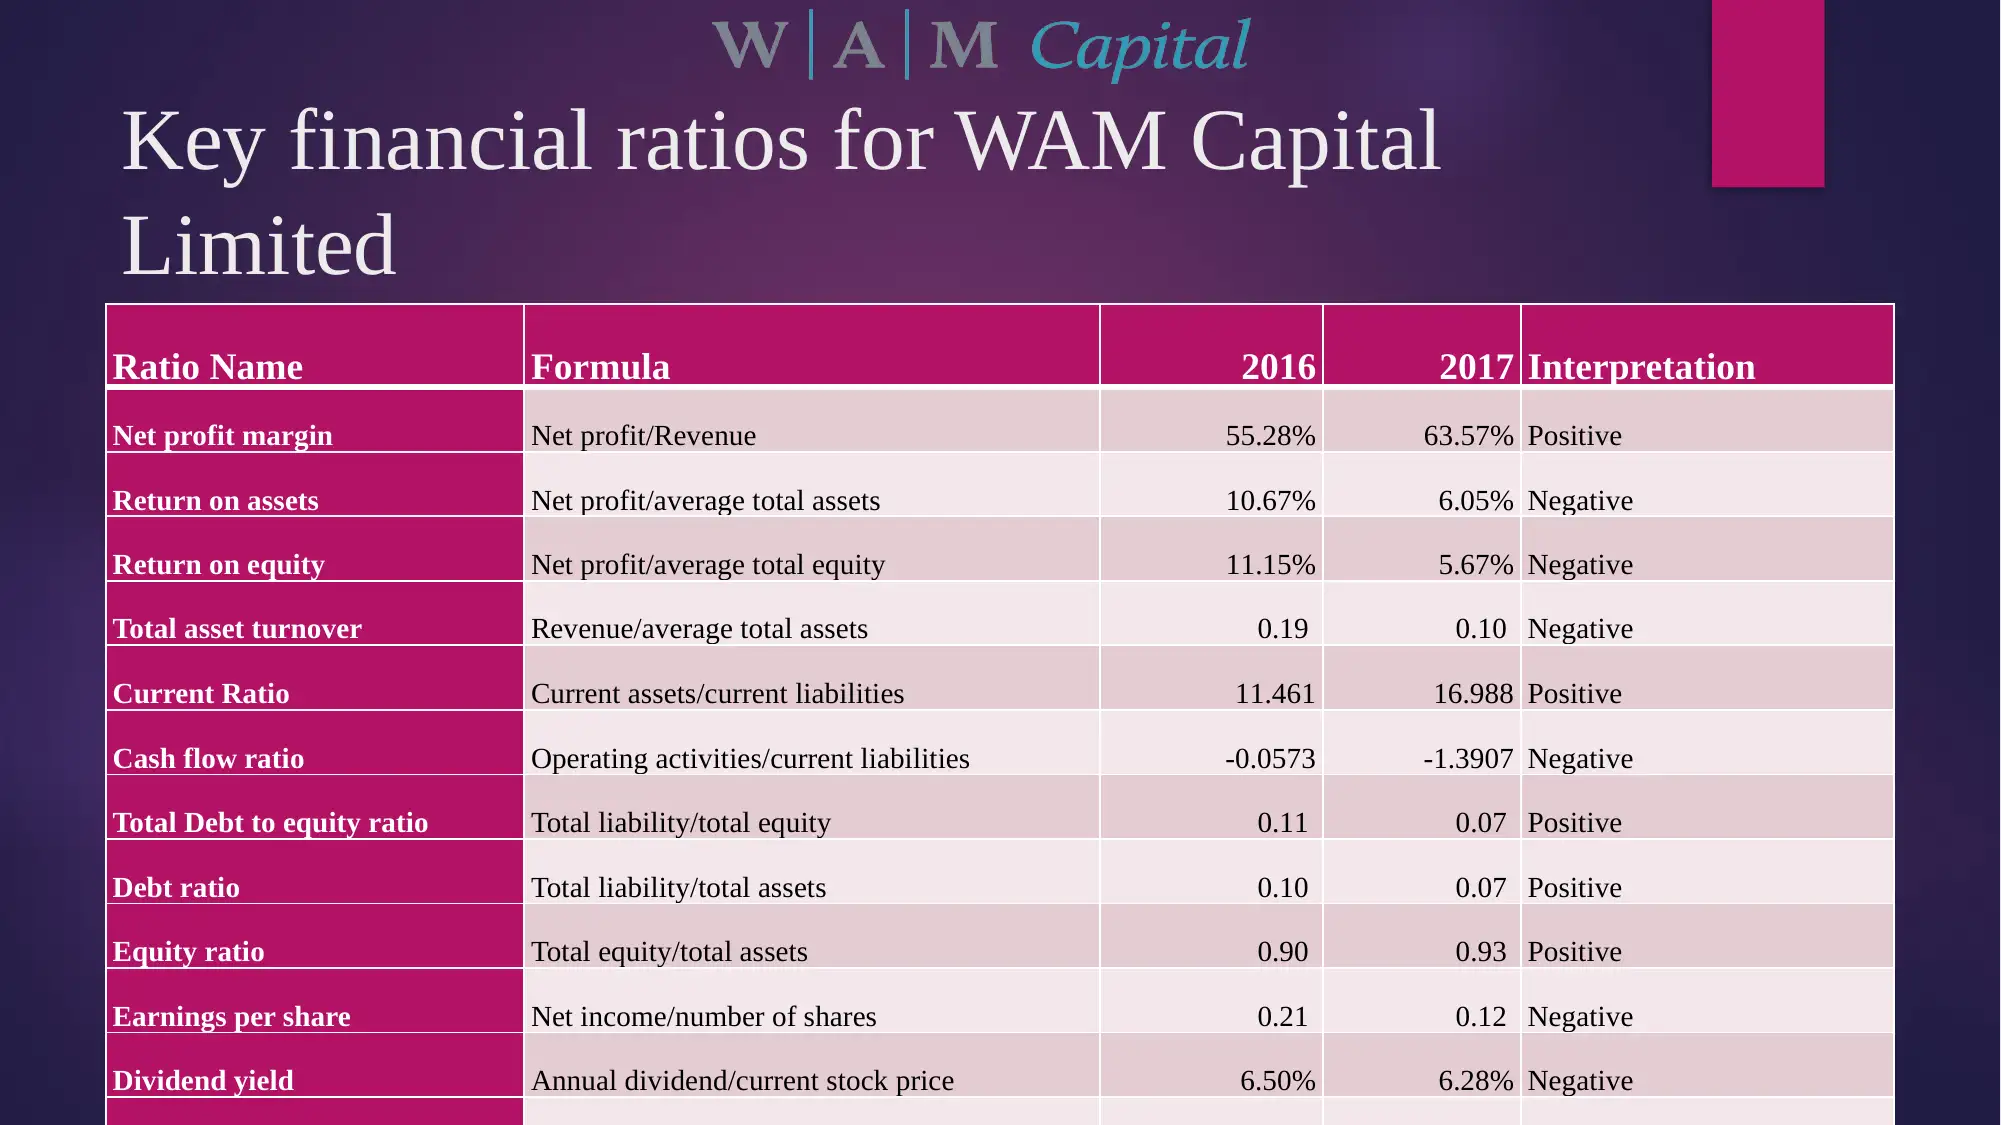
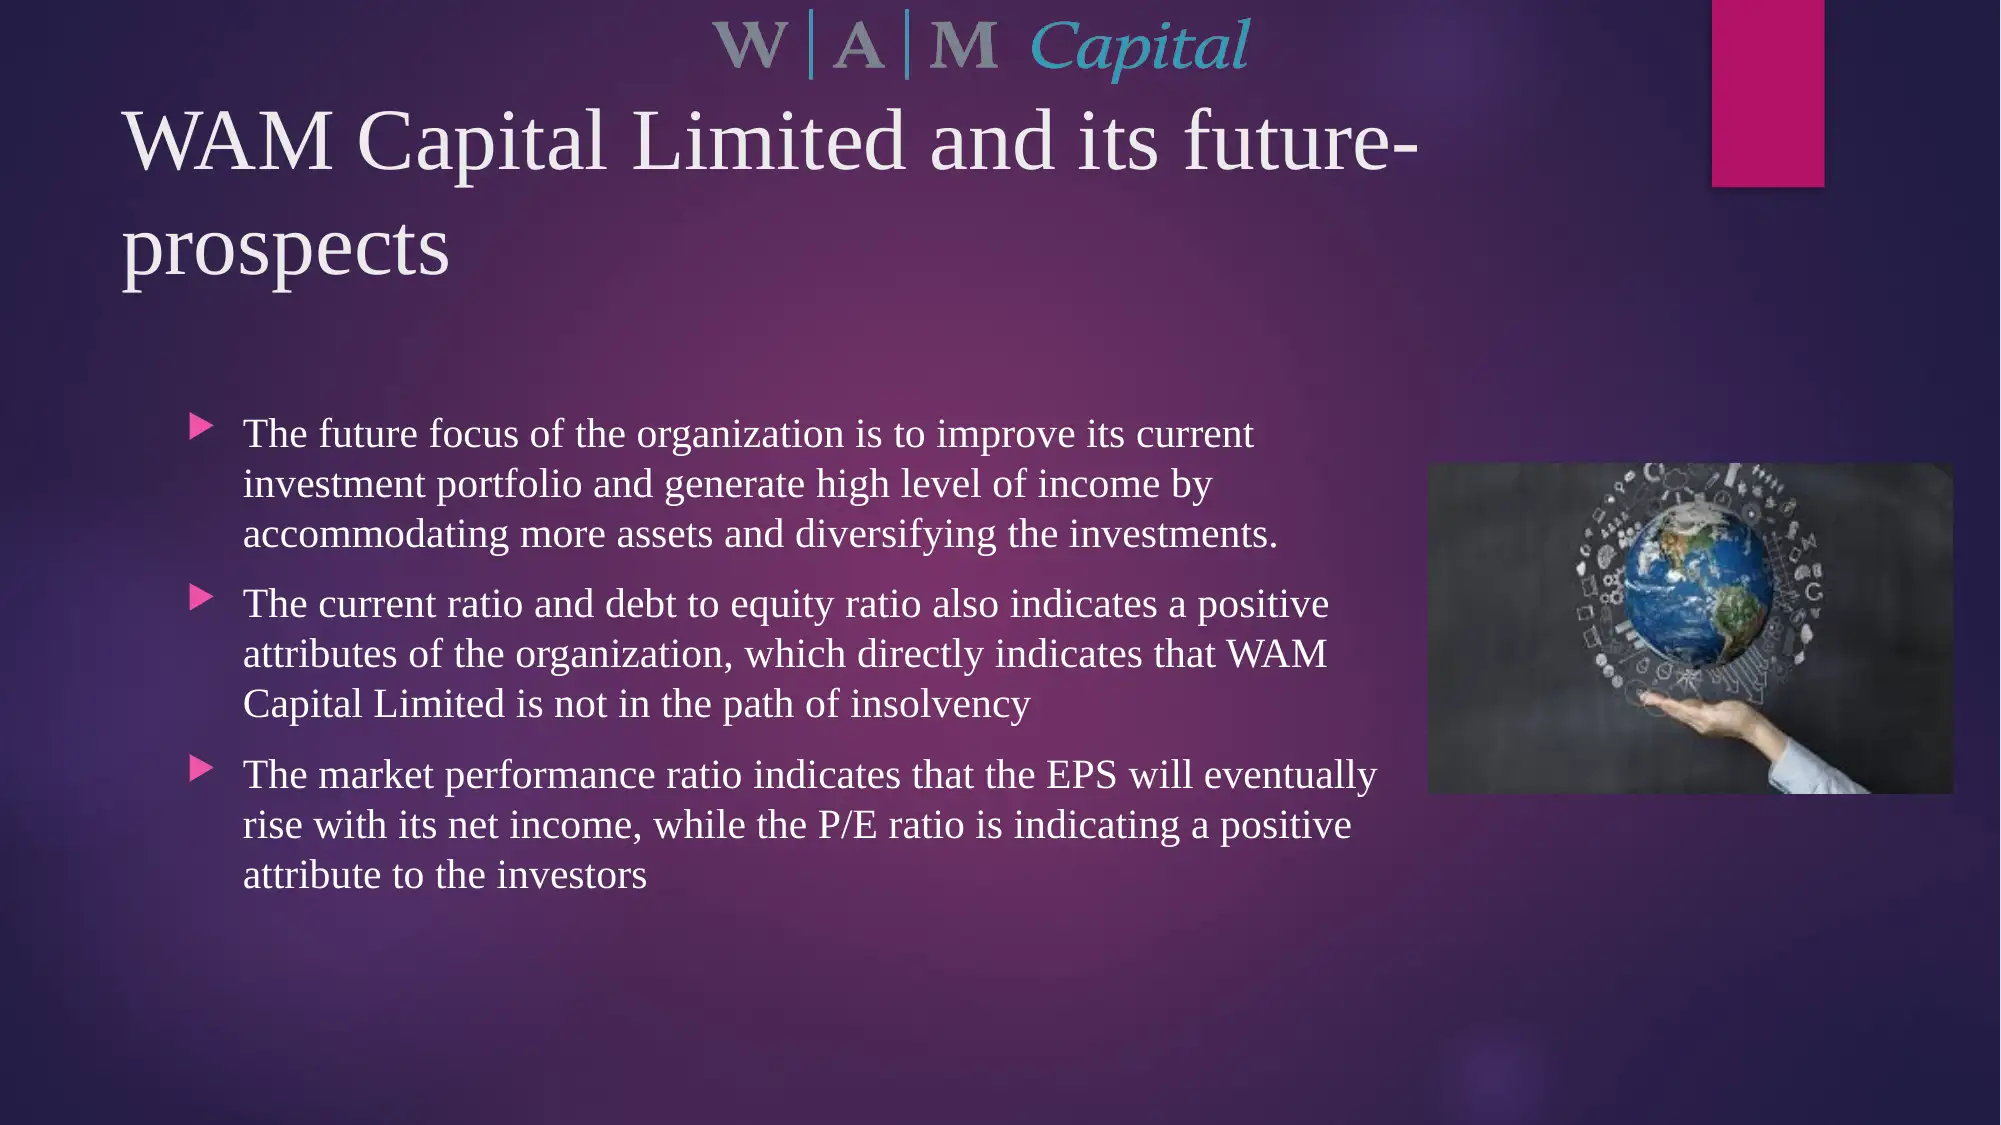
This report provides a comprehensive financial analysis of WAM Capital Limited (ASX: WAM). It begins with an overview of the company's core business activities, which involve acquiring capital from investors and investing in ASX-listed equities to generate high returns. The analysis includes a SWOT analysis, highlighting strengths, weaknesses, opportunities, and threats. The report examines the chairman's message, discussing key financial performance indicators such as asset growth and investment returns. Key financial ratios, including net profit margin, return on assets, and debt-to-equity ratio, are calculated and interpreted for 2016 and 2017. Finally, the report assesses WAM Capital Limited's future prospects, considering its current financial standing, market performance, and strategies for growth and diversification.
Document Page
Financial Statement Analysis
WAM CAPITAL LIMITED
tabler-icon-diamond-filled.svg

Paraphrase This Document

Need a fresh take? Get an instant paraphrase of this document with our AI Paraphraser
Document Page
SWOT Analysis
Strength
High performance in the Capital Market
Adequate risk measurement
Positive net profit margin
Higher returns and capital growth to investors
Weakness
Limits its operations to the Australian Equity
market
Uses Equity investments and minimises the
exposure in other investment options
Opportunity
The rising demand from investors to increase
their returns and dividends.
The opportunity in overseas emerging markets
that can increase return from investment.
Threat
Rising threat from competition
Increasing possibility of economic recessions
Changing regulations and policies by the
government
Document Page
Core business activity of WAM Capital
Limited
The main operation of the organisation is to acquire capital
from investors and invest in ASX to achieve high end
returns from investment, which can be further distributed
as fully franked dividends
WAM Capital Limited operates in Listed equities in ASX,
Short portfolios, Fixed interest and cash investments.
Hence, it could be identified that WAM Capital Limited
conducts adequate investments in equity and commence
short portfolios for hedging the risk involved in the
investments.
Document Page
Chairman Message
The chairman highlighted that the assets of the organization grew
from the levels of $300.2 million to $1,239.3 million
The report also provided information about the standard
deviation of the portfolio which was at the levels of 7.1% in
comparison to the market 9.2%.
Investment capital provided total return of 17.6%, while the
average return from S&P/ASX All Ordinary Accumulation Index
was at 9.4% (Wilsonassetmanagement.com.au 2019).
The chairperson also discussed about the Capital Management
that is conducted by the managers for securing the Investments
conducted in different companies.
tabler-icon-diamond-filled.svg

Paraphrase This Document

Need a fresh take? Get an instant paraphrase of this document with our AI Paraphraser
Document Page
Key financial ratios for WAM Capital
Limited
Ratio Name Formula 2016 2017 Interpretation
Net profit margin Net profit/Revenue 55.28% 63.57% Positive
Return on assets Net profit/average total assets 10.67% 6.05% Negative
Return on equity Net profit/average total equity 11.15% 5.67% Negative
Total asset turnover Revenue/average total assets 0.19 0.10 Negative
Current Ratio Current assets/current liabilities 11.461 16.988 Positive
Cash flow ratio Operating activities/current liabilities -0.0573 -1.3907 Negative
Total Debt to equity ratio Total liability/total equity 0.11 0.07 Positive
Debt ratio Total liability/total assets 0.10 0.07 Positive
Equity ratio Total equity/total assets 0.90 0.93 Positive
Earnings per share Net income/number of shares 0.21 0.12 Negative
Dividend yield Annual dividend/current stock price 6.50% 6.28% Negative
Document Page
WAM Capital Limited and its future-
prospects
The future focus of the organization is to improve its current
investment portfolio and generate high level of income by
accommodating more assets and diversifying the investments.
The current ratio and debt to equity ratio also indicates a positive
attributes of the organization, which directly indicates that WAM
Capital Limited is not in the path of insolvency
The market performance ratio indicates that the EPS will eventually
rise with its net income, while the P/E ratio is indicating a positive
attribute to the investors
Document Page
Reference
Wilsonassetmanagement.com.au. 2019. [online] Available at:
https://wilsonassetmanagement.com.au/wp-content/uploads/2017/07/WAM-
Capital-Annual-Report-30-June-2017-without-Appendix-4E-for-website.pdf
[Accessed 8 Apr. 2019].
tabler-icon-diamond-filled.svg

Paraphrase This Document

Need a fresh take? Get an instant paraphrase of this document with our AI Paraphraser
Document Page
chevron_up_icon
1 out of 8
circle_padding
hide_on_mobile
zoom_out_icon
[object Object]