Wastewater Engineering Laboratory Report: Data Analysis and Results

Verified

Added on  2019/10/16

|2
|683
|244
Report
AI Summary
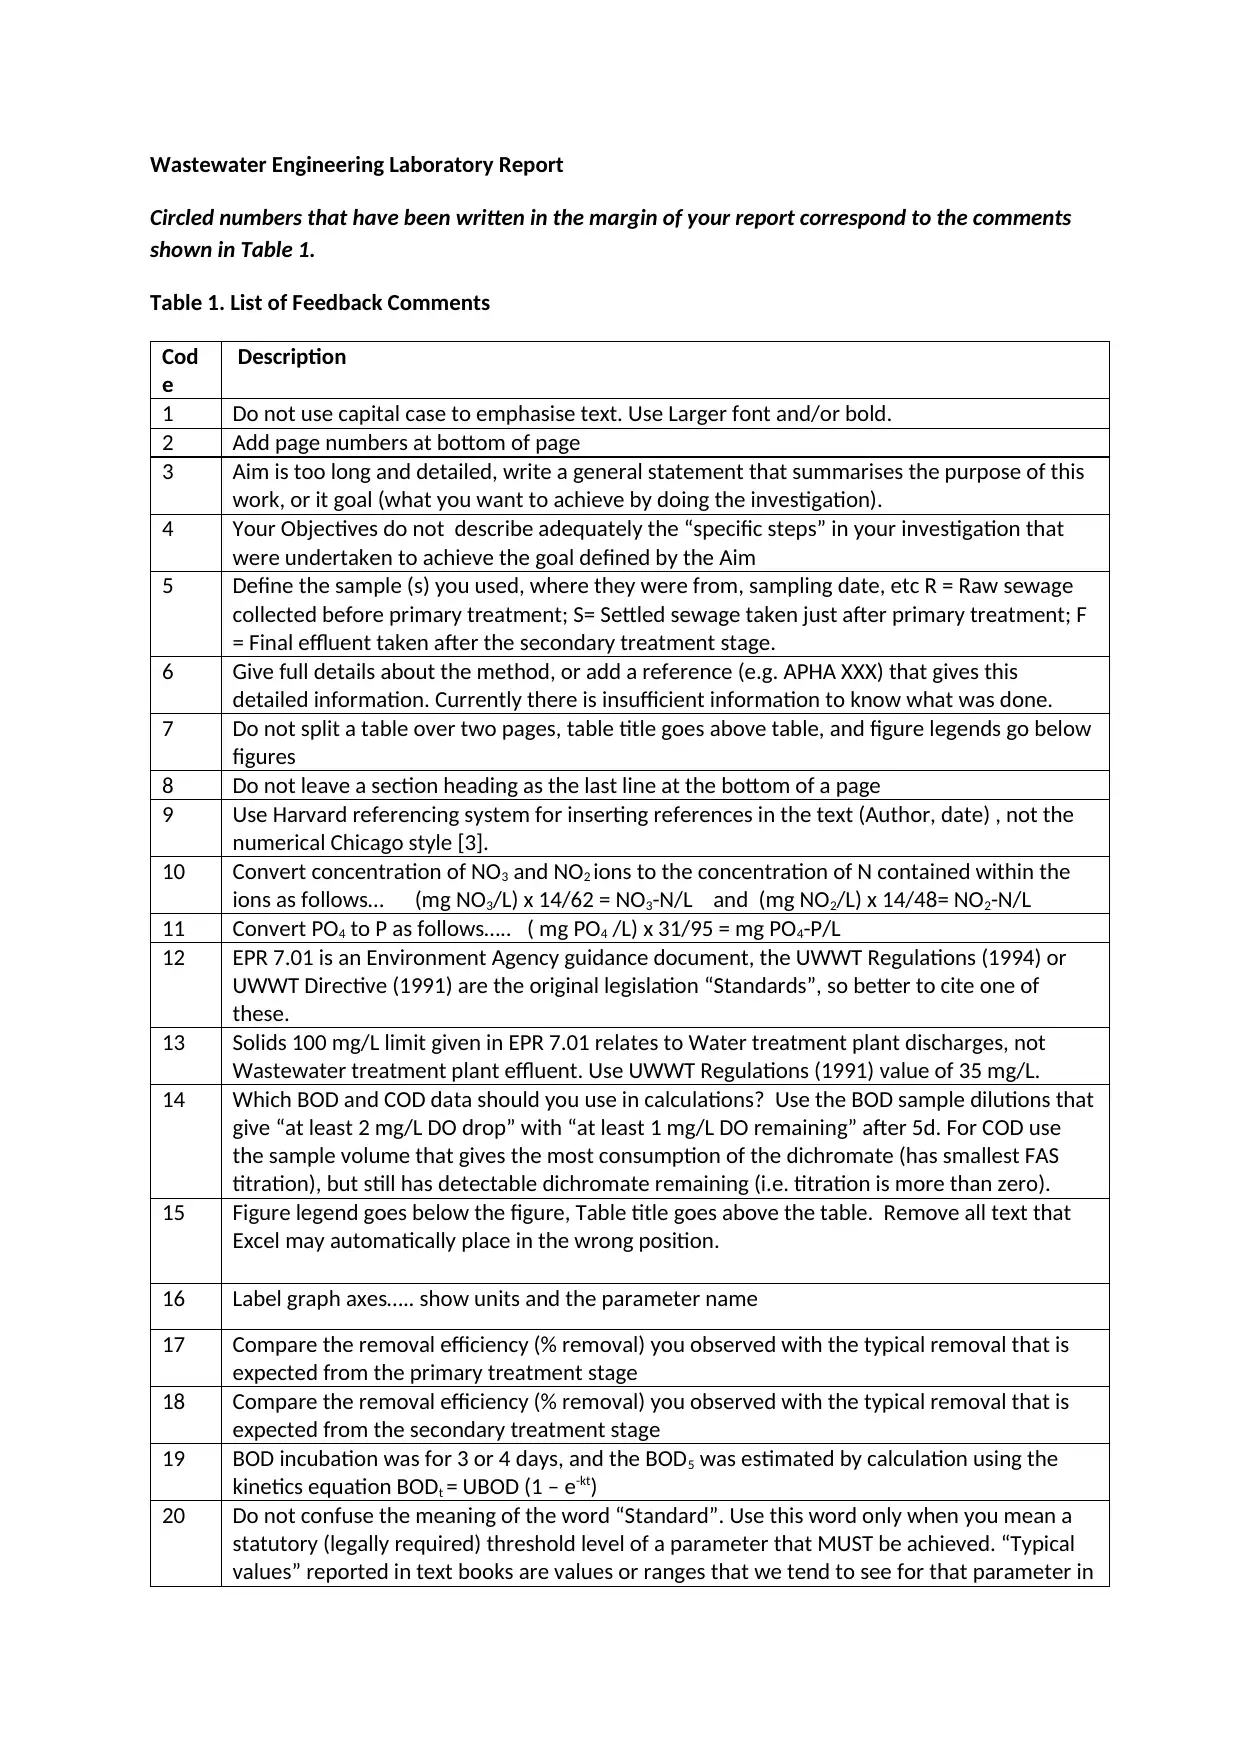
This document is a wastewater engineering laboratory report that addresses feedback comments on various aspects of the report. The report includes detailed instructions and clarifications on formatting, content, and analysis. Specific feedback addresses the use of capitalization, page numbering, the aim and objectives, sample definitions, referencing, and data presentation. The feedback also covers calculations for converting concentrations of NO3, NO2, and PO4, along with the correct standards and typical values for solids. Additionally, it provides guidance on BOD and COD data selection, graph labeling, and the comparison of removal efficiencies in primary and secondary treatment stages. The document clarifies the correct use of the term "Standard" and provides instructions on BOD incubation and the estimation of BOD5.
tabler-icon-diamond-filled.svg

Contribute Materials

Your contribution can guide someone’s learning journey. Share your documents today.
Document Page
Wastewater Engineering Laboratory Report
Circled numbers that have been written in the margin of your report correspond to the comments
shown in Table 1.
Table 1. List of Feedback Comments
Cod
e
Description
1 Do not use capital case to emphasise text. Use Larger font and/or bold.
2 Add page numbers at bottom of page
3 Aim is too long and detailed, write a general statement that summarises the purpose of this
work, or it goal (what you want to achieve by doing the investigation).
4 Your Objectives do not describe adequately the “specific steps” in your investigation that
were undertaken to achieve the goal defined by the Aim
5 Define the sample (s) you used, where they were from, sampling date, etc R = Raw sewage
collected before primary treatment; S= Settled sewage taken just after primary treatment; F
= Final effluent taken after the secondary treatment stage.
6 Give full details about the method, or add a reference (e.g. APHA XXX) that gives this
detailed information. Currently there is insufficient information to know what was done.
7 Do not split a table over two pages, table title goes above table, and figure legends go below
figures
8 Do not leave a section heading as the last line at the bottom of a page
9 Use Harvard referencing system for inserting references in the text (Author, date) , not the
numerical Chicago style [3].
10 Convert concentration of NO3 and NO2 ions to the concentration of N contained within the
ions as follows… (mg NO3/L) x 14/62 = NO3-N/L and (mg NO2/L) x 14/48= NO2-N/L
11 Convert PO4 to P as follows….. ( mg PO4 /L) x 31/95 = mg PO4-P/L
12 EPR 7.01 is an Environment Agency guidance document, the UWWT Regulations (1994) or
UWWT Directive (1991) are the original legislation “Standards”, so better to cite one of
these.
13 Solids 100 mg/L limit given in EPR 7.01 relates to Water treatment plant discharges, not
Wastewater treatment plant effluent. Use UWWT Regulations (1991) value of 35 mg/L.
14 Which BOD and COD data should you use in calculations? Use the BOD sample dilutions that
give “at least 2 mg/L DO drop” with “at least 1 mg/L DO remaining” after 5d. For COD use
the sample volume that gives the most consumption of the dichromate (has smallest FAS
titration), but still has detectable dichromate remaining (i.e. titration is more than zero).
15 Figure legend goes below the figure, Table title goes above the table. Remove all text that
Excel may automatically place in the wrong position.
16 Label graph axes….. show units and the parameter name
17 Compare the removal efficiency (% removal) you observed with the typical removal that is
expected from the primary treatment stage
18 Compare the removal efficiency (% removal) you observed with the typical removal that is
expected from the secondary treatment stage
19 BOD incubation was for 3 or 4 days, and the BOD5 was estimated by calculation using the
kinetics equation BODt = UBOD (1 – e-kt)
20 Do not confuse the meaning of the word “Standard”. Use this word only when you mean a
statutory (legally required) threshold level of a parameter that MUST be achieved. “Typical
values” reported in text books are values or ranges that we tend to see for that parameter in
tabler-icon-diamond-filled.svg

Secure Best Marks with AI Grader

Need help grading? Try our AI Grader for instant feedback on your assignments.
Document Page
most WWT plants, i.e. they are “normal” or “expected” levels for that parameter in a well
performing treatment plant. There is no legal requirement to meet that “typical value”, so
they are not “Standards”.
chevron_up_icon
1 out of 2
circle_padding
hide_on_mobile
zoom_out_icon
logo.png

Your All-in-One AI-Powered Toolkit for Academic Success.

Available 24*7 on WhatsApp / Email

[object Object]