Change Detection and Homogeneity Analysis of Water Resources Data

Verified

Added on  2022/10/07

|7
|1219
|33
Report
AI Summary
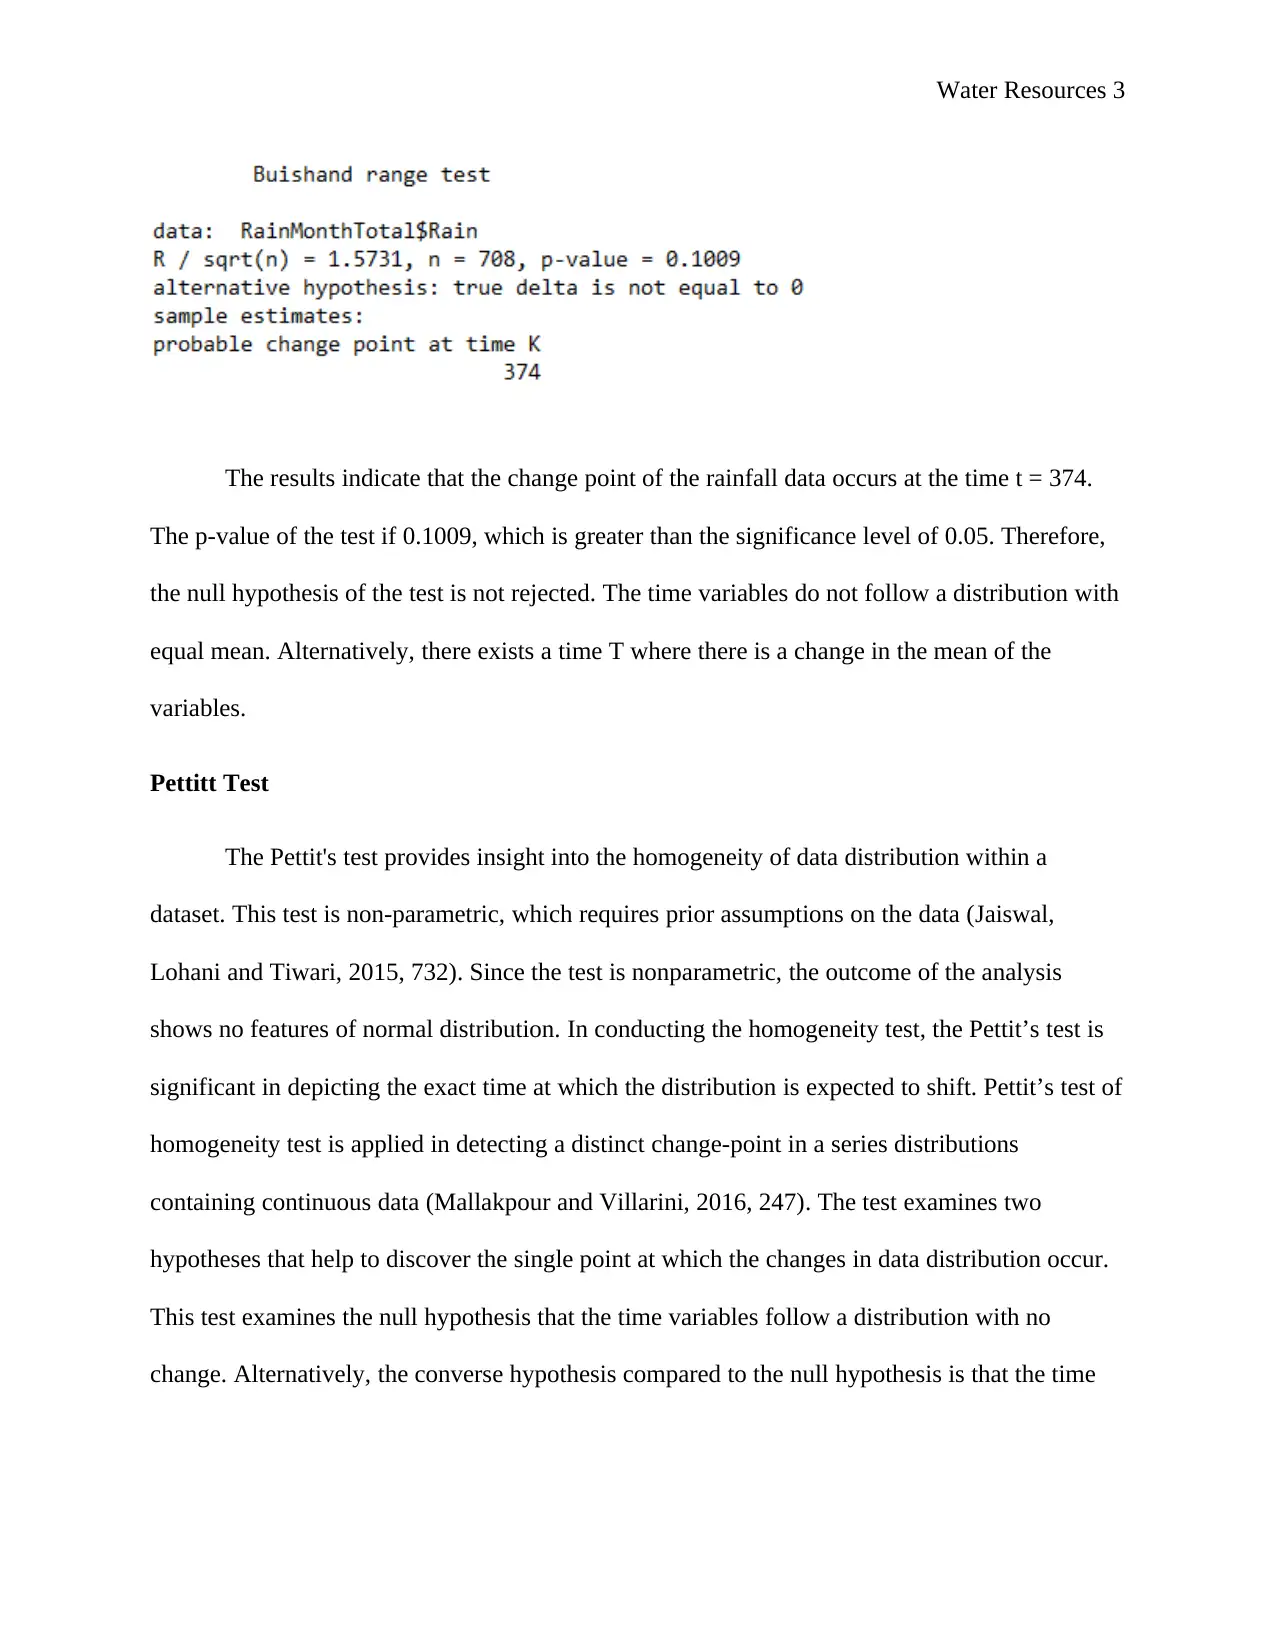
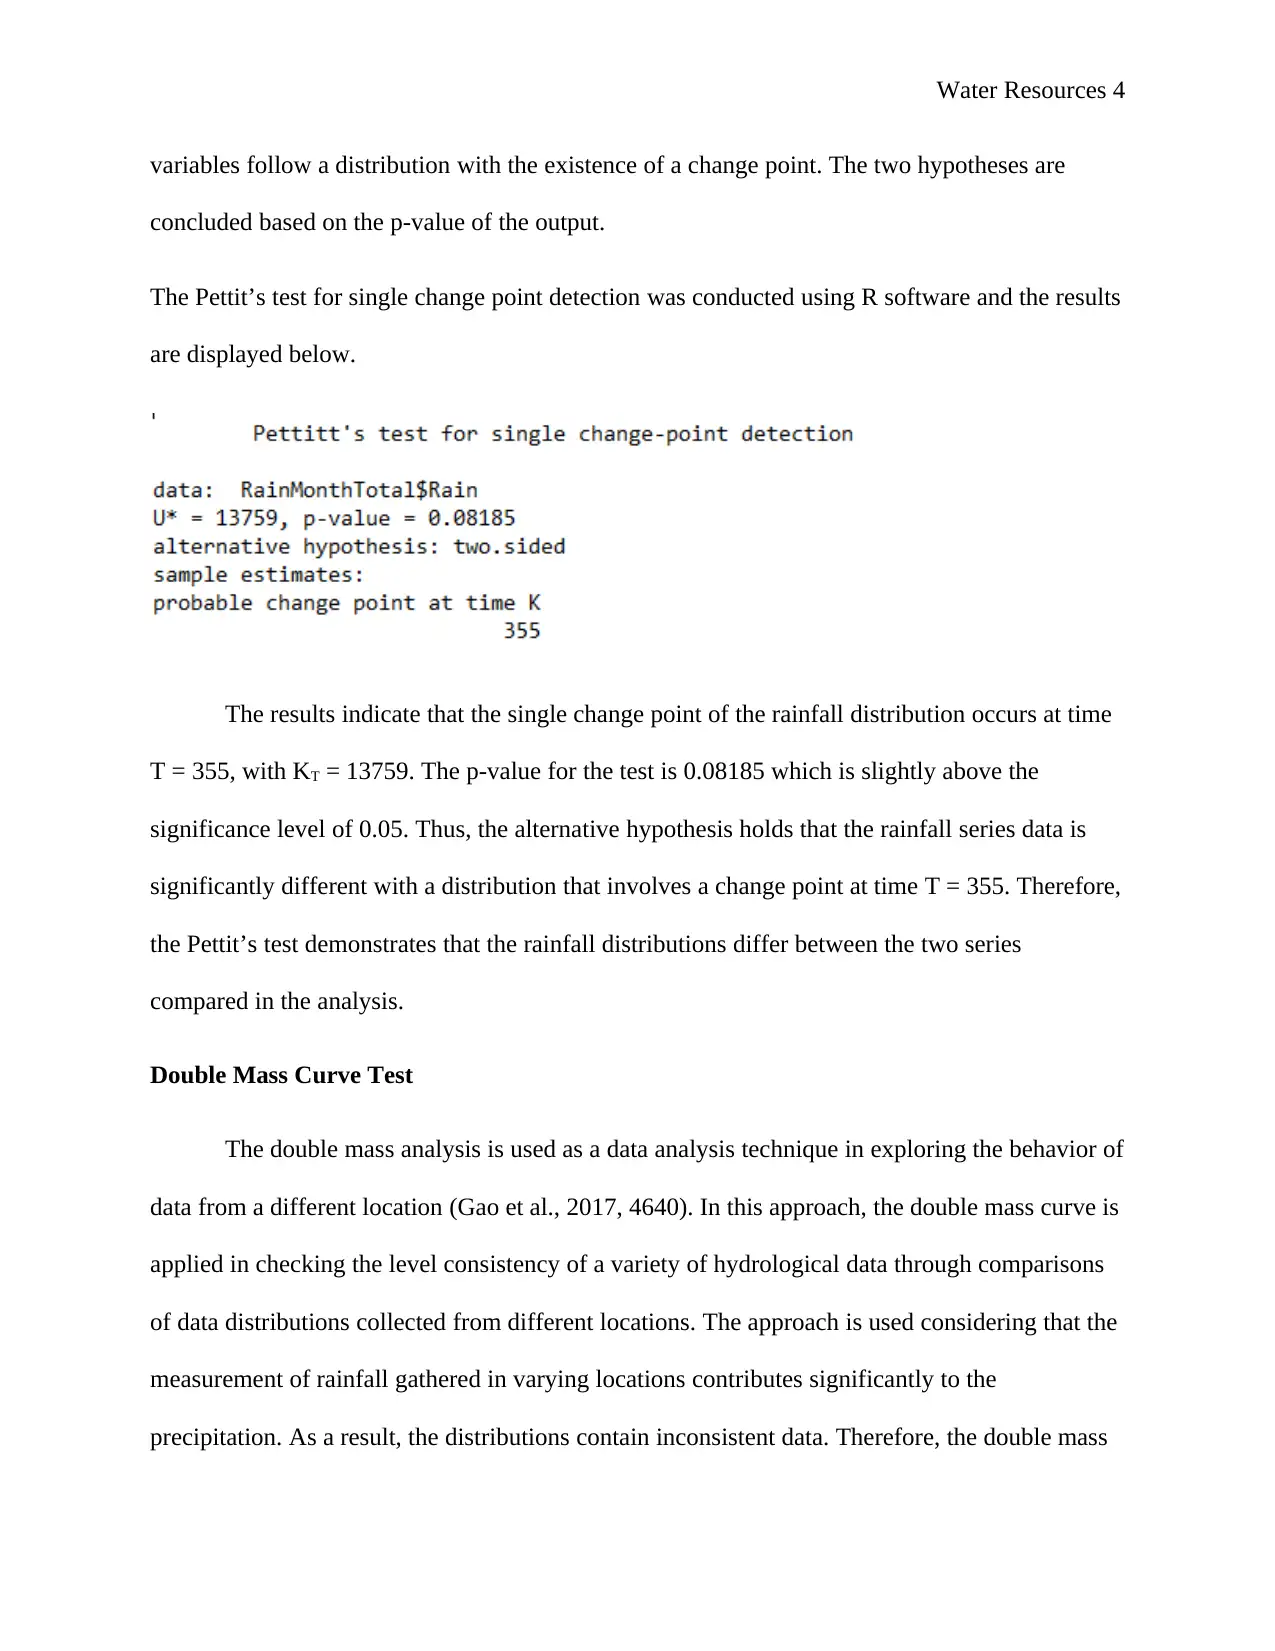
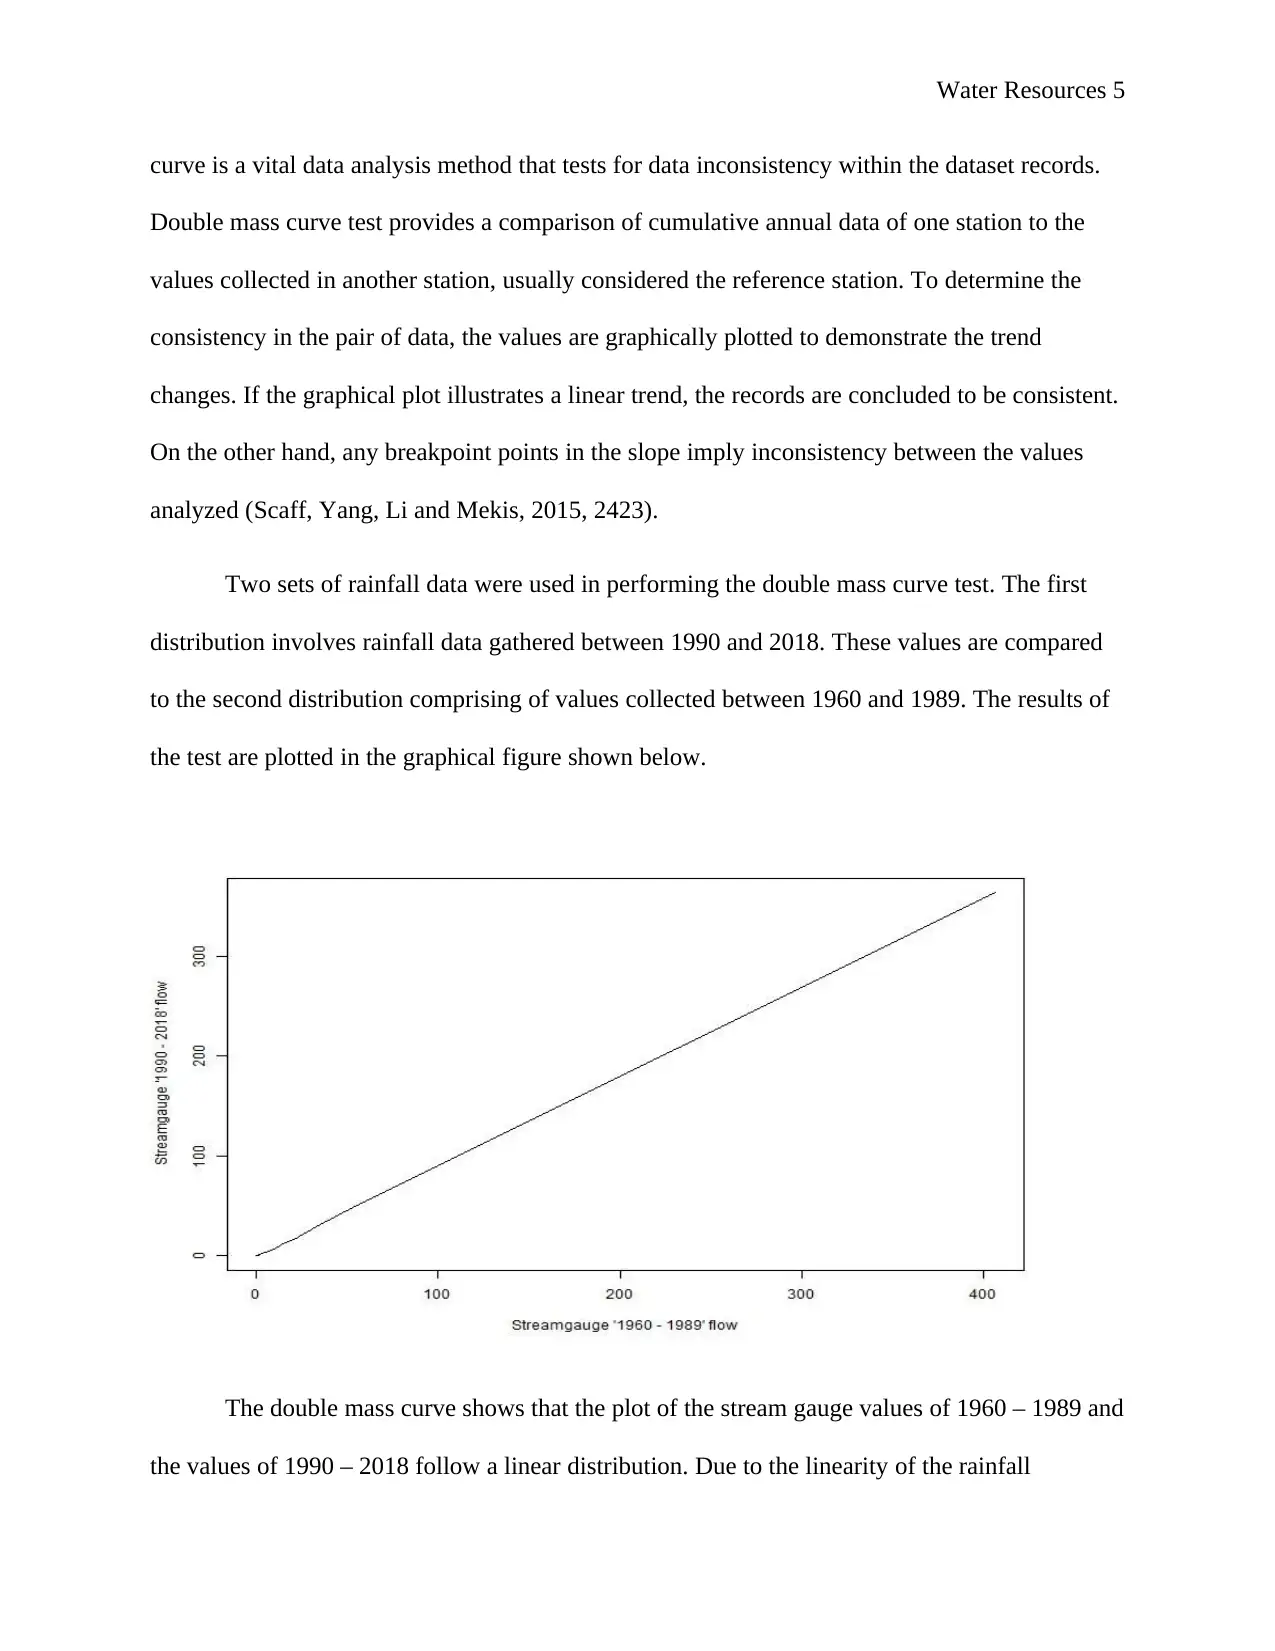
This report analyzes water resources, specifically focusing on rainfall data using three key statistical tests: the Buishand range test, the Pettitt test, and the double mass curve test. The Buishand test is employed to identify shifts in the distribution of the data, revealing a change point at time t=374, though the null hypothesis of equal means is not rejected at the 0.05 significance level. The Pettitt test, a non-parametric method, detects a significant change point in the rainfall distribution at time T=355, indicating a difference between the two series compared in the analysis. The double mass curve test assesses the consistency of rainfall data between two different periods (1960-1989 and 1990-2018), showing a linear trend and thus, consistent data. The report concludes that no adjustments are required for the rainfall distributions. References to relevant literature support the methodologies and findings.
Document Page
Water Resources 1
WATER RESOURCES
By Student Name
Course
Tutor
University
City and State
Date
tabler-icon-diamond-filled.svg

Secure Best Marks with AI Grader

Need help grading? Try our AI Grader for instant feedback on your assignments.
Document Page
Water Resources 2
Water Resources
Buishand Test
Buishand range test is usually applied on variables with any form of distribution
(Khosravi et al., 2017, 78). The test is based on the partial sum, which fluctuates between the
highest and lowest values. With the values reaching a maximum value, the distribution is
considered to indicate a negative shift. On the other hand, the lowest values are used to indicate a
positive shift in the distribution. In performing the Buishand range test, the adjusted partial sum
indicates the deviation of the dataset values from the mean. The cumulative partial sum is critical
in determining the homogeneity of the distribution. A cumulative partial sum of zero implies that
distribution is homogenous because the deviation of values in the random series deviates from
the mean with equal distribution (Agha, Bağçacı, and Şarlak, 2017, 60). Importantly, the
significance of the deviation is assessed by calculating the rescales adjusted range based on the
equation below.
Rescales adjusted range, R = maximum sum-minimum sum
mean
The calculated value of R/√n is related to the series values to identify possible variations in the
values of the series distribution.
The results of the Buishand range test are displayed below.
Document Page
Water Resources 3
The results indicate that the change point of the rainfall data occurs at the time t = 374.
The p-value of the test if 0.1009, which is greater than the significance level of 0.05. Therefore,
the null hypothesis of the test is not rejected. The time variables do not follow a distribution with
equal mean. Alternatively, there exists a time T where there is a change in the mean of the
variables.
Pettitt Test
The Pettit's test provides insight into the homogeneity of data distribution within a
dataset. This test is non-parametric, which requires prior assumptions on the data (Jaiswal,
Lohani and Tiwari, 2015, 732). Since the test is nonparametric, the outcome of the analysis
shows no features of normal distribution. In conducting the homogeneity test, the Pettit’s test is
significant in depicting the exact time at which the distribution is expected to shift. Pettit’s test of
homogeneity test is applied in detecting a distinct change-point in a series distributions
containing continuous data (Mallakpour and Villarini, 2016, 247). The test examines two
hypotheses that help to discover the single point at which the changes in data distribution occur.
This test examines the null hypothesis that the time variables follow a distribution with no
change. Alternatively, the converse hypothesis compared to the null hypothesis is that the time
Document Page
Water Resources 4
variables follow a distribution with the existence of a change point. The two hypotheses are
concluded based on the p-value of the output.
The Pettit’s test for single change point detection was conducted using R software and the results
are displayed below.
The results indicate that the single change point of the rainfall distribution occurs at time
T = 355, with KT = 13759. The p-value for the test is 0.08185 which is slightly above the
significance level of 0.05. Thus, the alternative hypothesis holds that the rainfall series data is
significantly different with a distribution that involves a change point at time T = 355. Therefore,
the Pettit’s test demonstrates that the rainfall distributions differ between the two series
compared in the analysis.
Double Mass Curve Test
The double mass analysis is used as a data analysis technique in exploring the behavior of
data from a different location (Gao et al., 2017, 4640). In this approach, the double mass curve is
applied in checking the level consistency of a variety of hydrological data through comparisons
of data distributions collected from different locations. The approach is used considering that the
measurement of rainfall gathered in varying locations contributes significantly to the
precipitation. As a result, the distributions contain inconsistent data. Therefore, the double mass
tabler-icon-diamond-filled.svg

Secure Best Marks with AI Grader

Need help grading? Try our AI Grader for instant feedback on your assignments.
Document Page
Water Resources 5
curve is a vital data analysis method that tests for data inconsistency within the dataset records.
Double mass curve test provides a comparison of cumulative annual data of one station to the
values collected in another station, usually considered the reference station. To determine the
consistency in the pair of data, the values are graphically plotted to demonstrate the trend
changes. If the graphical plot illustrates a linear trend, the records are concluded to be consistent.
On the other hand, any breakpoint points in the slope imply inconsistency between the values
analyzed (Scaff, Yang, Li and Mekis, 2015, 2423).
Two sets of rainfall data were used in performing the double mass curve test. The first
distribution involves rainfall data gathered between 1990 and 2018. These values are compared
to the second distribution comprising of values collected between 1960 and 1989. The results of
the test are plotted in the graphical figure shown below.
The double mass curve shows that the plot of the stream gauge values of 1960 – 1989 and
the values of 1990 – 2018 follow a linear distribution. Due to the linearity of the rainfall
Document Page
Water Resources 6
distributions on the double mass curve, it is evident that the 1990 – 2018 rainfall data are
consistent with the rainfall values of 1960-1989. Therefore, no adjustments are required for the
pair of rainfall distributions.
Document Page
Water Resources 7
References
Agha, O.M.A.M., Bağçacı, S.Ç. and Şarlak, N., 2017. Homogeneity analysis of precipitation
series in North Iraq. IOSR Journal of Applied Geology and Geophysics, 5(03), pp.57-63.
Gao, P., Li, P., Zhao, B., Xu, R., Zhao, G., Sun, W. and Mu, X., 2017. Use of double mass
curves in hydrologic benefit evaluations. Hydrological processes, 31(26), pp.4639-4646.
Jaiswal, R.K., Lohani, A.K. and Tiwari, H.L., 2015. Statistical analysis for change detection and
trend assessment in climatological parameters. Environmental Processes, 2(4), pp.729-
749.
Khosravi, H., Sajedi Hosseini, F., Nasrollahi, M., Gharechaee, H., 2017. Trend analysis and
detection of precipitation fluctuations in arid and semi-arid regions. Desert, 22(1), pp. 77-
84. DOI: 10.22059/jdesert.2017.62173
Mallakpour, I. and Villarini, G., 2016. A simulation study to examine the sensitivity of the Pettitt
test to detect abrupt changes in mean. Hydrological Sciences Journal, 61(2), pp.245-254.
Scaff, L., Yang, D., Li, Y. and Mekis, E., 2015. Inconsistency in precipitation measurements
across the Alaska–Yukon border. The Cryosphere, 9(6), pp.2417-2428.
chevron_up_icon
1 out of 7
circle_padding
hide_on_mobile
zoom_out_icon
logo.png

Your All-in-One AI-Powered Toolkit for Academic Success.

Available 24*7 on WhatsApp / Email

[object Object]