Analysis of Rainfall Data Homogeneity in Water Resources

Verified

Added on  2023/01/11

|8
|1264
|77
Report
AI Summary
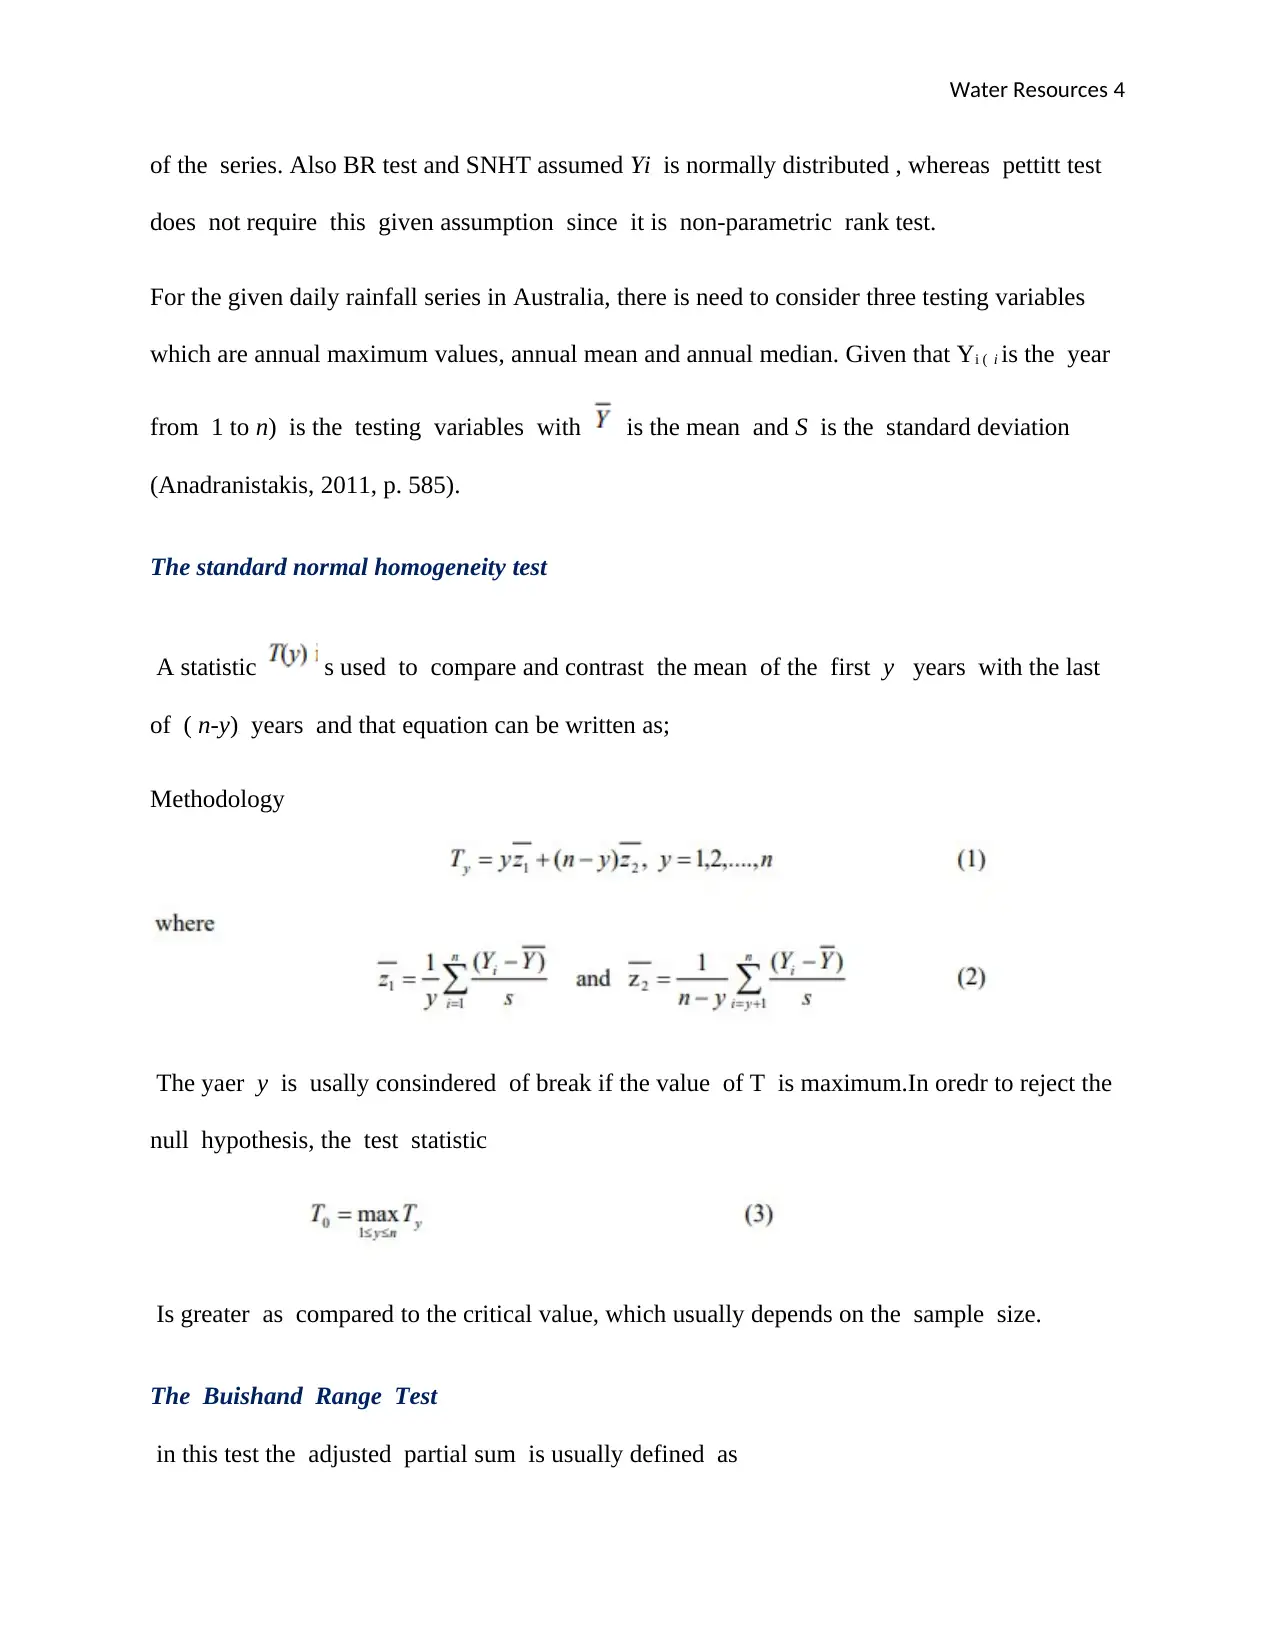
This report focuses on the homogeneity analysis of rainfall time series, a crucial aspect of water resources management and environmental engineering. It begins by acknowledging the importance of data quality in various applications, such as flood modeling and climate change studies. The report then delves into a comprehensive literature review, exploring statistical methods used to assess data homogeneity. These methods include the Standard Normal Homogeneity Test (SNHT), the Buishand Range Test, the Pettitt Test, and the Von Neumann Ratio test. The methodology section outlines how these tests are applied to detect inhomogeneities in precipitation records. The report also discusses various techniques for addressing these issues, such as the Multiple Analysis of Series for Homogenization (MASH) and the use of homogenization software. The conclusion emphasizes the significance of these methods in ensuring the accuracy and reliability of long-term climate data, which is essential for understanding climate variability and change.
tabler-icon-diamond-filled.svg

Contribute Materials

Your contribution can guide someone’s learning journey. Share your documents today.
Document Page
Water Resources 1
WATER RESOURCES
By Name
Course
Instructor
Institution
Location
Date
tabler-icon-diamond-filled.svg

Secure Best Marks with AI Grader

Need help grading? Try our AI Grader for instant feedback on your assignments.
Document Page
Water Resources 2
The Homogeneity Analysis of Rainfall Time series for selected Meteorological Stations in
Australia
Table of Contents
Introduction......................................................................................................................................2
Literature review..............................................................................................................................3
Statistical methods...........................................................................................................................3
The standard normal homogeneity test............................................................................................4
The Buishand Range Test.............................................................................................................4
Pettitt Test........................................................................................................................................5
Von Neumann Ratio test..................................................................................................................5
Methodology....................................................................................................................................6
Conclusion.......................................................................................................................................7
References........................................................................................................................................8
Document Page
Water Resources 3
Introduction
The accuracy and reliability of floods, drought modelling and climate change, determination
of rainfall-runoff relationships , water resources and the river flow estimation models vary
depending on the quality of data used. The factors such as data collection techniques, methods
of gauging and data measurement approaches has a great impact on the homogeneous
precipitation records. Due to that there is need to test ad check data of all the data recorded at
the gauging stations for the purpose of reliability and homogeneity before they are used in
research studies (AL-Timimi, 2014, p. 4).
Literature review
Statistical methods
Four tests are used to test the homogeneity of the rainfall data. The standard normal homogeneity
of the rainfall data. The Buishand range (BR) test, Standard normal homogeneity test (SNHT),
Von Neumann ratio and Pettitt test are selected. Under nu;; hypothesis , the yearly values Yi of
the testing variables Y are independent and they are usually identically distributed and the
series among them are considered as being homogeneous. In the meantime under the alternative
hypothesis, SNHT, pettitt test and BR test assume the series consisted of break in the average
considered as being inhomogeneous. The three tests mentioned above have the ability to detect
the year where the break occurs (WANG, 2009, p. 2418). While the VNR test does not have the
ability to give data on the year where the break occurs, this is because the test assume the
series is not randomly distributed under the alternative hypothesis.
There are clear differences which exists between BR test, Pettitt test and SNHT. The SNHT is
the most sensitive in detecting the breaks which occurs near the beginning and the at the end
Document Page
Water Resources 4
of the series. Also BR test and SNHT assumed Yi is normally distributed , whereas pettitt test
does not require this given assumption since it is non-parametric rank test.
For the given daily rainfall series in Australia, there is need to consider three testing variables
which are annual maximum values, annual mean and annual median. Given that Yi ( i is the year
from 1 to n) is the testing variables with is the mean and S is the standard deviation
(Anadranistakis, 2011, p. 585).
The standard normal homogeneity test
A statistic s used to compare and contrast the mean of the first y years with the last
of ( n-y) years and that equation can be written as;
Methodology
The yaer y is usally consindered of break if the value of T is maximum.In oredr to reject the
null hypothesis, the test statistic
Is greater as compared to the critical value, which usually depends on the sample size.
The Buishand Range Test
in this test the adjusted partial sum is usually defined as
tabler-icon-diamond-filled.svg

Secure Best Marks with AI Grader

Need help grading? Try our AI Grader for instant feedback on your assignments.
Document Page
Water Resources 5
Whereby the series is normally homogeneous, then the value of will fall and rise around
the zero. Year y has the break when has reached the maximum or the minimum. Recalled
and adjusted range, R is usually obtained by
The is then comaperd with the critical values which are given by the Buishand.
Pettitt Test
This type of a test is based on the rank, ri of the Yi and it ignores the normallity of the
series.
The value is then compared with the critical value by the pettitt
Von Neumann Ratio test
This test uses the ratio of the mean square successive ( year to year) difference to the
variance .The test statistic is as shown below;
Document Page
Water Resources 6
In the scenario where the sample of the series is homogeneous, then the expected value. When
the sample has a break, in that case the value of N must be below 2, else it can imply that the
sample had fast variations in the mean.
Methodology
In this given study three methods were used in detecting and addressing the inhomogeneity in
the precipitation series. The first approach used is the Multiple analysis of series for the
homogenization (MASH)This is a relative homogenization technique which is based on the
multiple comparison s between the climatically similar time series and it does not assume
homogeneous reference series. The time step of the comparisons may be monthly, annually
or even seasonal and the break point detection is usually based on the hypothesis test for a
given essential level (Pohlert, 2018, p. 10).
The second technique used for this study is homogenization software (HOMER). This is a new
relative technique for homogenizing monthly and annual temperature and precipitation data. It
was developed in the frame of the European COST Action ES0601 called HOME, devoted to
evaluate the performance of homogenization methods used in climatology. It incorporates the
best characteristics of some other methods such as PRODIGE ACMANT and CLIMATOL that
performed good results in benchmark.
The third test is the randomness test which test the randomness in the hydrological data series
which arises due to the natural reasons. The randomness test is summarized in calculating the
Document Page
Water Resources 7
data series median. Each of the data item is usually examined whether it exceeds the median. In
the situations where the data exceeds the median, then it is considered to be a success case,
otherwise it can be considered to be a failed case. The scenarios where the data is exactly equal
to the median are excluded and labelled n1 and n2 shall be counted. The value of r which is
obtained by summing up n1 and n2 shall be calculated (Browning, 2017, p. 7).
Conclusion
In conclusion, due to the increased interests regarding to the climate variability and change ,
many methods have been invented to deal with the inhomogeneity problems of the long term
climate series, because these series reflects the actual changes of climate and offers precise
data regarding to climate evolution.
References
tabler-icon-diamond-filled.svg

Paraphrase This Document

Need a fresh take? Get an instant paraphrase of this document with our AI Paraphraser
Document Page
Water Resources 8
AL-Timimi, Y. K., 2014. The Homogeneity Analysis of Rainfall Time Series for Selected
Meteorological Stations in Iraq. 1st ed. Baghdad: Springer Science & Business Media.
Anadranistakis, M., 2011. Homogenization of Precipitation Series in Greece. 1st ed. Athens:
Athens Meteorological Society..
Browning, J., 2017. Standard Normal Homogeneity Test. 3rd ed. sydney: CRAN.
Pohlert, T., 2018. Non-Parametric Trend Tests and Change-Point Detection. 5th ed. Perth:
Bureau of Meteorology.
WANG, X. L., 2009. New Techniques for the Detection and Adjustment of Shifts in Daily
Precipitation Data Series. 3rd ed. Ontario: Springer,.
chevron_up_icon
1 out of 8
circle_padding
hide_on_mobile
zoom_out_icon
logo.png

Your All-in-One AI-Powered Toolkit for Academic Success.

Available 24*7 on WhatsApp / Email

[object Object]