Comprehensive Lab Report: Water Treatment and Quality Analysis

Verified

Added on  2020/04/01

|7
|923
|457
Report
AI Summary
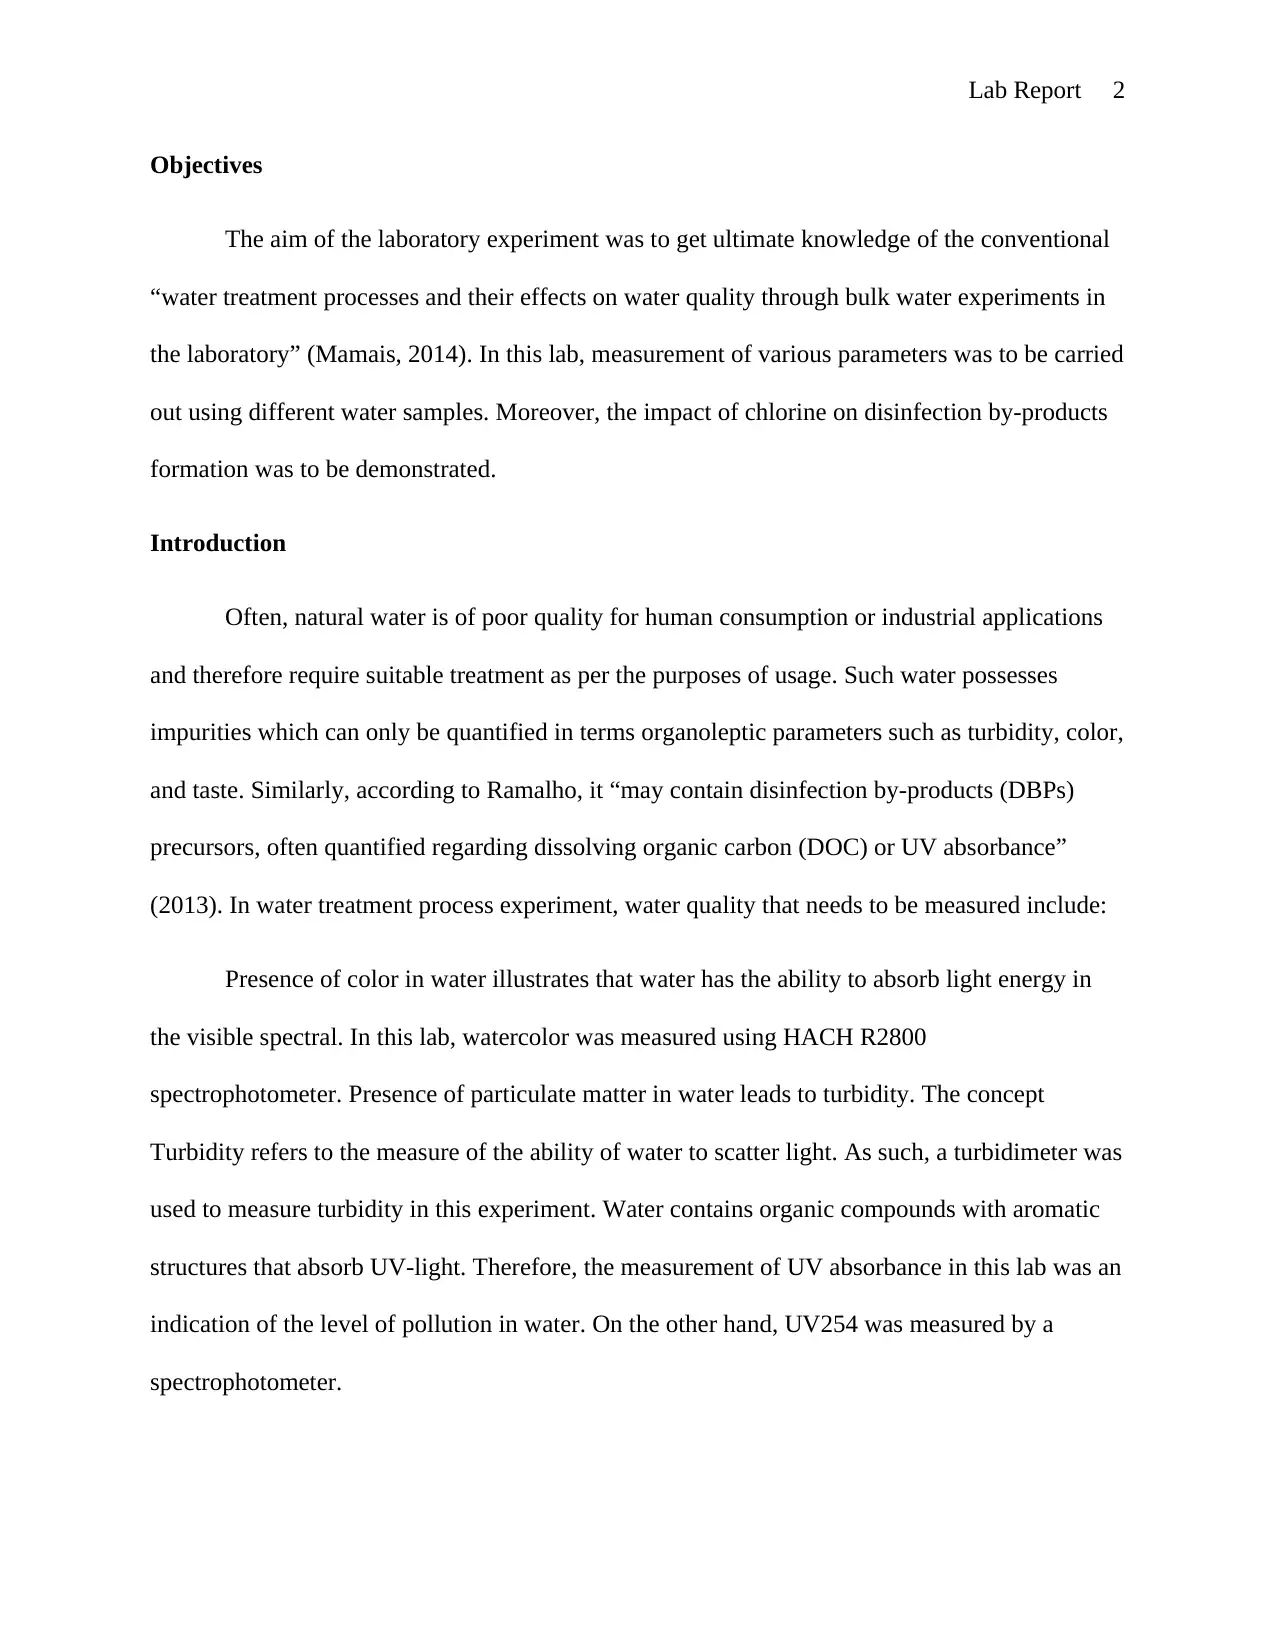
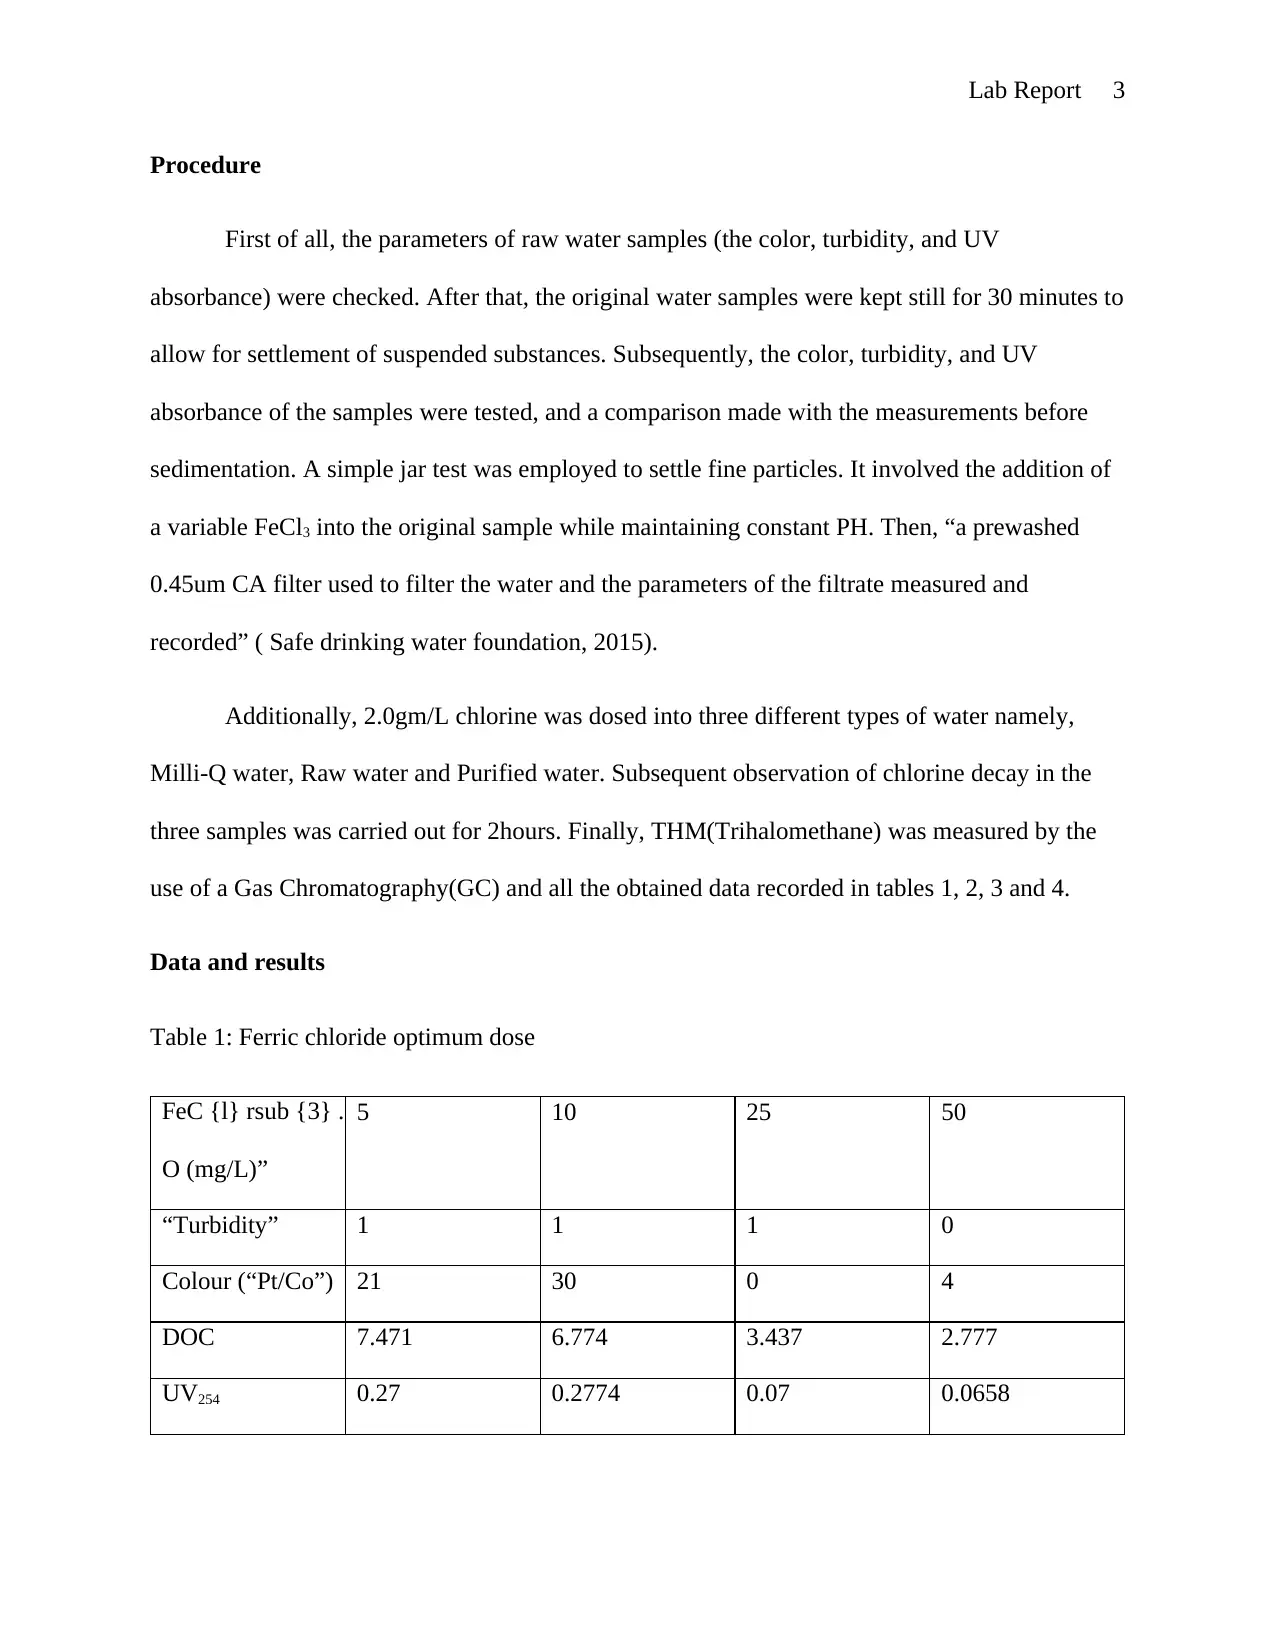
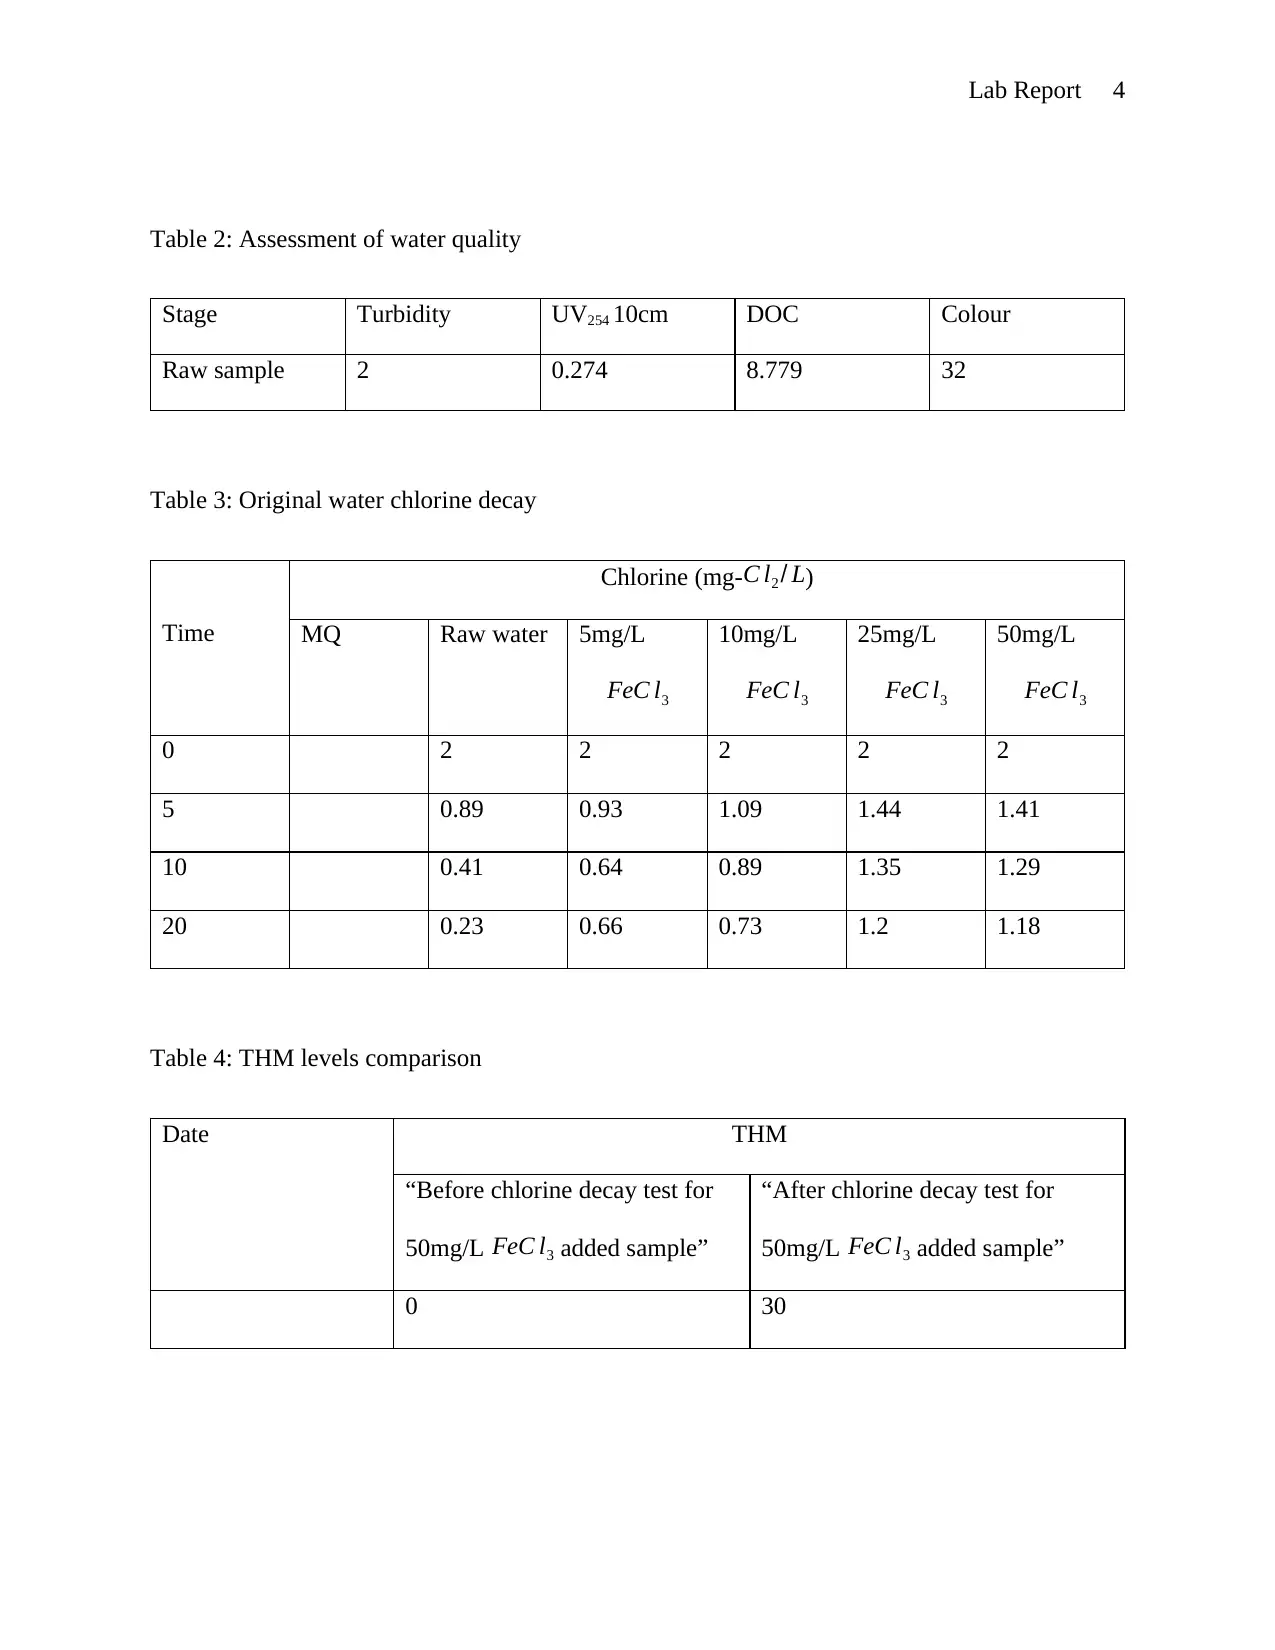
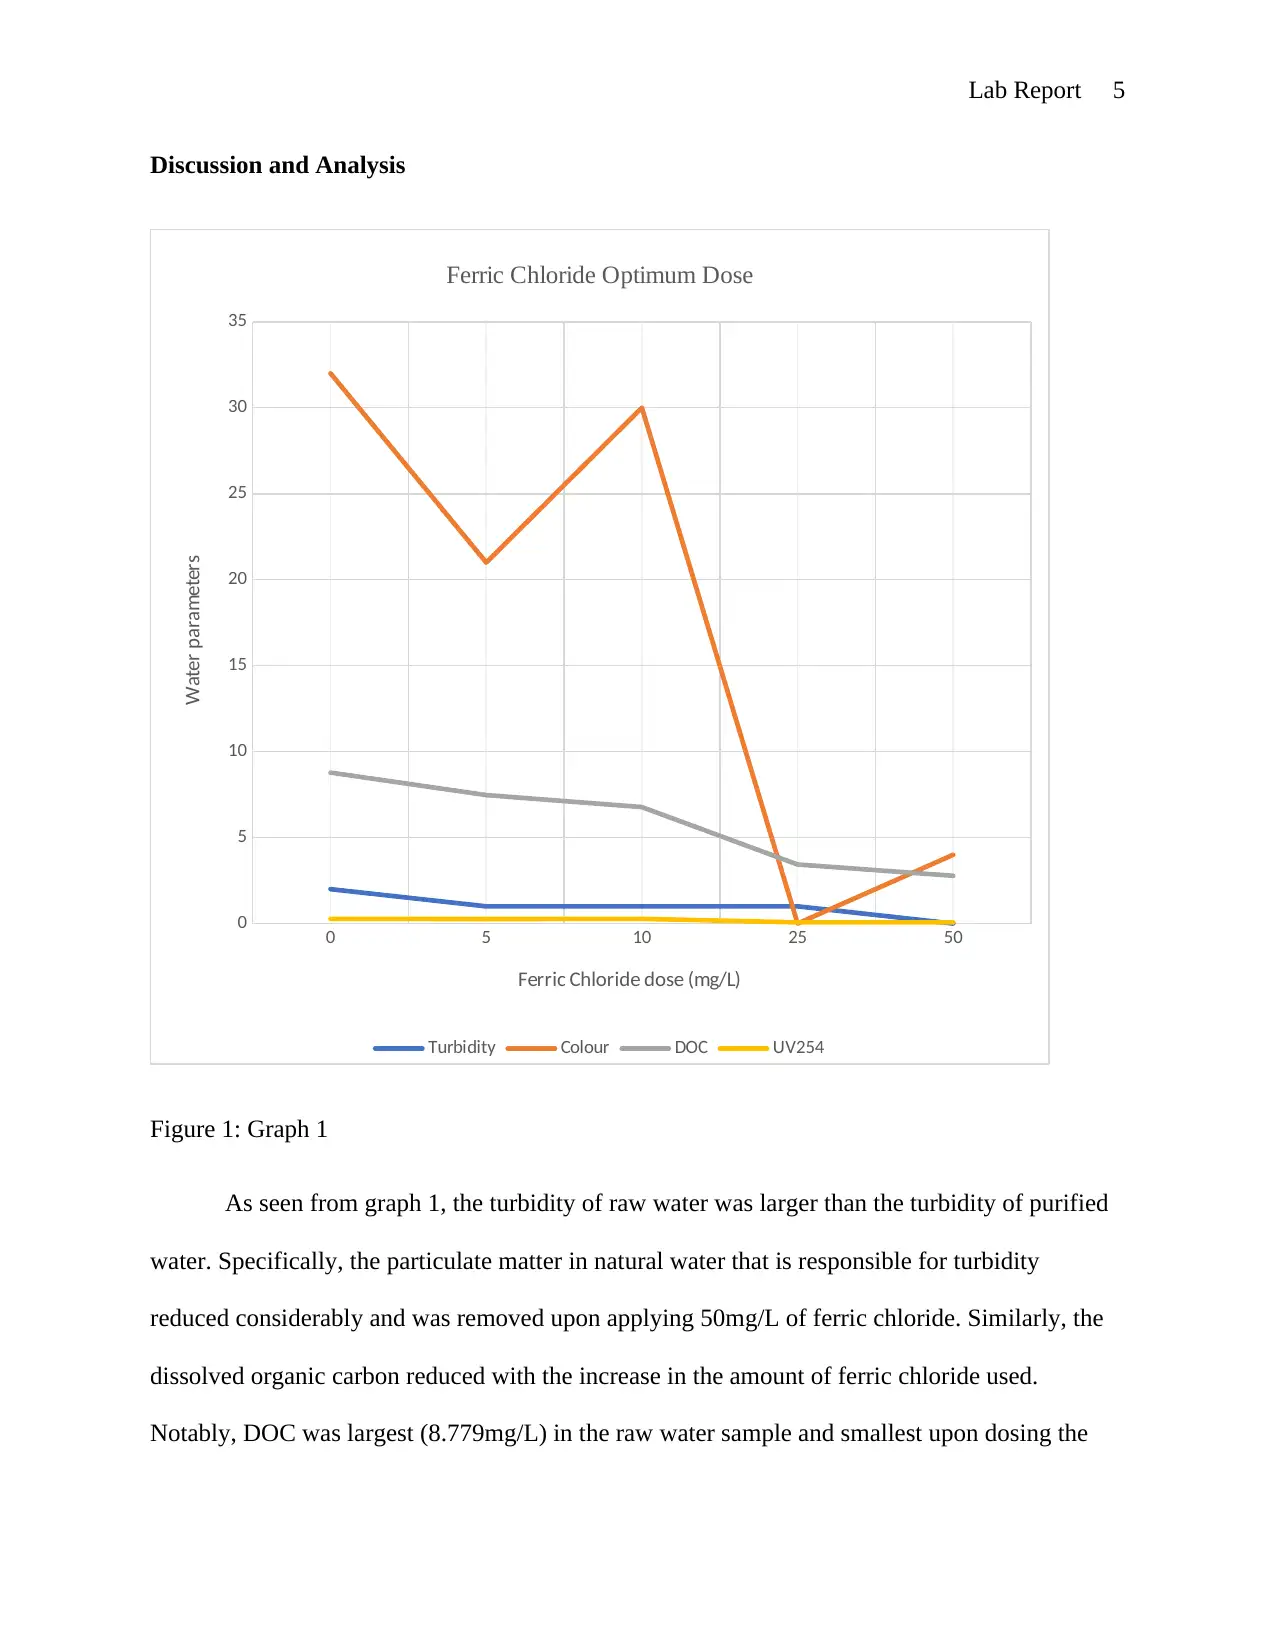
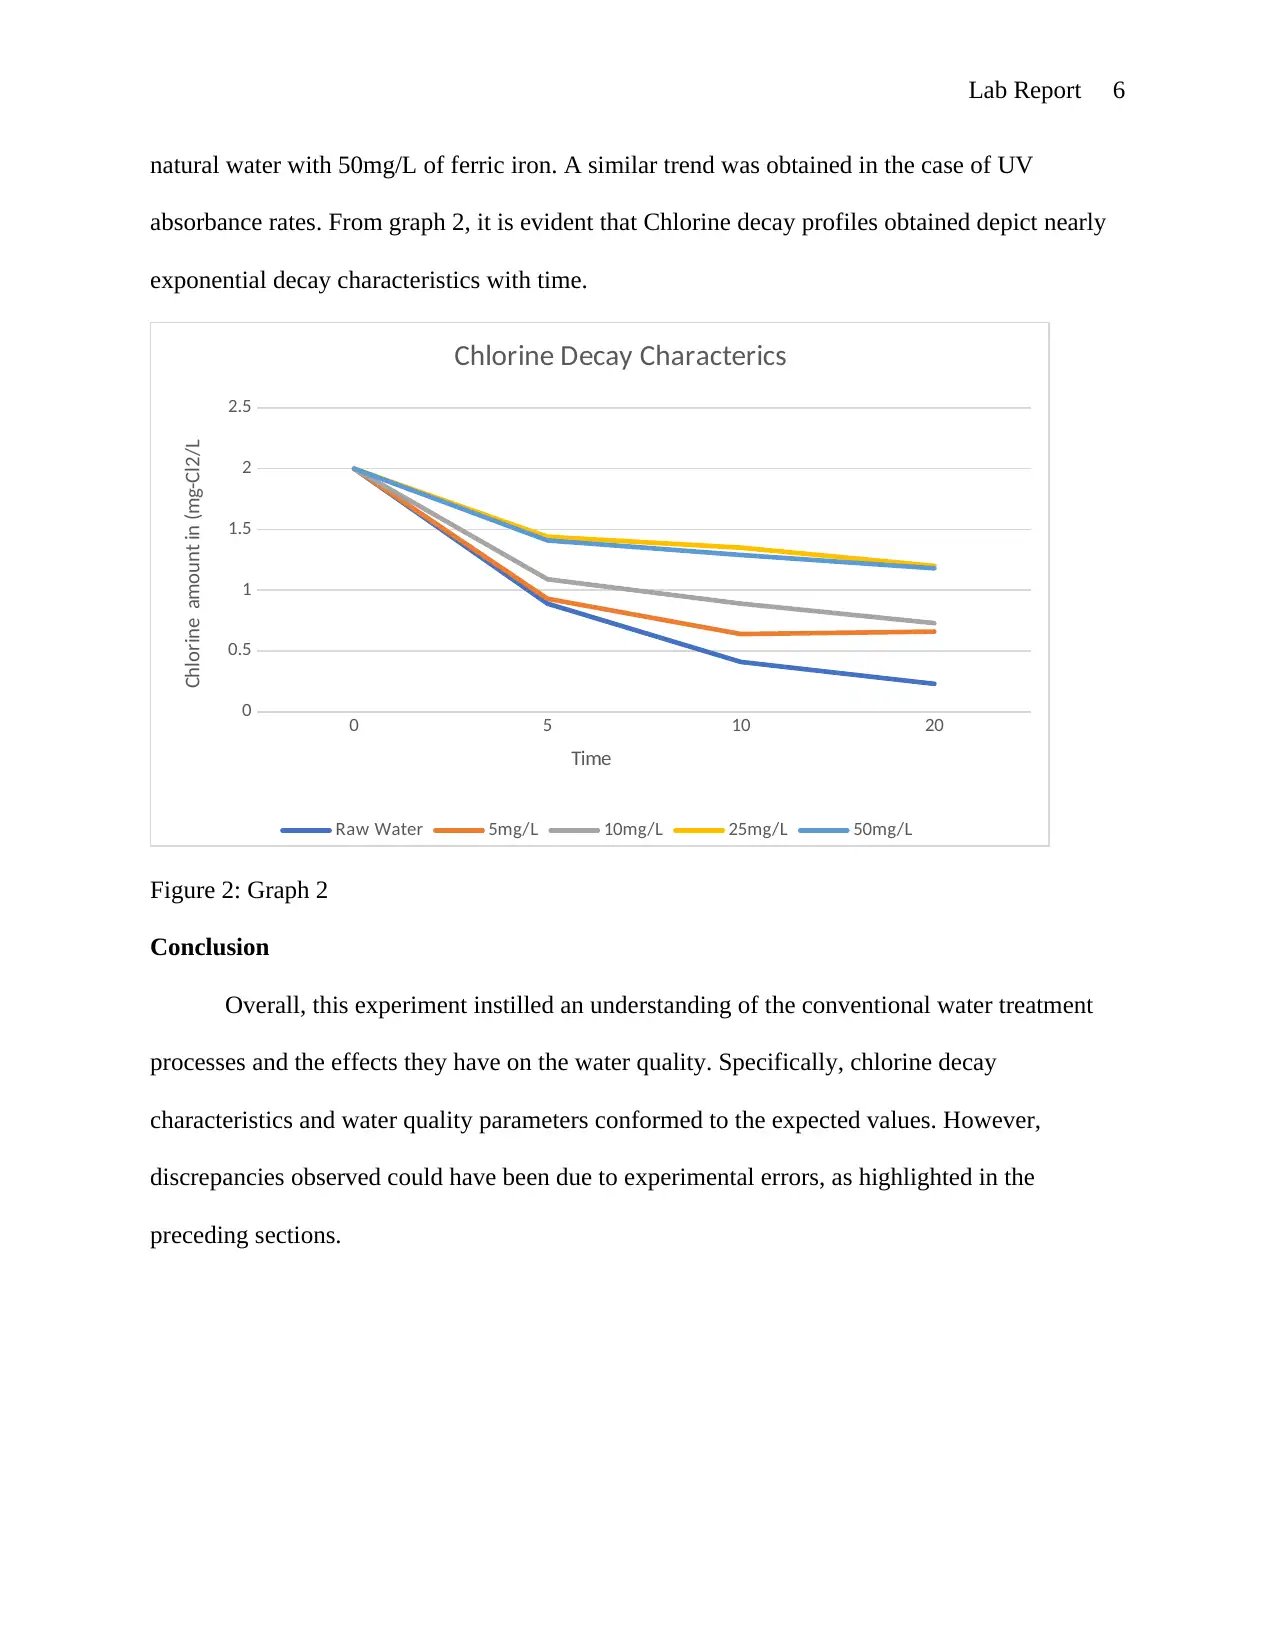
This lab report details an experiment on conventional water treatment processes and their effects on water quality. The objectives included understanding the measurement of various water parameters like turbidity, color, and UV absorbance, and demonstrating the impact of chlorine on disinfection by-products formation. The experiment involved measuring these parameters in raw water samples, after sedimentation, and after treatment with ferric chloride. Chlorine decay was observed in Milli-Q, raw, and purified water samples. The results, including the optimal dose of ferric chloride, water quality assessments at different stages, chlorine decay profiles, and THM levels, are presented in tables and graphs. The discussion analyzes the data, highlighting the reduction in turbidity and DOC with ferric chloride treatment, and the exponential chlorine decay. The report concludes with an understanding of water treatment processes and the effects on water quality, with discrepancies potentially due to experimental errors. The report references relevant literature on water treatment processes.
Document Page
Lab Report 1
LAB REPORT 2
Student’s Name
Course
Professor’s Name
University
City (State)
Date
tabler-icon-diamond-filled.svg

Paraphrase This Document

Need a fresh take? Get an instant paraphrase of this document with our AI Paraphraser
Document Page
Lab Report 2
Objectives
The aim of the laboratory experiment was to get ultimate knowledge of the conventional
“water treatment processes and their effects on water quality through bulk water experiments in
the laboratory” (Mamais, 2014). In this lab, measurement of various parameters was to be carried
out using different water samples. Moreover, the impact of chlorine on disinfection by-products
formation was to be demonstrated.
Introduction
Often, natural water is of poor quality for human consumption or industrial applications
and therefore require suitable treatment as per the purposes of usage. Such water possesses
impurities which can only be quantified in terms organoleptic parameters such as turbidity, color,
and taste. Similarly, according to Ramalho, it “may contain disinfection by-products (DBPs)
precursors, often quantified regarding dissolving organic carbon (DOC) or UV absorbance”
(2013). In water treatment process experiment, water quality that needs to be measured include:
Presence of color in water illustrates that water has the ability to absorb light energy in
the visible spectral. In this lab, watercolor was measured using HACH R2800
spectrophotometer. Presence of particulate matter in water leads to turbidity. The concept
Turbidity refers to the measure of the ability of water to scatter light. As such, a turbidimeter was
used to measure turbidity in this experiment. Water contains organic compounds with aromatic
structures that absorb UV-light. Therefore, the measurement of UV absorbance in this lab was an
indication of the level of pollution in water. On the other hand, UV254 was measured by a
spectrophotometer.
Document Page
Lab Report 3
Procedure
First of all, the parameters of raw water samples (the color, turbidity, and UV
absorbance) were checked. After that, the original water samples were kept still for 30 minutes to
allow for settlement of suspended substances. Subsequently, the color, turbidity, and UV
absorbance of the samples were tested, and a comparison made with the measurements before
sedimentation. A simple jar test was employed to settle fine particles. It involved the addition of
a variable FeCl3 into the original sample while maintaining constant PH. Then, “a prewashed
0.45um CA filter used to filter the water and the parameters of the filtrate measured and
recorded” ( Safe drinking water foundation, 2015).
Additionally, 2.0gm/L chlorine was dosed into three different types of water namely,
Milli-Q water, Raw water and Purified water. Subsequent observation of chlorine decay in the
three samples was carried out for 2hours. Finally, THM(Trihalomethane) was measured by the
use of a Gas Chromatography(GC) and all the obtained data recorded in tables 1, 2, 3 and 4.
Data and results
Table 1: Ferric chloride optimum dose
FeC {l} rsub {3} .6 {H} rsub {2
O (mg/L)”
5 10 25 50
“Turbidity 1 1 1 0
Colour (“Pt/Co”) 21 30 0 4
DOC 7.471 6.774 3.437 2.777
UV254 0.27 0.2774 0.07 0.0658
Document Page
Lab Report 4
Table 2: Assessment of water quality
Stage Turbidity UV254 10cm DOC Colour
Raw sample 2 0.274 8.779 32
Table 3: Original water chlorine decay
Time
Chlorine (mg-C l2 / L)
MQ Raw water 5mg/L
FeC l3
10mg/L
FeC l3
25mg/L
FeC l3
50mg/L
FeC l3
0 2 2 2 2 2
5 0.89 0.93 1.09 1.44 1.41
10 0.41 0.64 0.89 1.35 1.29
20 0.23 0.66 0.73 1.2 1.18
Table 4: THM levels comparison
Date THM
“Before chlorine decay test for
50mg/L FeC l3 added sample”
“After chlorine decay test for
50mg/L FeC l3 added sample”
0 30
tabler-icon-diamond-filled.svg

Paraphrase This Document

Need a fresh take? Get an instant paraphrase of this document with our AI Paraphraser
Document Page
Lab Report 5
Discussion and Analysis
Figure 1: Graph 1
As seen from graph 1, the turbidity of raw water was larger than the turbidity of purified
water. Specifically, the particulate matter in natural water that is responsible for turbidity
reduced considerably and was removed upon applying 50mg/L of ferric chloride. Similarly, the
dissolved organic carbon reduced with the increase in the amount of ferric chloride used.
Notably, DOC was largest (8.779mg/L) in the raw water sample and smallest upon dosing the
0 5 10 25 50
0
5
10
15
20
25
30
35
Ferric Chloride Optimum Dose
Turbidity Colour DOC UV254
Ferric Chloride dose (mg/L)
Water parameters
Document Page
Lab Report 6
natural water with 50mg/L of ferric iron. A similar trend was obtained in the case of UV
absorbance rates. From graph 2, it is evident that Chlorine decay profiles obtained depict nearly
exponential decay characteristics with time.
0 5 10 20
0
0.5
1
1.5
2
2.5
Chlorine Decay Characterics
Raw Water 5mg/L 10mg/L 25mg/L 50mg/L
Time
Chlorine amount in (mg-Cl2/L
Figure 2: Graph 2
Conclusion
Overall, this experiment instilled an understanding of the conventional water treatment
processes and the effects they have on the water quality. Specifically, chlorine decay
characteristics and water quality parameters conformed to the expected values. However,
discrepancies observed could have been due to experimental errors, as highlighted in the
preceding sections.
Document Page
Lab Report 7
References
Ramalho , R.S. 2013. Science Direct. [Online]. [23 September 2017]. Available from:
http://www.sciencedirect.com/science/book/9780080925332
Mamais, D. 2014. HAMBURG WATER Cycle®. [Online]. [23 September 2017]. Available from:
http://www.hamburgwatercycle.de/en/new-methods/conventional-wastewater-treatment/
Safe drinking water foundation. 2015. Conventional Water Treatment: Coagulation and
Filtration. [Online]. [23 September 2017]. Available from:
https://www.safewater.org/fact-sheets-1/2017/1/23/conventional-water-treatment
chevron_up_icon
1 out of 7
circle_padding
hide_on_mobile
zoom_out_icon