CS5308: Water and Wastewater Engineering Tutorial 5 & 6 Solutions

Verified

Added on  2022/09/09

|13
|1393
|18
Homework Assignment
AI Summary
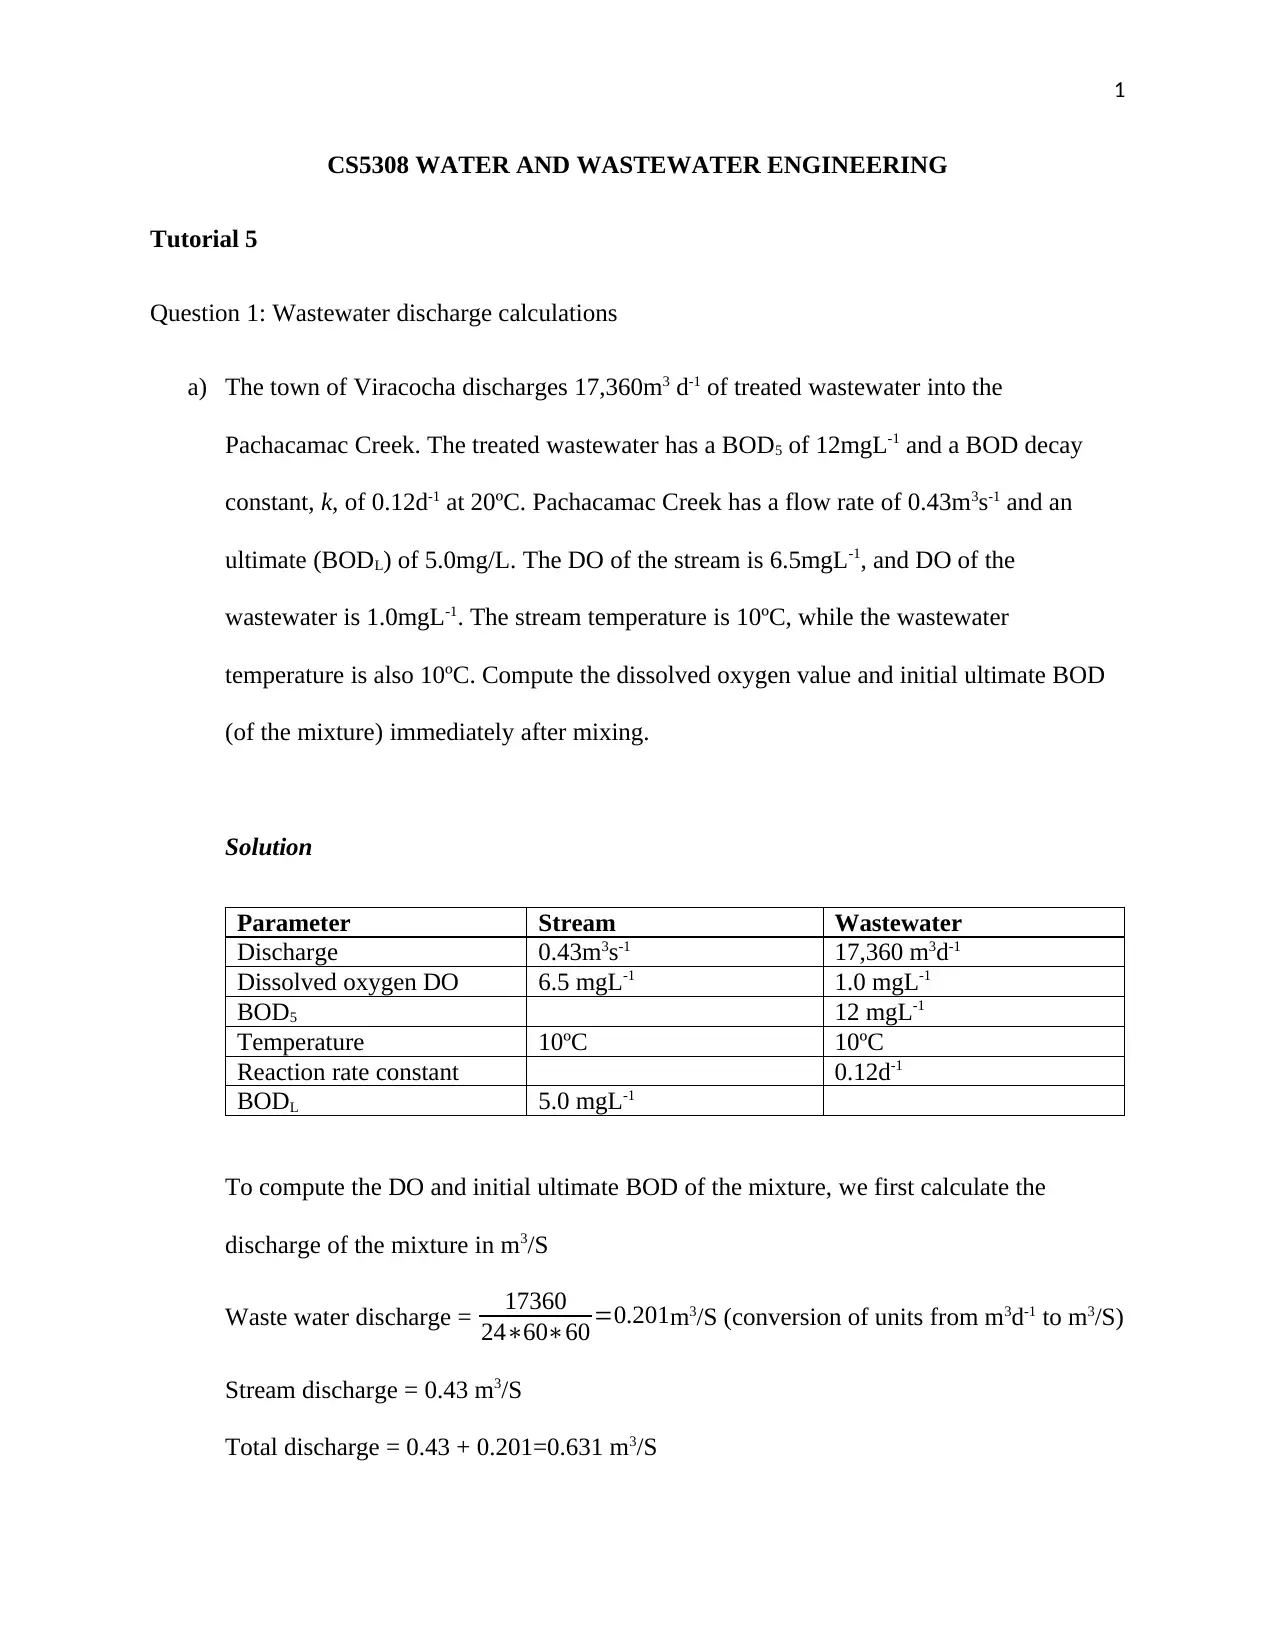
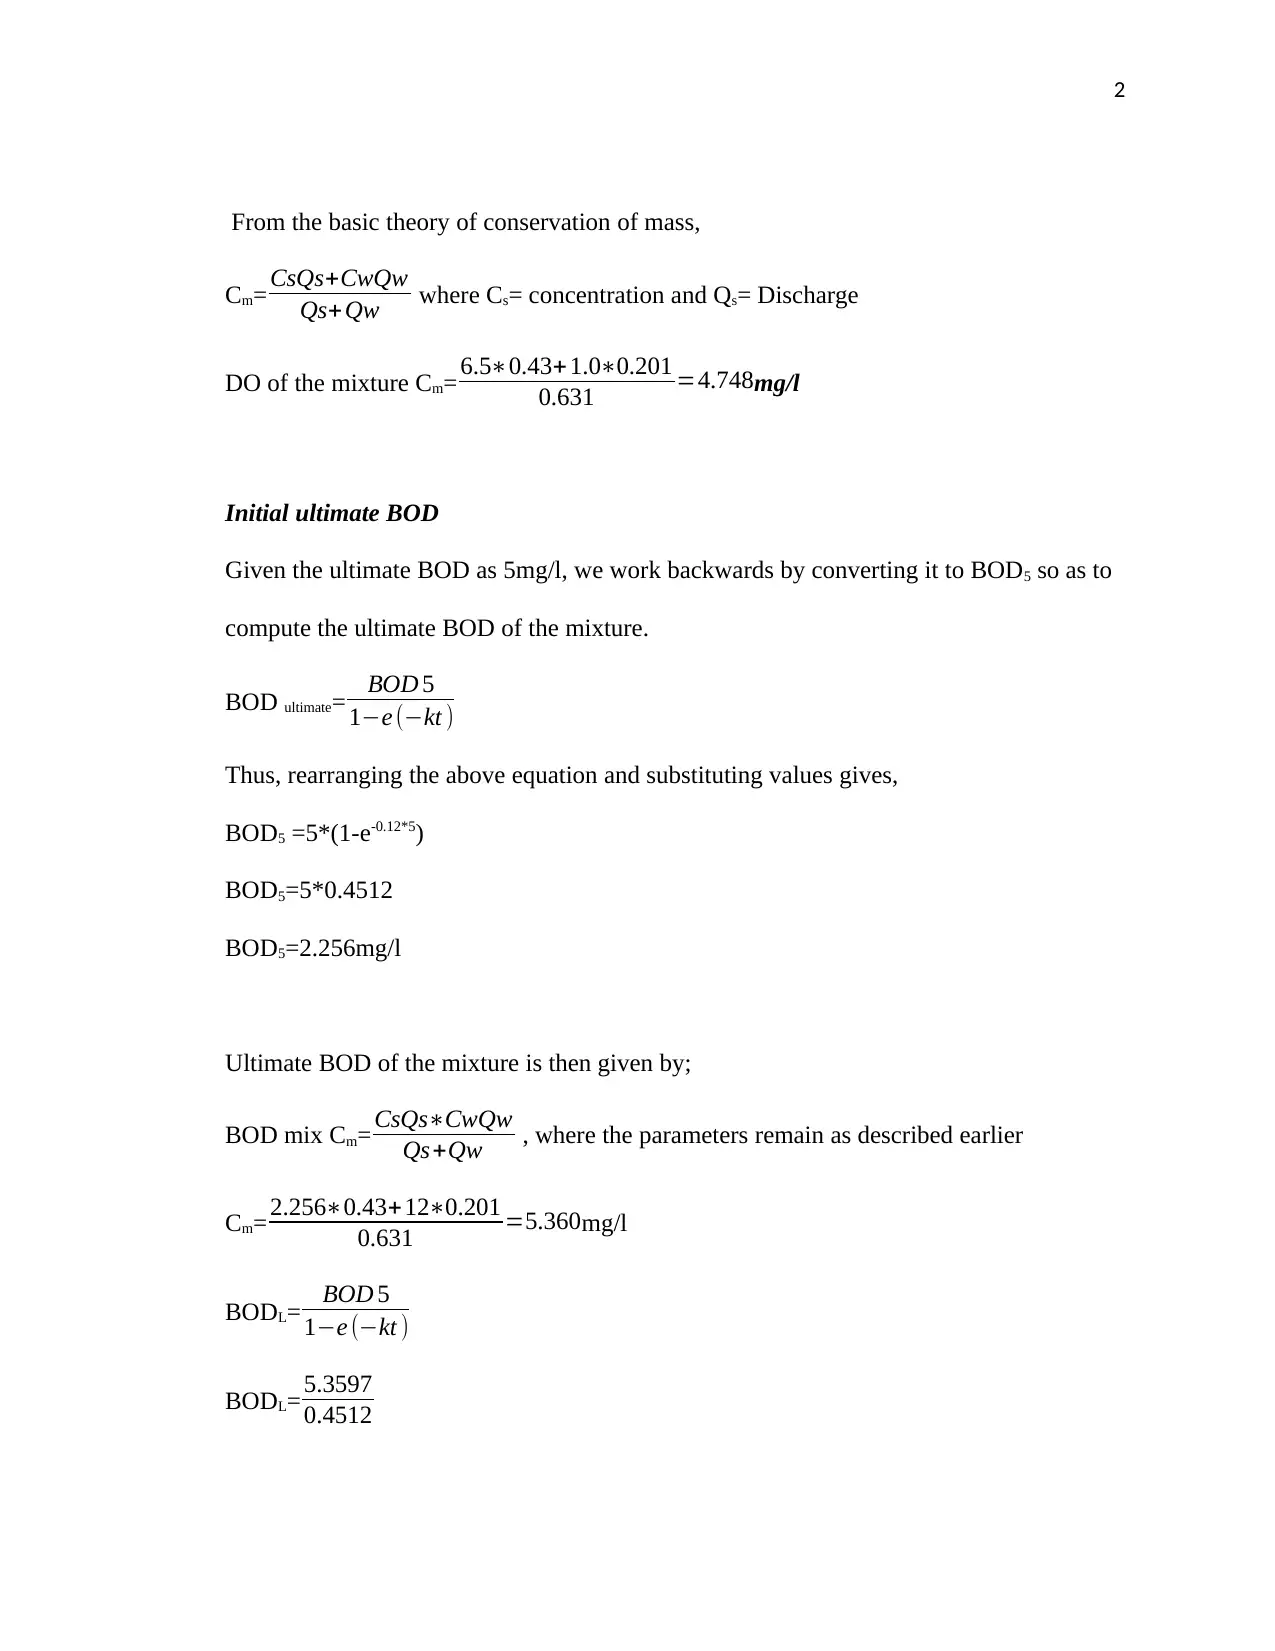
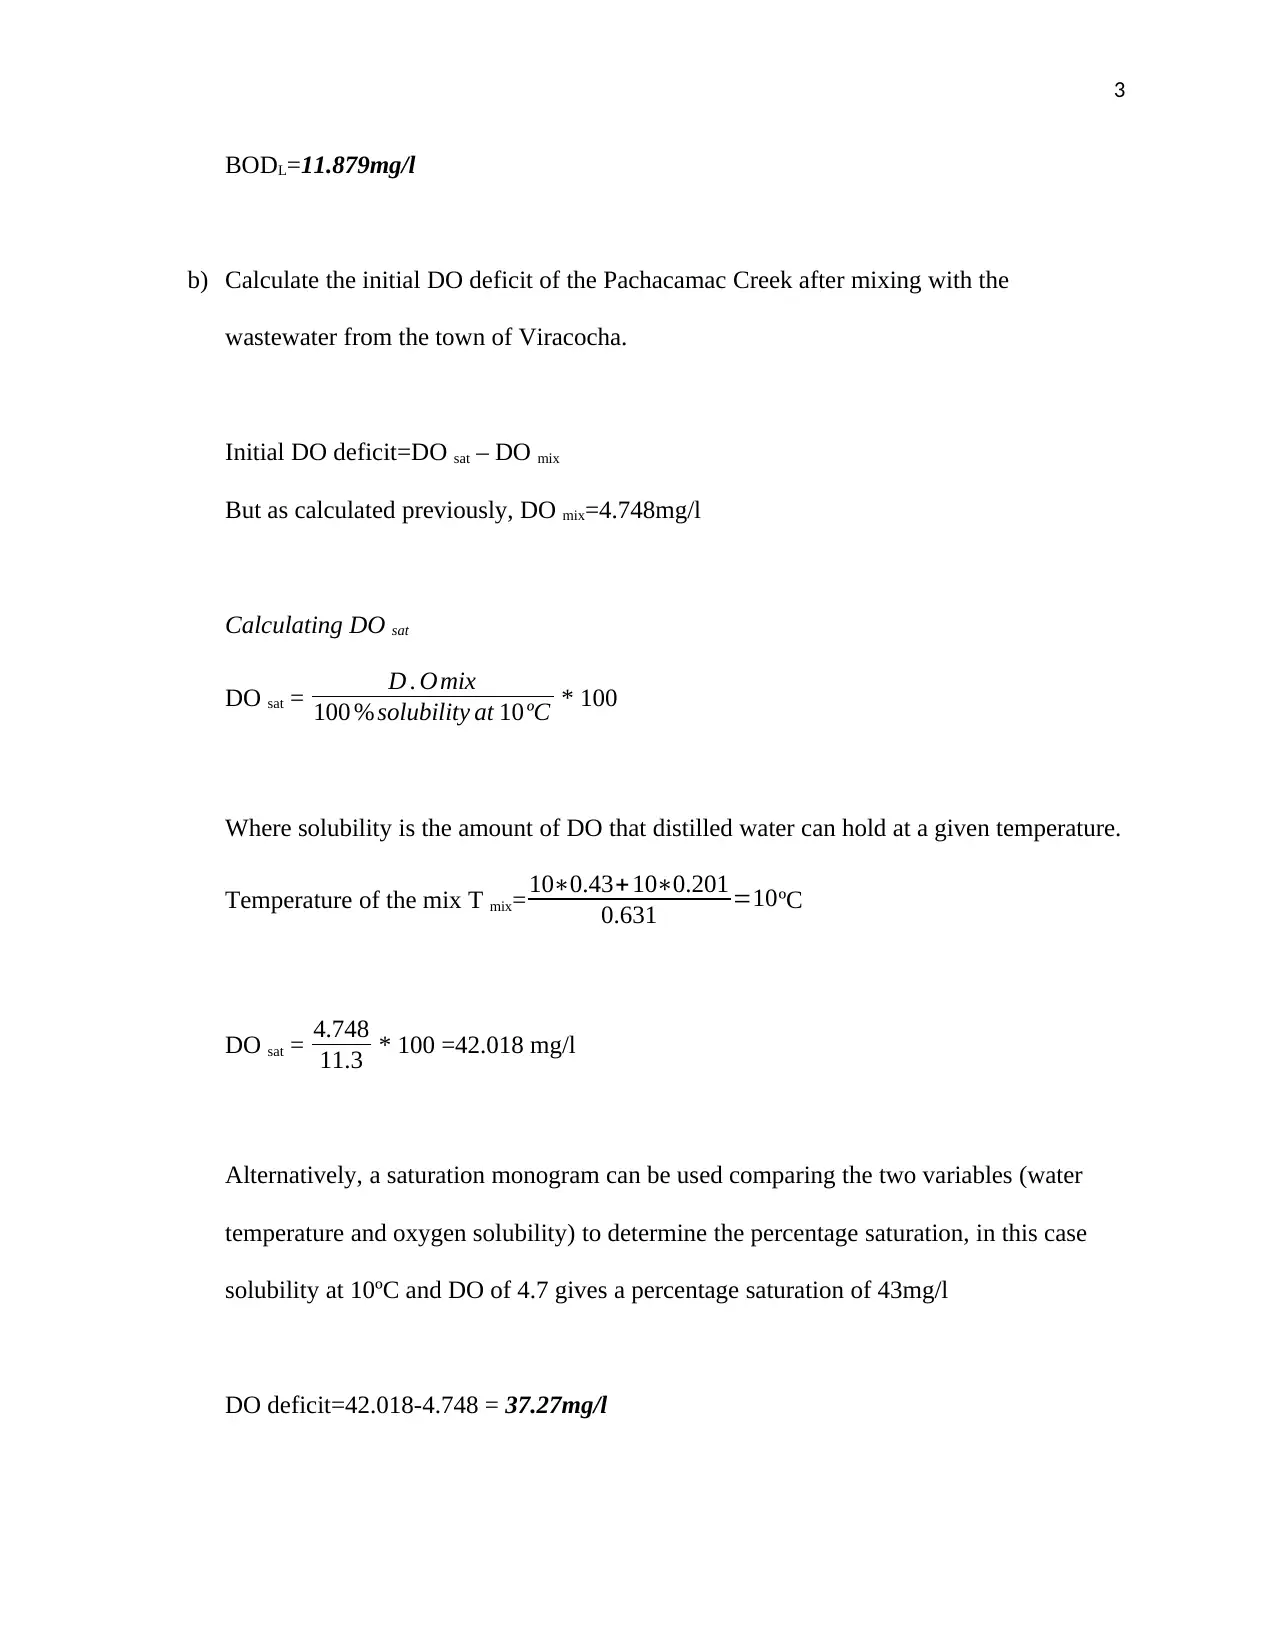
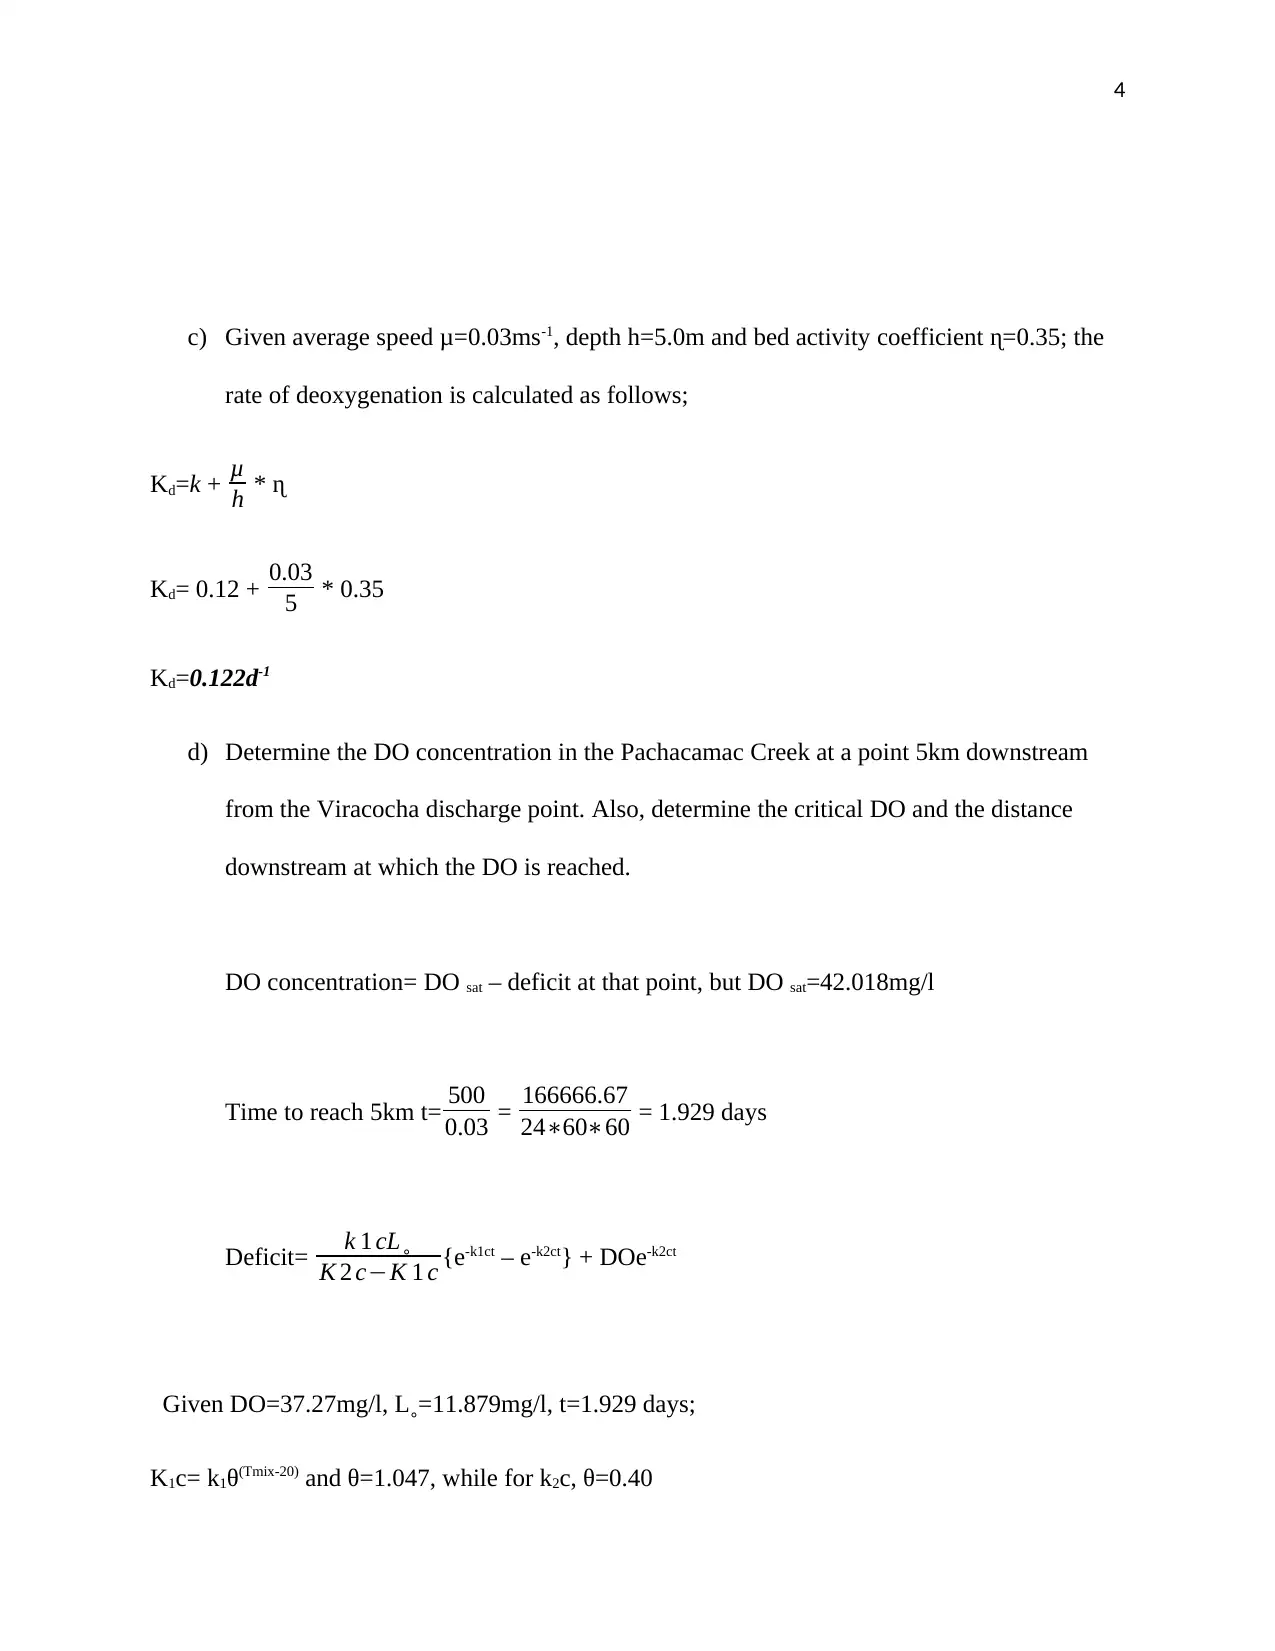
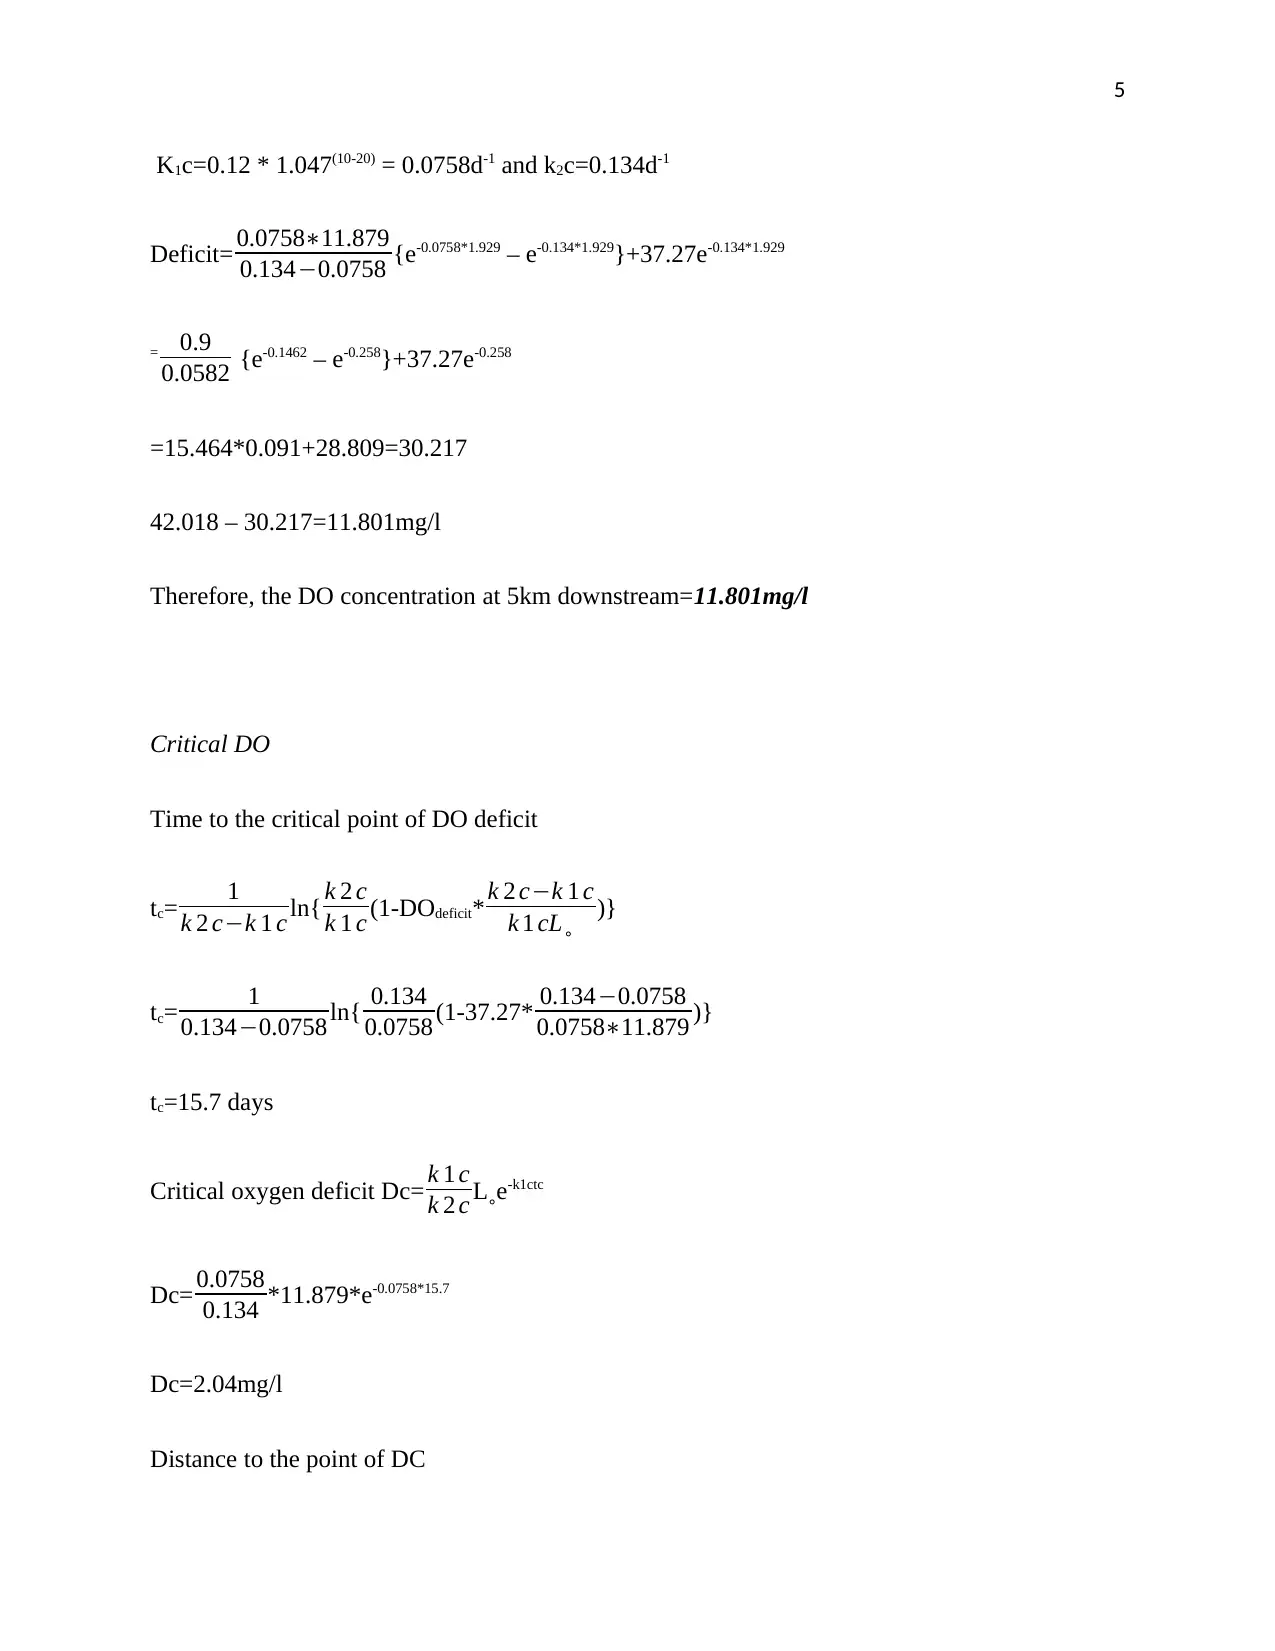
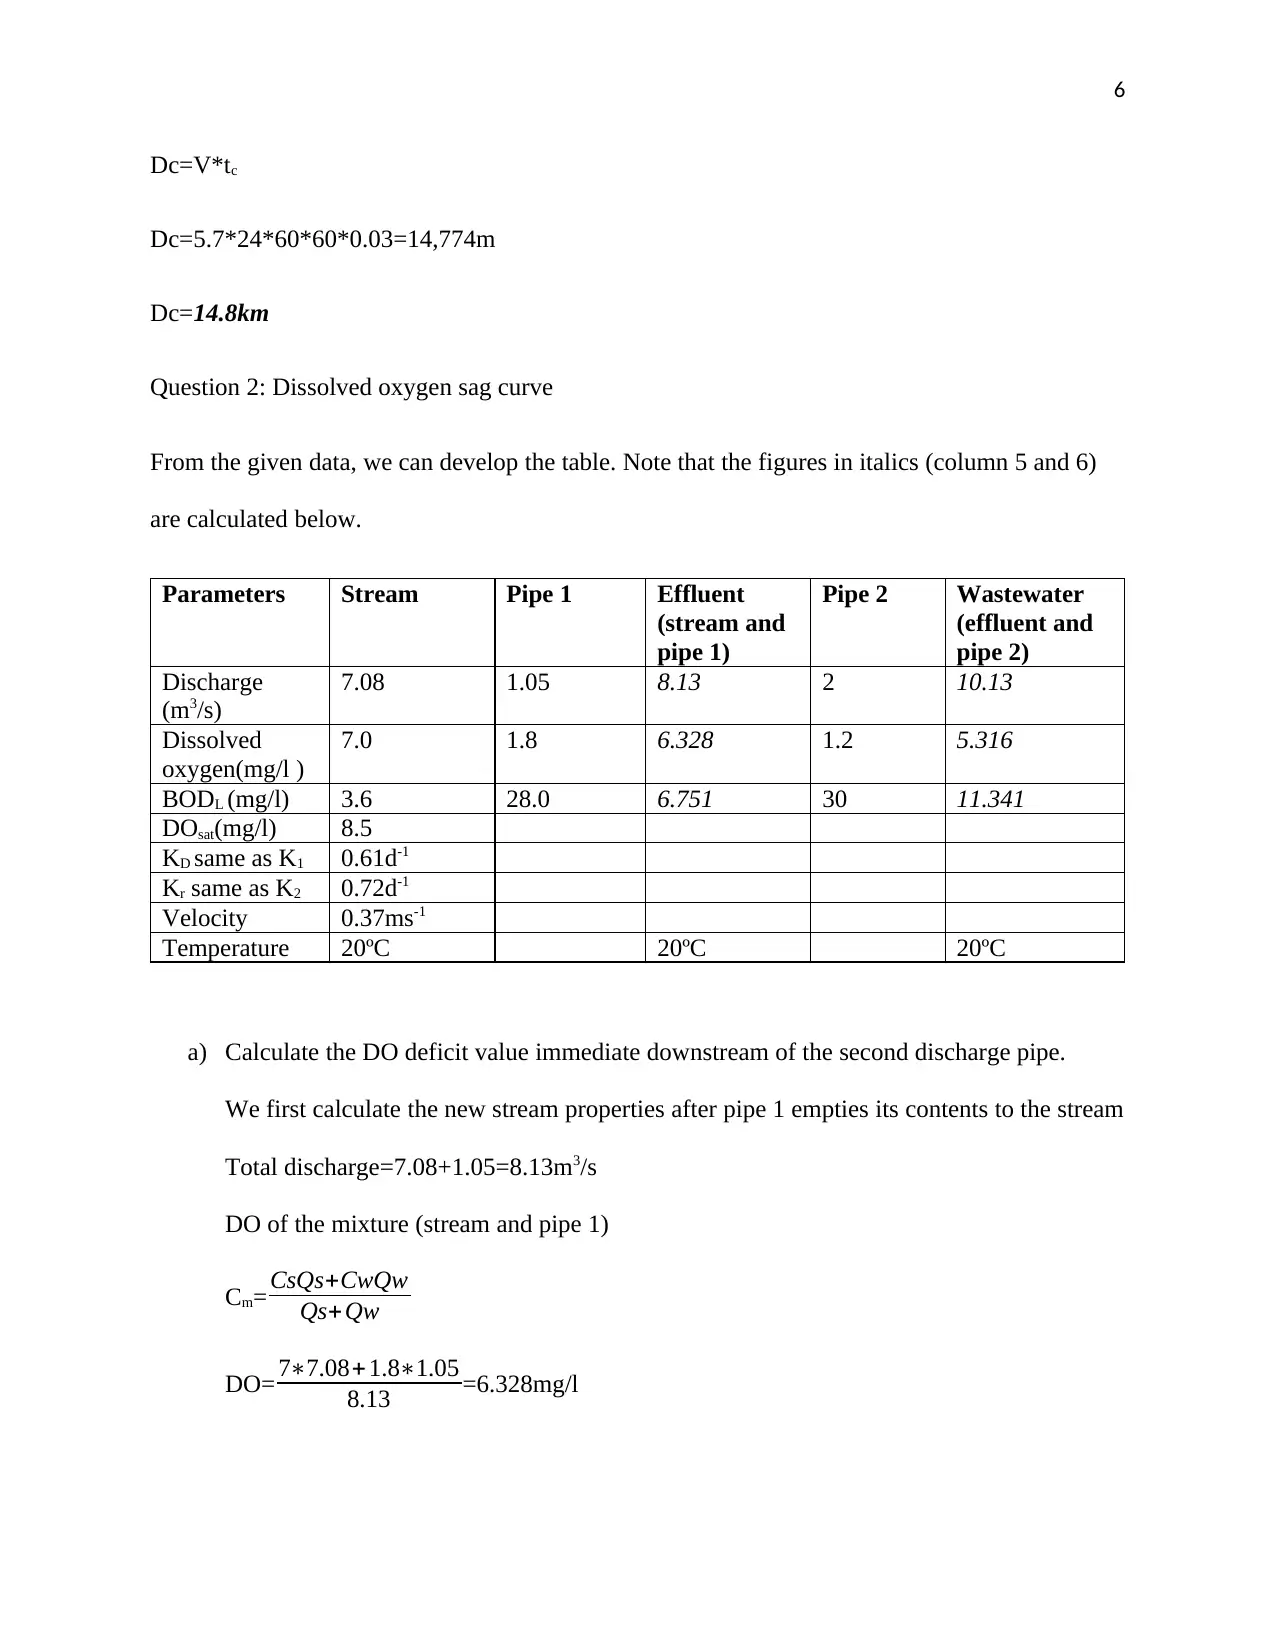
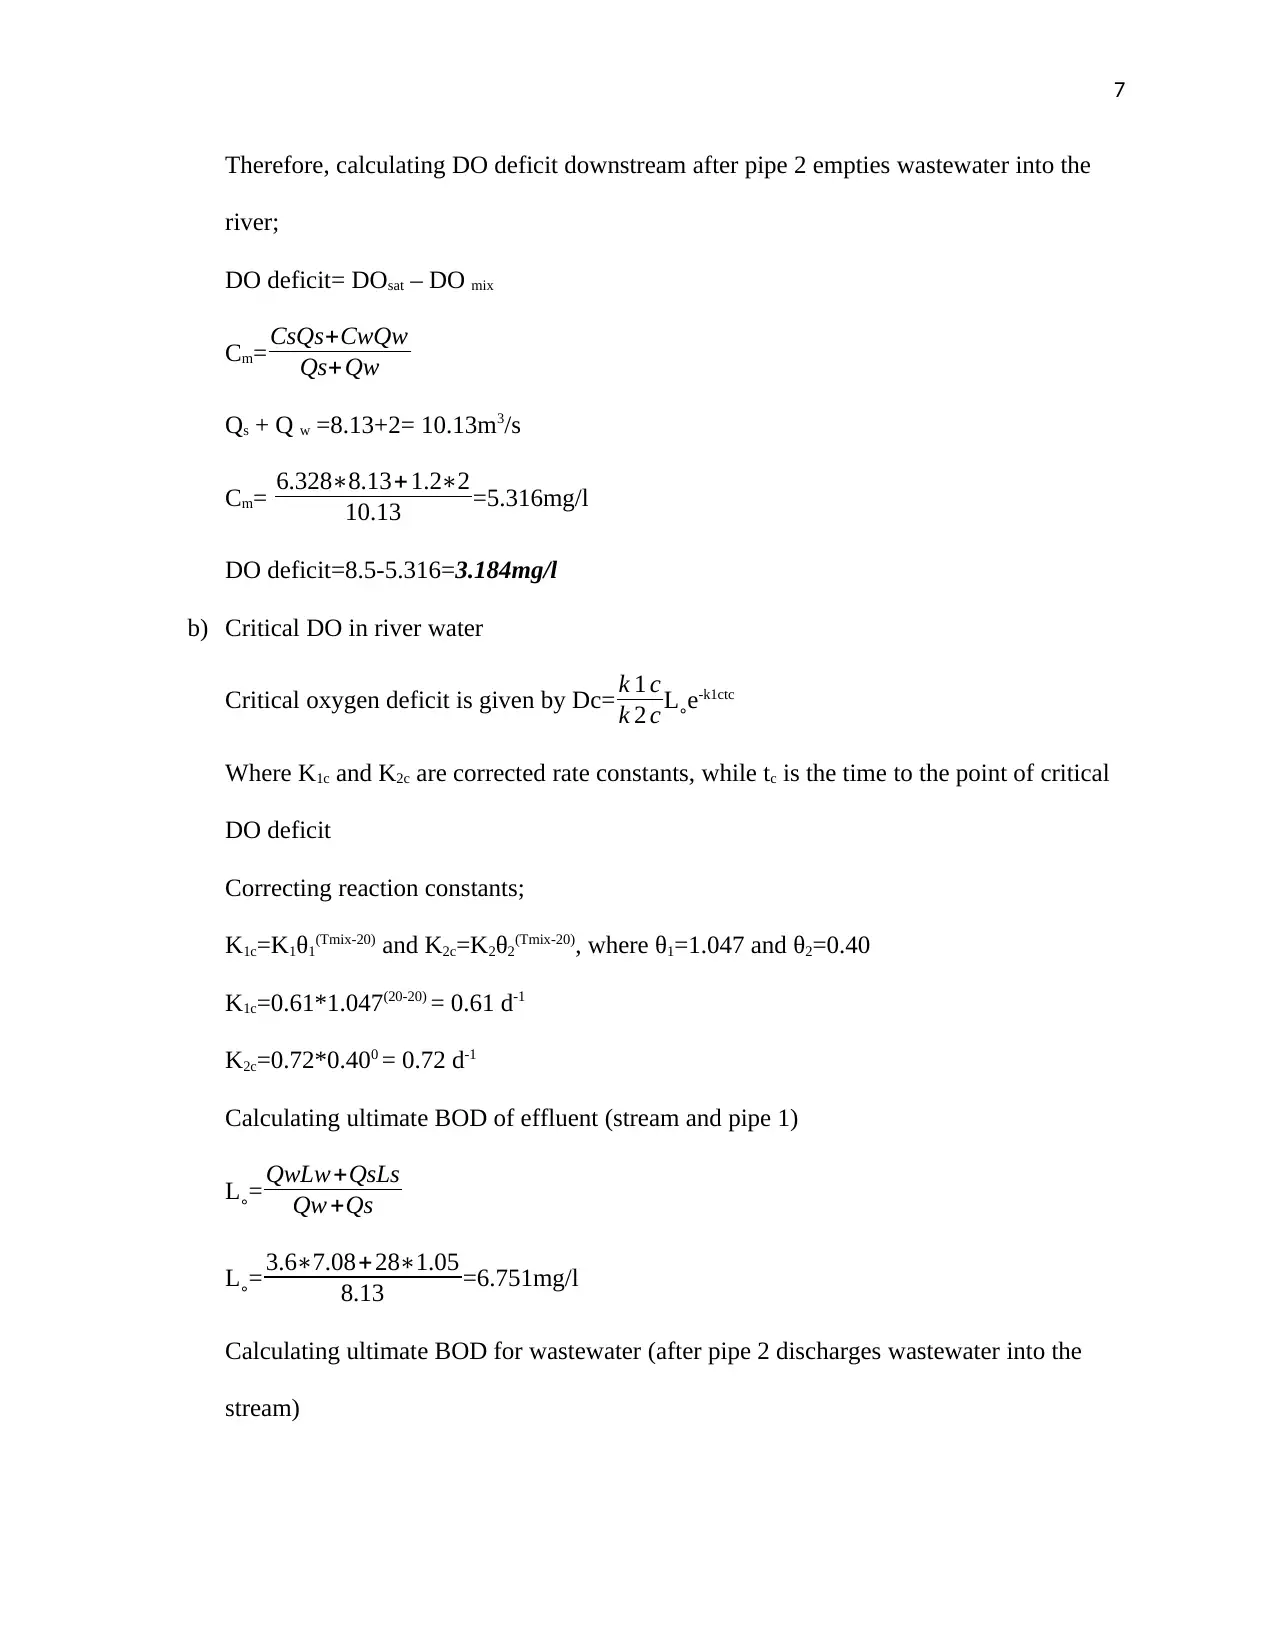
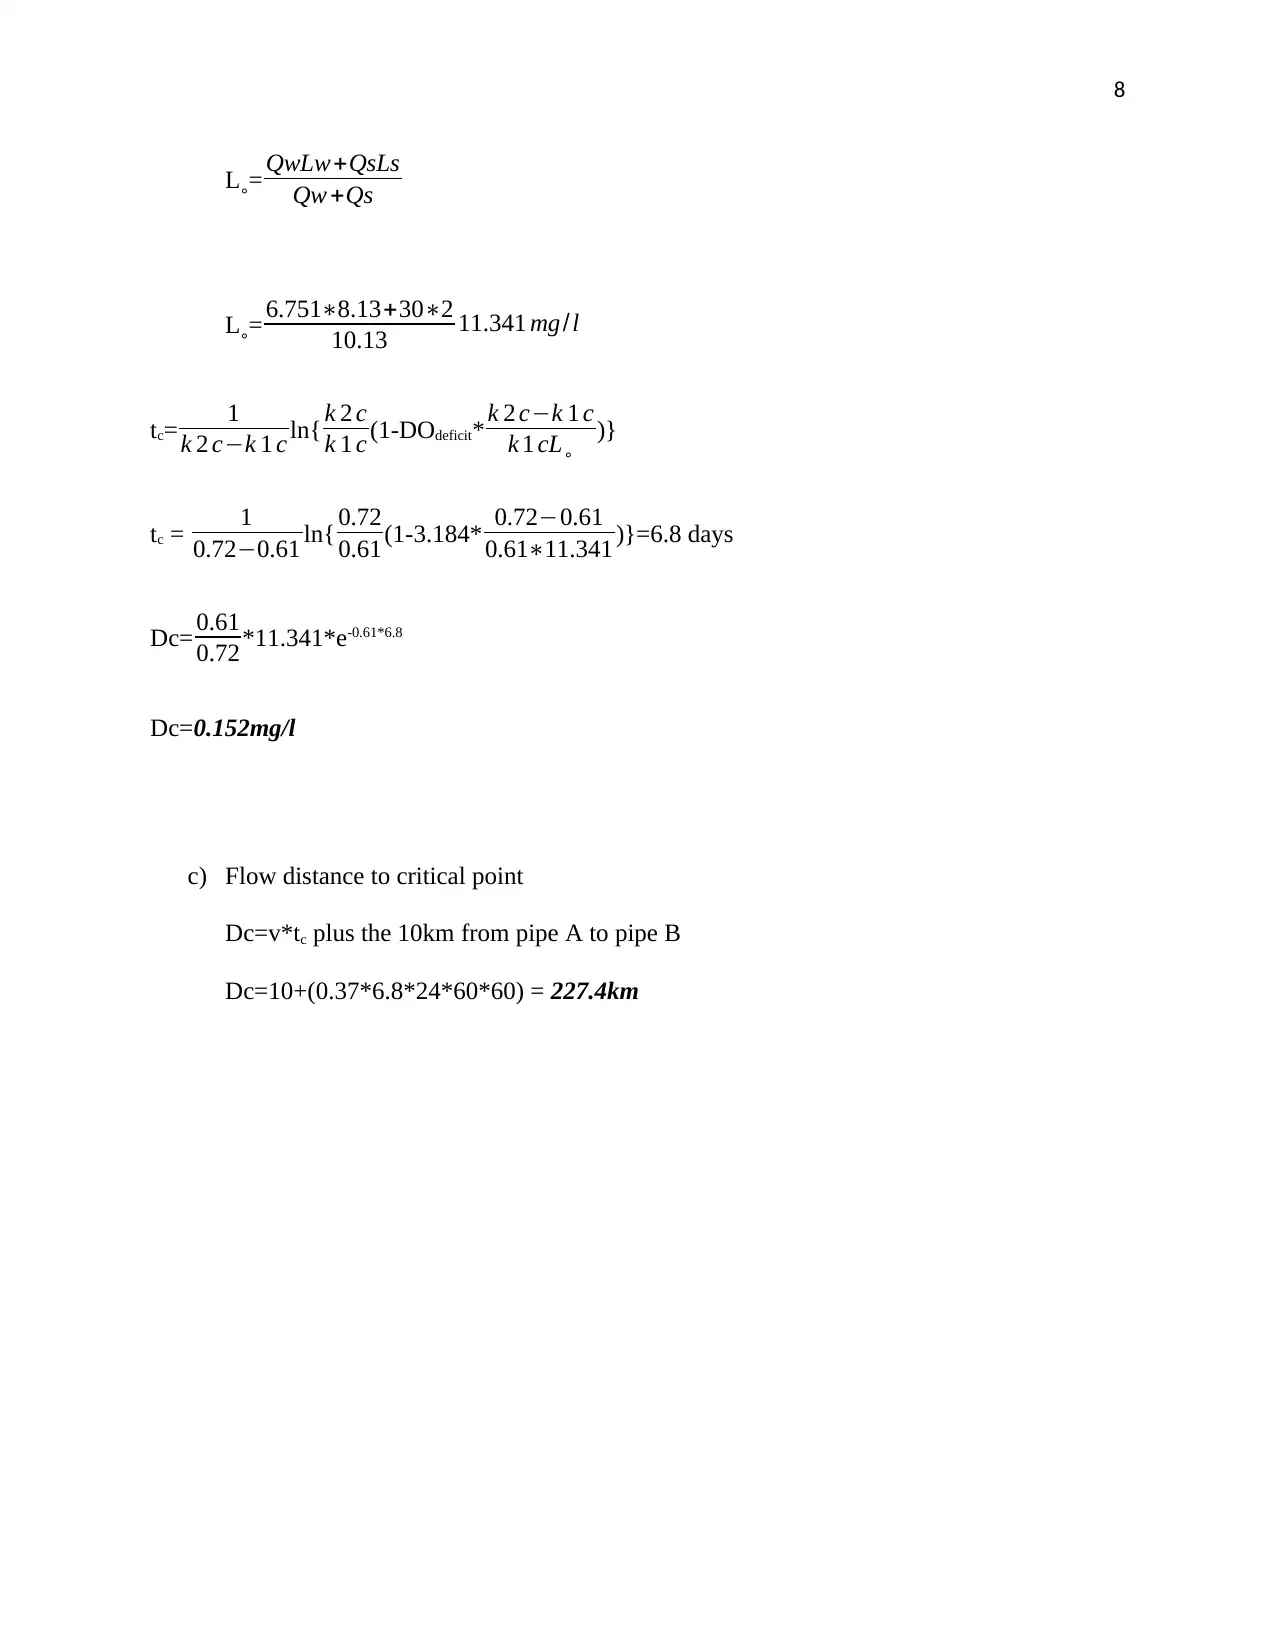
This document presents detailed solutions for two tutorials in CS5308 Water and Wastewater Engineering. Tutorial 5 focuses on wastewater discharge calculations, including determining dissolved oxygen (DO) values, initial ultimate BOD, DO deficits, and the rate of deoxygenation in a creek receiving treated wastewater. It involves calculations related to stream and wastewater mixing, DO saturation, and the DO sag curve. Tutorial 6 addresses stormwater management using the rational method and time-area method. It includes calculations for peak discharge under existing and post-developed conditions, considering runoff coefficients, rainfall intensity, and time of concentration. The solutions also cover the analysis of peak runoff rates and total discharge for different storm scenarios, providing a comprehensive understanding of water quality and quantity management principles.
Document Page
1
CS5308 WATER AND WASTEWATER ENGINEERING
Tutorial 5
Question 1: Wastewater discharge calculations
a) The town of Viracocha discharges 17,360m3 d-1 of treated wastewater into the
Pachacamac Creek. The treated wastewater has a BOD5 of 12mgL-1 and a BOD decay
constant, k, of 0.12d-1 at 20ºC. Pachacamac Creek has a flow rate of 0.43m3s-1 and an
ultimate (BODL) of 5.0mg/L. The DO of the stream is 6.5mgL-1, and DO of the
wastewater is 1.0mgL-1. The stream temperature is 10ºC, while the wastewater
temperature is also 10ºC. Compute the dissolved oxygen value and initial ultimate BOD
(of the mixture) immediately after mixing.
Solution
Parameter Stream Wastewater
Discharge 0.43m3s-1 17,360 m3d-1
Dissolved oxygen DO 6.5 mgL-1 1.0 mgL-1
BOD5 12 mgL-1
Temperature 10ºC 10ºC
Reaction rate constant 0.12d-1
BODL 5.0 mgL-1
To compute the DO and initial ultimate BOD of the mixture, we first calculate the
discharge of the mixture in m3/S
Waste water discharge = 17360
246060 =0.201m3/S (conversion of units from m3d-1 to m3/S)
Stream discharge = 0.43 m3/S
Total discharge = 0.43 + 0.201=0.631 m3/S
tabler-icon-diamond-filled.svg

Secure Best Marks with AI Grader

Need help grading? Try our AI Grader for instant feedback on your assignments.
Document Page
2
From the basic theory of conservation of mass,
Cm= CsQs+CwQw
Qs+Qw where Cs= concentration and Qs= Discharge
DO of the mixture Cm= 6.50.43+ 1.00.201
0.631 =4.748mg/l
Initial ultimate BOD
Given the ultimate BOD as 5mg/l, we work backwards by converting it to BOD5 so as to
compute the ultimate BOD of the mixture.
BOD ultimate= BOD 5
1e (kt )
Thus, rearranging the above equation and substituting values gives,
BOD5 =5*(1-е-0.12*5)
BOD5=5*0.4512
BOD5=2.256mg/l
Ultimate BOD of the mixture is then given by;
BOD mix Cm= CsQsCwQw
Qs+Qw , where the parameters remain as described earlier
Cm= 2.2560.43+120.201
0.631 =5.360mg/l
BODL= BOD 5
1e (kt )
BODL= 5.3597
0.4512
Document Page
3
BODL=11.879mg/l
b) Calculate the initial DO deficit of the Pachacamac Creek after mixing with the
wastewater from the town of Viracocha.
Initial DO deficit=DO sat – DO mix
But as calculated previously, DO mix=4.748mg/l
Calculating DO sat
DO sat = D . Omix
100 % solubility at 10ºC * 100
Where solubility is the amount of DO that distilled water can hold at a given temperature.
Temperature of the mix T mix= 100.43+100.201
0.631 =10ºC
DO sat = 4.748
11.3 * 100 =42.018 mg/l
Alternatively, a saturation monogram can be used comparing the two variables (water
temperature and oxygen solubility) to determine the percentage saturation, in this case
solubility at 10ºC and DO of 4.7 gives a percentage saturation of 43mg/l
DO deficit=42.018-4.748 = 37.27mg/l
Document Page
4
c) Given average speed μ=0.03ms-1, depth h=5.0m and bed activity coefficient ɳ=0.35; the
rate of deoxygenation is calculated as follows;
Kd=k + μ
h * ɳ
Kd= 0.12 + 0.03
5 * 0.35
Kd=0.122d-1
d) Determine the DO concentration in the Pachacamac Creek at a point 5km downstream
from the Viracocha discharge point. Also, determine the critical DO and the distance
downstream at which the DO is reached.
DO concentration= DO sat – deficit at that point, but DO sat=42.018mg/l
Time to reach 5km t= 500
0.03 = 166666.67
246060 = 1.929 days
Deficit= k 1 cL ˳
K 2 cK 1 c -k1ct – e-k2ct} + DOe-k2ct
Given DO=37.27mg/l, L˳=11.879mg/l, t=1.929 days;
K1c= k1θ(Tmix-20) and θ=1.047, while for k2c, θ=0.40
tabler-icon-diamond-filled.svg

Secure Best Marks with AI Grader

Need help grading? Try our AI Grader for instant feedback on your assignments.
Document Page
5
K1c=0.12 * 1.047(10-20) = 0.0758d-1 and k2c=0.134d-1
Deficit= 0.075811.879
0.1340.0758 {e-0.0758*1.929 – e-0.134*1.929}+37.27e-0.134*1.929
= 0.9
0.0582 {e-0.1462 – e-0.258}+37.27e-0.258
=15.464*0.091+28.809=30.217
42.018 – 30.217=11.801mg/l
Therefore, the DO concentration at 5km downstream=11.801mg/l
Critical DO
Time to the critical point of DO deficit
tc= 1
k 2 ck 1 c ln{ k 2 c
k 1 c (1-DOdeficit* k 2 ck 1 c
k 1 cL ˳ )}
tc= 1
0.1340.0758 ln{ 0.134
0.0758 (1-37.27* 0.1340.0758
0.075811.879 )}
tc=15.7 days
Critical oxygen deficit Dc= k 1 c
k 2 c L˳e-k1ctc
Dc= 0.0758
0.134 *11.879*e-0.0758*15.7
Dc=2.04mg/l
Distance to the point of DC
Document Page
6
Dc=V*tc
Dc=5.7*24*60*60*0.03=14,774m
Dc=14.8km
Question 2: Dissolved oxygen sag curve
From the given data, we can develop the table. Note that the figures in italics (column 5 and 6)
are calculated below.
Parameters Stream Pipe 1 Effluent
(stream and
pipe 1)
Pipe 2 Wastewater
(effluent and
pipe 2)
Discharge
(m3/s)
7.08 1.05 8.13 2 10.13
Dissolved
oxygen(mg/l )
7.0 1.8 6.328 1.2 5.316
BODL (mg/l) 3.6 28.0 6.751 30 11.341
DOsat(mg/l) 8.5
KD same as K1 0.61d-1
Kr same as K2 0.72d-1
Velocity 0.37ms-1
Temperature 20ºC 20ºC 20ºC
a) Calculate the DO deficit value immediate downstream of the second discharge pipe.
We first calculate the new stream properties after pipe 1 empties its contents to the stream
Total discharge=7.08+1.05=8.13m3/s
DO of the mixture (stream and pipe 1)
Cm= CsQs+CwQw
Qs+Qw
DO= 77.08+ 1.81.05
8.13 =6.328mg/l
Document Page
7
Therefore, calculating DO deficit downstream after pipe 2 empties wastewater into the
river;
DO deficit= DOsat – DO mix
Cm= CsQs+CwQw
Qs+Qw
Qs + Q w =8.13+2= 10.13m3/s
Cm= 6.3288.13+ 1.22
10.13 =5.316mg/l
DO deficit=8.5-5.316=3.184mg/l
b) Critical DO in river water
Critical oxygen deficit is given by Dc= k 1 c
k 2 c L˳e-k1ctc
Where K1c and K2c are corrected rate constants, while tc is the time to the point of critical
DO deficit
Correcting reaction constants;
K1c=K1θ1(Tmix-20) and K2c=K2θ2(Tmix-20), where θ1=1.047 and θ2=0.40
K1c=0.61*1.047(20-20) = 0.61 d-1
K2c=0.72*0.400 = 0.72 d-1
Calculating ultimate BOD of effluent (stream and pipe 1)
L˳= QwLw+QsLs
Qw +Qs
L˳= 3.67.08+ 281.05
8.13 =6.751mg/l
Calculating ultimate BOD for wastewater (after pipe 2 discharges wastewater into the
stream)
tabler-icon-diamond-filled.svg

Paraphrase This Document

Need a fresh take? Get an instant paraphrase of this document with our AI Paraphraser
Document Page
8
L˳= QwLw+QsLs
Qw +Qs
L˳= 6.7518.13+302
10.13 11.341 mg/l
tc= 1
k 2 ck 1 c ln{ k 2 c
k 1 c (1-DOdeficit* k 2 ck 1 c
k 1 cL ˳ )}
tc = 1
0.720.61 ln{ 0.72
0.61(1-3.184* 0.720.61
0.6111.341 )}=6.8 days
Dc= 0.61
0.72*11.341*e-0.61*6.8
Dc=0.152mg/l
c) Flow distance to critical point
Dc=v*tc plus the 10km from pipe A to pipe B
Dc=10+(0.37*6.8*24*60*60) = 227.4km
Document Page
9
Tutorial 6
Question 1
Given a catchment area to be 37ha, with a 10-year runoff coefficient of 0.2 and estimated
post-development 10-year runoff coefficient of 0.6, time of concentration 50 minutes and
estimated tc in the post developed condition will be 40 minutes.
i) Use the rational method to calculate the 5-year ARI and 50-year ARI peak
discharge for the existing and post developed conditions.
a) Existing conditions
Time of concentration is taken as 50 minutes
Calculating the 5-year ARI peak discharge
Q= 1
3.6 CIA
Where Q is peak discharge, c=runoff coefficient, I rainfall intensity in mm/h and
A is the catchment area in km. The fraction 1
3.6 is a conversion factor to
harmonize the units into m3/s
Document Page
10
A= 37
100 =0.37km2 ; c=0.2, from the given table, time of concentration yields
intensity of 33mm/h
Q= 1
3.6*0.2*33*0.37
Q=0.678 m3/s
Calculating the 50-year ARI peak discharge
from the given table, time of concentration yields intensity of 56mm/h
Q= 1
3.6*0.2*56*0.37
Q=1.15m3/s
b) Post developed conditions
Here, the time of concentration is 40 minutes, c=0.6
Calculating the 5-year ARI peak discharge
Q= 1
3.6 CIA But from the given table, time of concentration(40 minutes) yields
intensity of 38mm/h
Q= 1
3.6*0.6*38*0.37
Q=2.34m3/s
Calculating the 50-year ARI peak discharge
I=65mm/h
Q= 1
3.60.6650.37
tabler-icon-diamond-filled.svg

Secure Best Marks with AI Grader

Need help grading? Try our AI Grader for instant feedback on your assignments.
Document Page
11
Q=4 m3/s
ii) Calculating peak runoff rate and total discharge for a 50-year ARI rainfall in the
post-development condition using time area method
Given that c=constant=0.6 for the 3 areas.
A1=7ha, A2=15ha, A3=15ha
i1= 100mm/h, i2=200mm/h, i3=75mm/h
total discharge is given by the discharges from the individual areas having
different rainfall intensities, mathematically expressed as;
Q p=Qp1+Qp2+Qp3
Qp1= 1
3.60.61000.07=1.17m3/s
Qp2= 1
3.60.62000.15=5m3/s
Qp3= 1
3.60.6750.15=1.875m3/s
Q p=1.17+5+1.875
Q p=8.045m3/s
Question 2
Calculating the peak and total discharge produced by two storms using the time-
area method
Storm A (increasing intensity)
Calculating areas from the triangular paved area using geometry;
Area 4; A=0.5*0.05(0.08+0.06) = 0.0035km2
Document Page
12
Area 3; A=0.5*0.05(0.06+0.04) = 0.0025km2
Area 2; A=0.5*0.05(0.04+0.02) = 0.0015km2
Area 1; A=0.5*0.05*0.02=0.0005km2
Calculating peak discharges,
Q4= 1
3.6 *5*0.0035=0.00486 m3/s
Q3= 1
3.6 *10*0.0025=0.00694 m3/s
Q2= 1
3.6 *15*0.0015=0.00625 m3/s
Q1= 1
3.6 *20*0.0005=0.00278 m3/s
Total discharge Q=0.00486+0.00694+0.00625+0.00278
Q=0.021m3/s
Storm B (decreasing intensity)
Q4= 1
3.6 *20*0.0035=0.0194 m3/s
Q3= 1
3.6 *15*0.0025=0.01 m3/s
Q2= 1
3.6 *10*0.0015=0.0042 m3/s
Q1= 1
3.6 *5*0.0005=0.001 m3/s
Total discharge Q=0.0194+0.01+0.0042+0.001
Q=0.035m3/s
Document Page
13
chevron_up_icon
1 out of 13
circle_padding
hide_on_mobile
zoom_out_icon
logo.png

Your All-in-One AI-Powered Toolkit for Academic Success.

Available 24*7 on WhatsApp / Email

[object Object]