Comprehensive Financial Analysis Report: Watley Company Performance

Verified

Added on  2020/04/21

|8
|1366
|255
Report
AI Summary
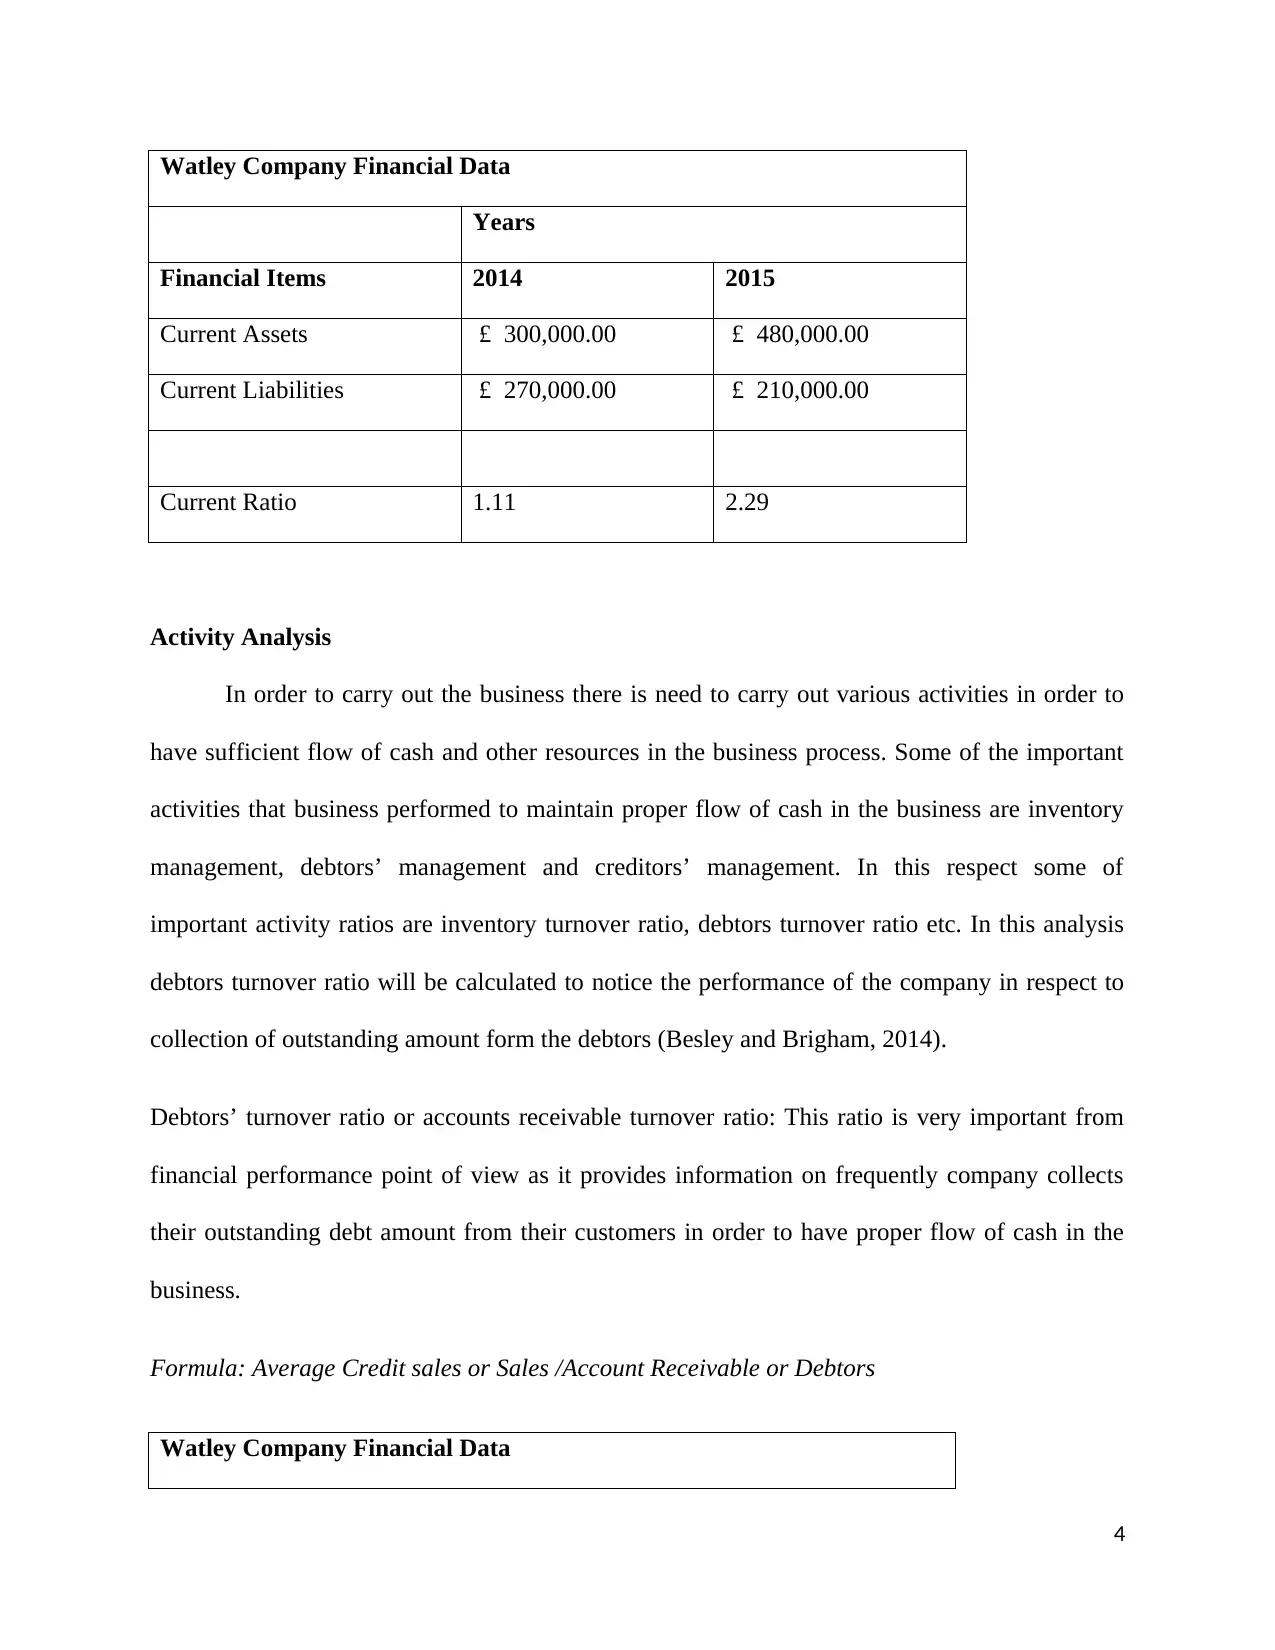
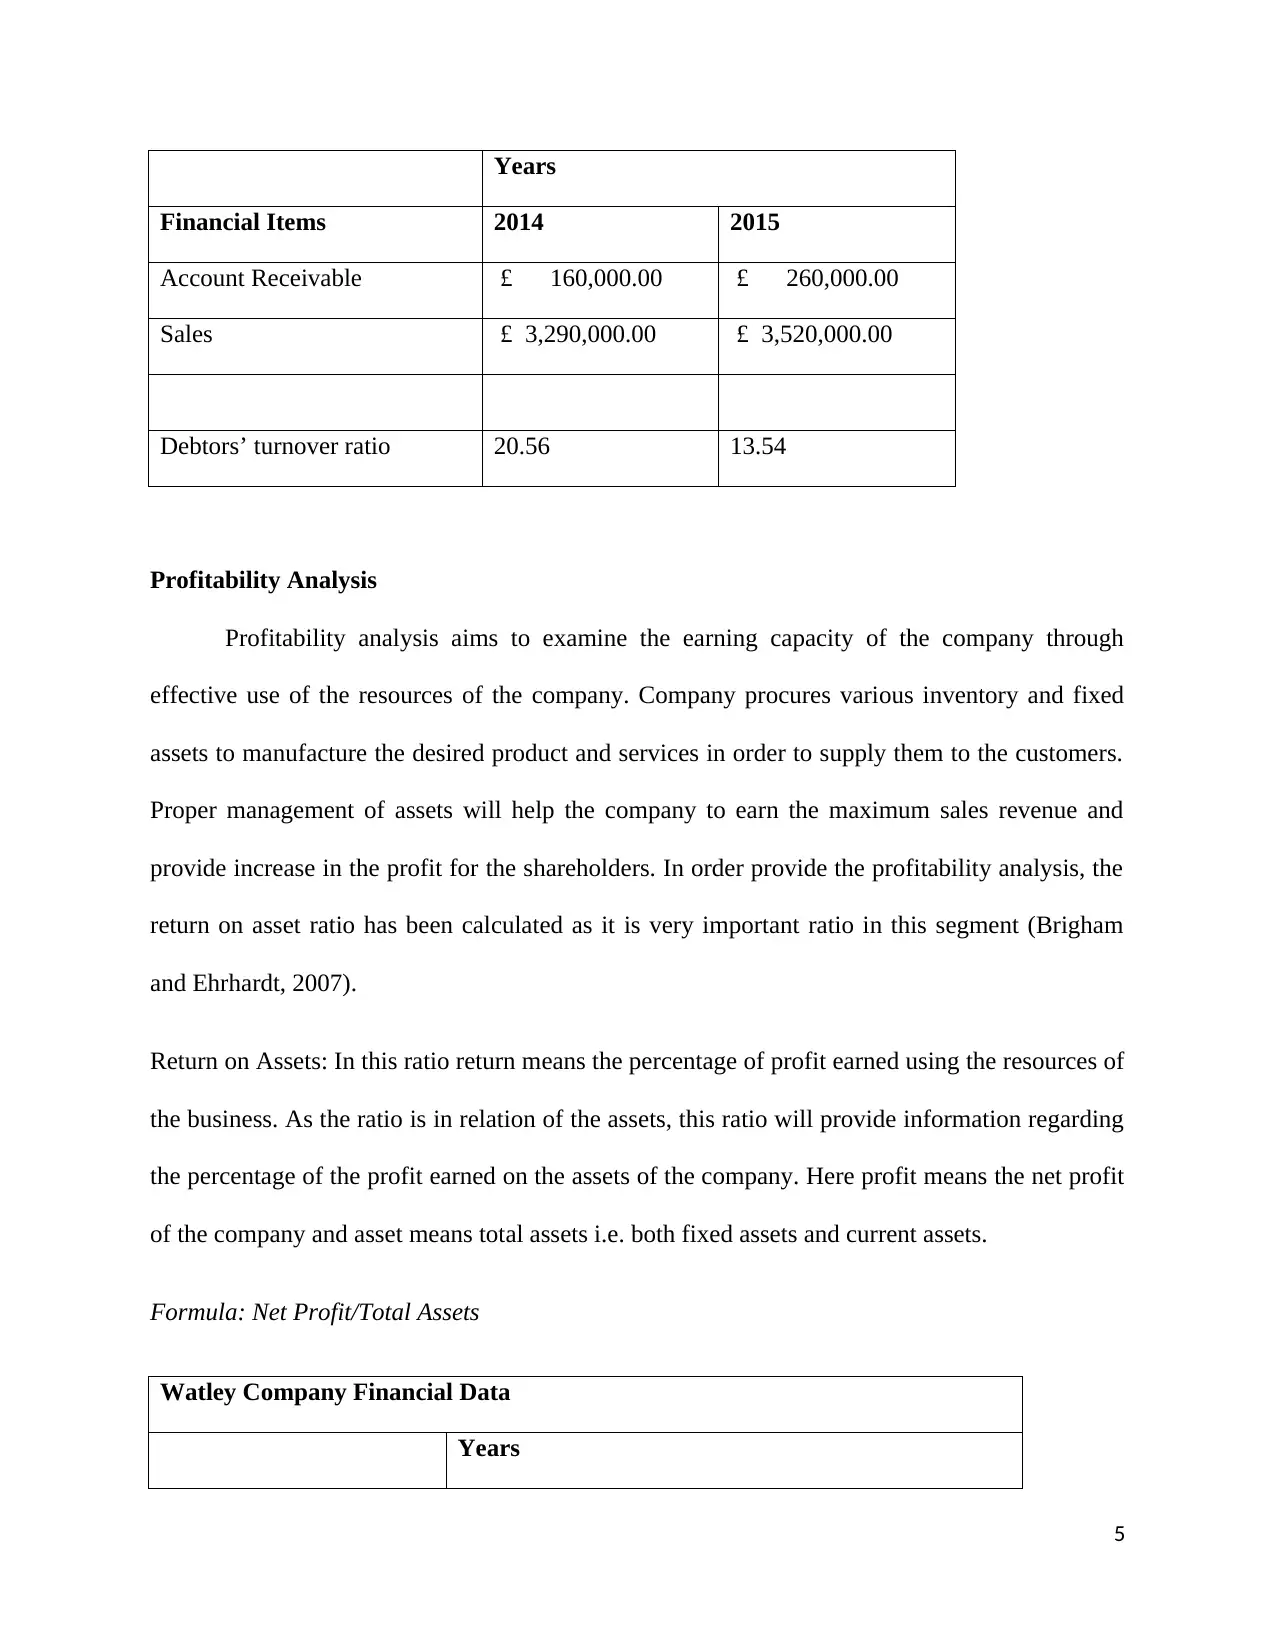
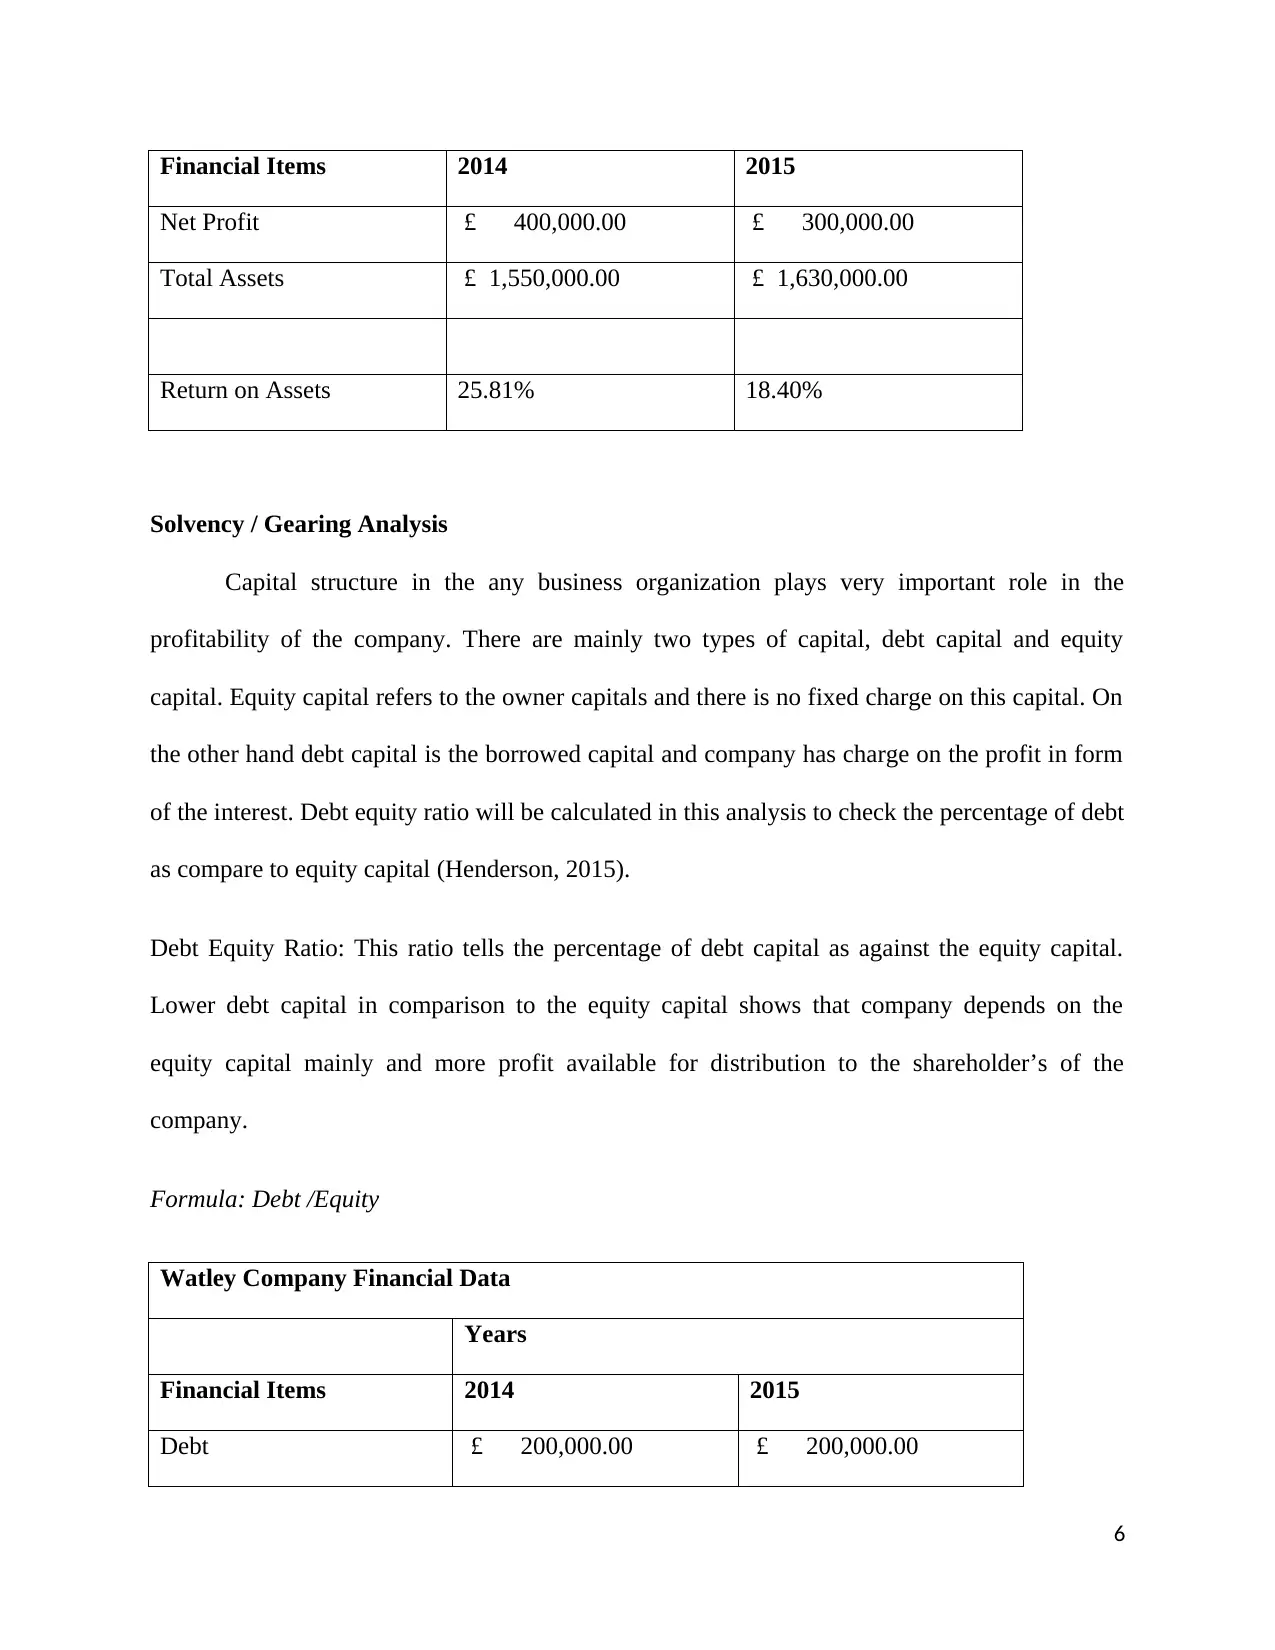
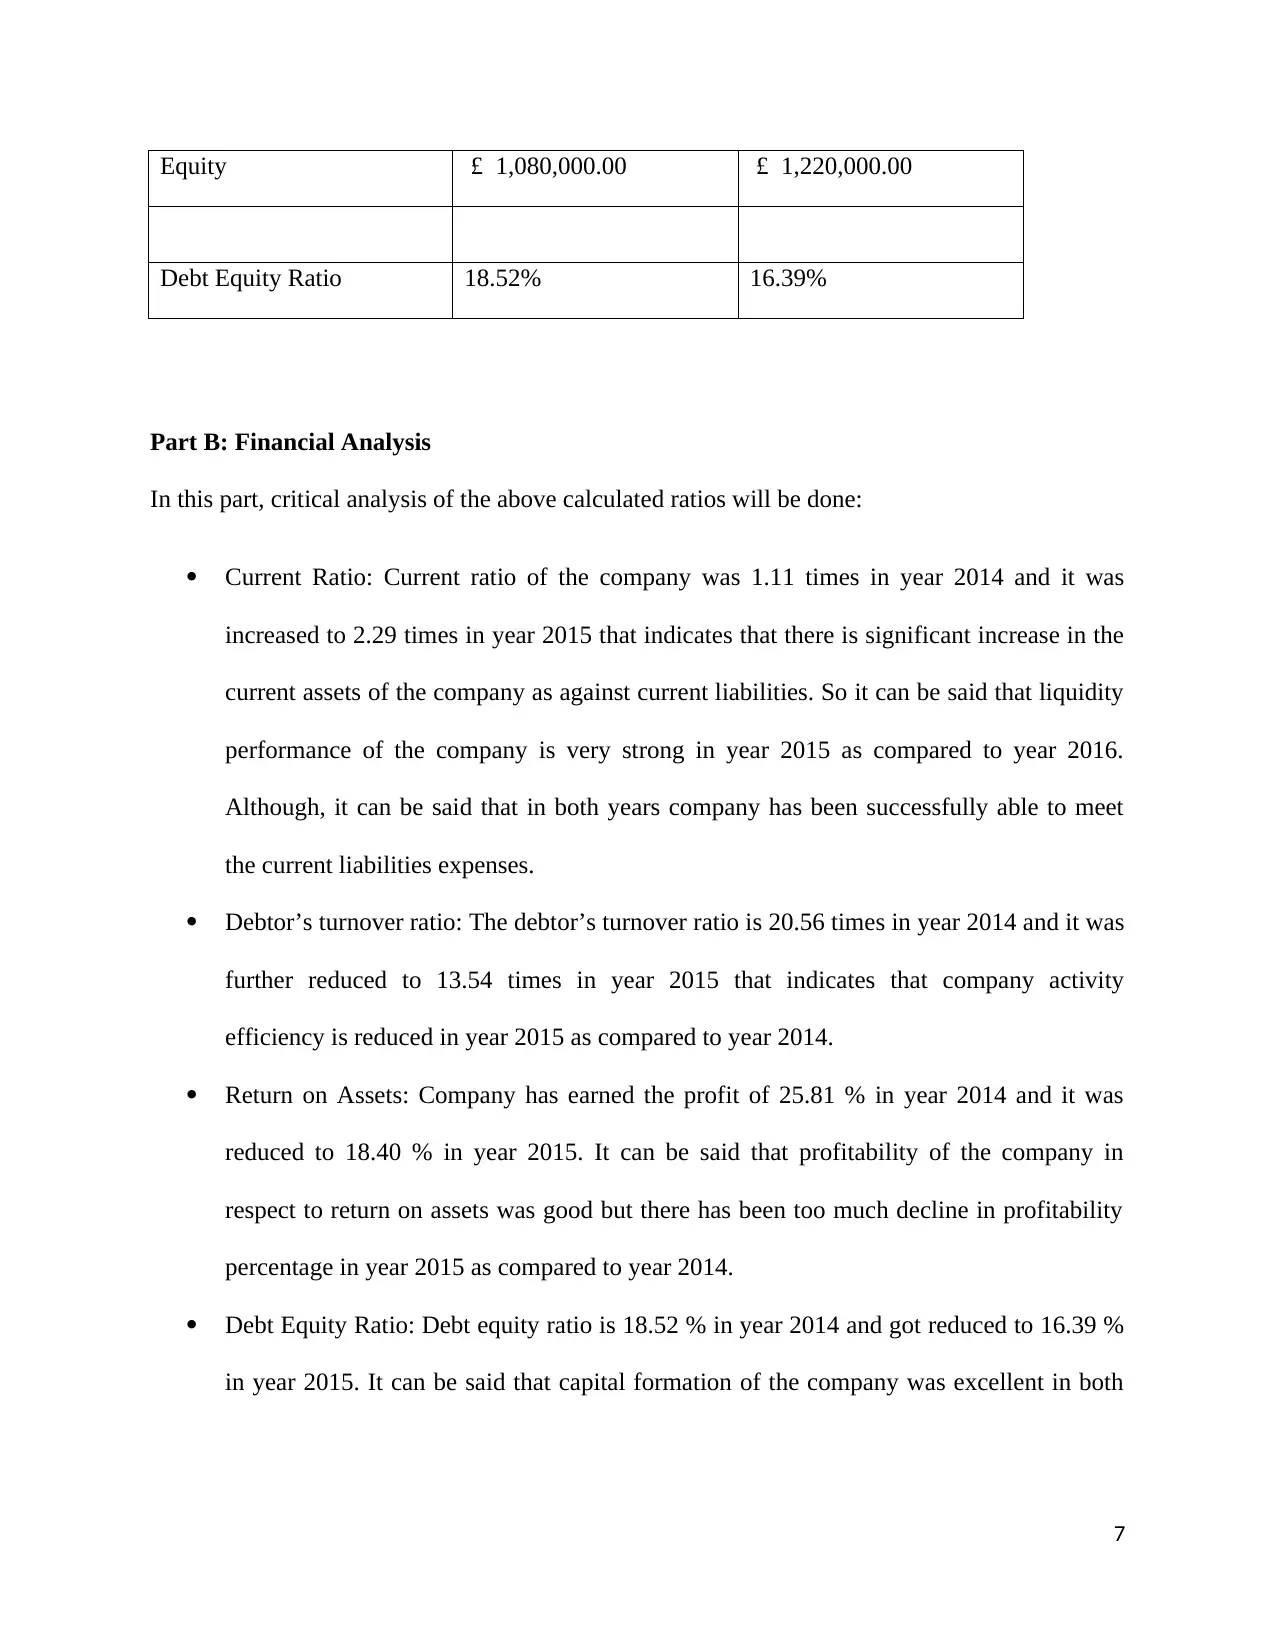
This report presents a financial analysis of the Watley Company, evaluating its performance through various financial ratios. The analysis is divided into two parts: Part A focuses on ratio analysis, including liquidity (current ratio), activity (debtors turnover ratio), profitability (return on assets), and solvency (debt equity ratio) calculations for 2014 and 2015. The report provides the formulas and calculated values for each ratio. Part B offers a critical analysis of the calculated ratios, highlighting the company's strengths and weaknesses in terms of financial health, efficiency, and profitability. The analysis reveals insights into the company's performance, such as improved liquidity but decreased profitability and activity efficiency in 2015. Finally, the report provides recommendations for improvement, such as strategies to improve the debtors turnover ratio and control expenses. The report concludes that the capital formation of the company was excellent in both the years and there is positive decline in year 2015 that shows positive change in the capital formation of the company.
tabler-icon-diamond-filled.svg

Contribute Materials

Your contribution can guide someone’s learning journey. Share your documents today.
Document Page
Financial Analysis
1
tabler-icon-diamond-filled.svg

Secure Best Marks with AI Grader

Need help grading? Try our AI Grader for instant feedback on your assignments.
Document Page
Contents
Introduction......................................................................................................................................3
Part A: Ratio Analysis of the Watley Company..............................................................................3
Liquidity Analysis........................................................................................................................3
Activity Analysis..........................................................................................................................3
Profitability Analysis...................................................................................................................4
Solvency / Gearing Analysis........................................................................................................5
Part B: Financial Analysis...............................................................................................................5
Recommendation and conclusion....................................................................................................6
References........................................................................................................................................7
2
Document Page
Introduction
In every business, there is always a concern for the financial performance and what
measures are needed to improve the financial performance of the organization. There are many
ways to analyse the business performance and among them ratio analysis is very useful as it
helps to evaluate the performance of the current year as well it helps to compare it with the
financial performance of previous years. In this report financial performance of the Watley
Company has evaluated using the ratio analysis in part A and comments are made on the
financial performance of the company in part B with some recommendation.
Part A: Ratio Analysis of the Watley Company
Liquidity Analysis
Liquidity analysis helps in ascertaining the short term financial health of the company
and provides the information on how the company manages the payments in respect to the
current liabilities. Some of the important ratios of the liquidity analysis are current ratio, quick
ratio, and working capital ratio. In this report there is need to calculate the ratio for each category
so current ratio has been selected (Bender, 2013).
Current Ratio: It is very important liquidity ratio as it provides availability of the current assets
over the current liabilities. Current ratio measures the liquidity performance of the company
provides the information about the short term performance in respect to payment required to
make to suppliers and other short term liabilities.
Formula: Current Assets/Current Liabilities
3
Document Page
Watley Company Financial Data
Years
Financial Items 2014 2015
Current Assets £ 300,000.00 £ 480,000.00
Current Liabilities £ 270,000.00 £ 210,000.00
Current Ratio 1.11 2.29
Activity Analysis
In order to carry out the business there is need to carry out various activities in order to
have sufficient flow of cash and other resources in the business process. Some of the important
activities that business performed to maintain proper flow of cash in the business are inventory
management, debtors’ management and creditors’ management. In this respect some of
important activity ratios are inventory turnover ratio, debtors turnover ratio etc. In this analysis
debtors turnover ratio will be calculated to notice the performance of the company in respect to
collection of outstanding amount form the debtors (Besley and Brigham, 2014).
Debtors’ turnover ratio or accounts receivable turnover ratio: This ratio is very important from
financial performance point of view as it provides information on frequently company collects
their outstanding debt amount from their customers in order to have proper flow of cash in the
business.
Formula: Average Credit sales or Sales /Account Receivable or Debtors
Watley Company Financial Data
4
tabler-icon-diamond-filled.svg

Secure Best Marks with AI Grader

Need help grading? Try our AI Grader for instant feedback on your assignments.
Document Page
Years
Financial Items 2014 2015
Account Receivable £ 160,000.00 £ 260,000.00
Sales £ 3,290,000.00 £ 3,520,000.00
Debtors’ turnover ratio 20.56 13.54
Profitability Analysis
Profitability analysis aims to examine the earning capacity of the company through
effective use of the resources of the company. Company procures various inventory and fixed
assets to manufacture the desired product and services in order to supply them to the customers.
Proper management of assets will help the company to earn the maximum sales revenue and
provide increase in the profit for the shareholders. In order provide the profitability analysis, the
return on asset ratio has been calculated as it is very important ratio in this segment (Brigham
and Ehrhardt, 2007).
Return on Assets: In this ratio return means the percentage of profit earned using the resources of
the business. As the ratio is in relation of the assets, this ratio will provide information regarding
the percentage of the profit earned on the assets of the company. Here profit means the net profit
of the company and asset means total assets i.e. both fixed assets and current assets.
Formula: Net Profit/Total Assets
Watley Company Financial Data
Years
5
Document Page
Financial Items 2014 2015
Net Profit £ 400,000.00 £ 300,000.00
Total Assets £ 1,550,000.00 £ 1,630,000.00
Return on Assets 25.81% 18.40%
Solvency / Gearing Analysis
Capital structure in the any business organization plays very important role in the
profitability of the company. There are mainly two types of capital, debt capital and equity
capital. Equity capital refers to the owner capitals and there is no fixed charge on this capital. On
the other hand debt capital is the borrowed capital and company has charge on the profit in form
of the interest. Debt equity ratio will be calculated in this analysis to check the percentage of debt
as compare to equity capital (Henderson, 2015).
Debt Equity Ratio: This ratio tells the percentage of debt capital as against the equity capital.
Lower debt capital in comparison to the equity capital shows that company depends on the
equity capital mainly and more profit available for distribution to the shareholder’s of the
company.
Formula: Debt /Equity
Watley Company Financial Data
Years
Financial Items 2014 2015
Debt £ 200,000.00 £ 200,000.00
6
Document Page
Equity £ 1,080,000.00 £ 1,220,000.00
Debt Equity Ratio 18.52% 16.39%
Part B: Financial Analysis
In this part, critical analysis of the above calculated ratios will be done:
Current Ratio: Current ratio of the company was 1.11 times in year 2014 and it was
increased to 2.29 times in year 2015 that indicates that there is significant increase in the
current assets of the company as against current liabilities. So it can be said that liquidity
performance of the company is very strong in year 2015 as compared to year 2016.
Although, it can be said that in both years company has been successfully able to meet
the current liabilities expenses.
Debtor’s turnover ratio: The debtor’s turnover ratio is 20.56 times in year 2014 and it was
further reduced to 13.54 times in year 2015 that indicates that company activity
efficiency is reduced in year 2015 as compared to year 2014.
Return on Assets: Company has earned the profit of 25.81 % in year 2014 and it was
reduced to 18.40 % in year 2015. It can be said that profitability of the company in
respect to return on assets was good but there has been too much decline in profitability
percentage in year 2015 as compared to year 2014.
Debt Equity Ratio: Debt equity ratio is 18.52 % in year 2014 and got reduced to 16.39 %
in year 2015. It can be said that capital formation of the company was excellent in both
7
tabler-icon-diamond-filled.svg

Paraphrase This Document

Need a fresh take? Get an instant paraphrase of this document with our AI Paraphraser
Document Page
the years and there is positive decline in year 2015 that shows positive change in the
capital formation of the company.
Recommendation and conclusion
On the basis of the overall analysis it is advised to the company to make proper strategies
to collect the accounts receivable in shorter period of time in order to improve the debtor’s
turnover ratio. There seem that company profit has declined in year 2015, so it is advised to have
proper control on the expenses of the company like cost of sales and salaries & wages has
increased a lot in year 2015 as compared to year 2014, that can be easily controlled if proper
measures taken.
8
chevron_up_icon
1 out of 8
circle_padding
hide_on_mobile
zoom_out_icon
logo.png

Your All-in-One AI-Powered Toolkit for Academic Success.

Available 24*7 on WhatsApp / Email

[object Object]