Comprehensive Report: Analyzing Watley's Financial Performance
VerifiedAdded on 2023/06/08
|8
|2065
|250
Report
AI Summary
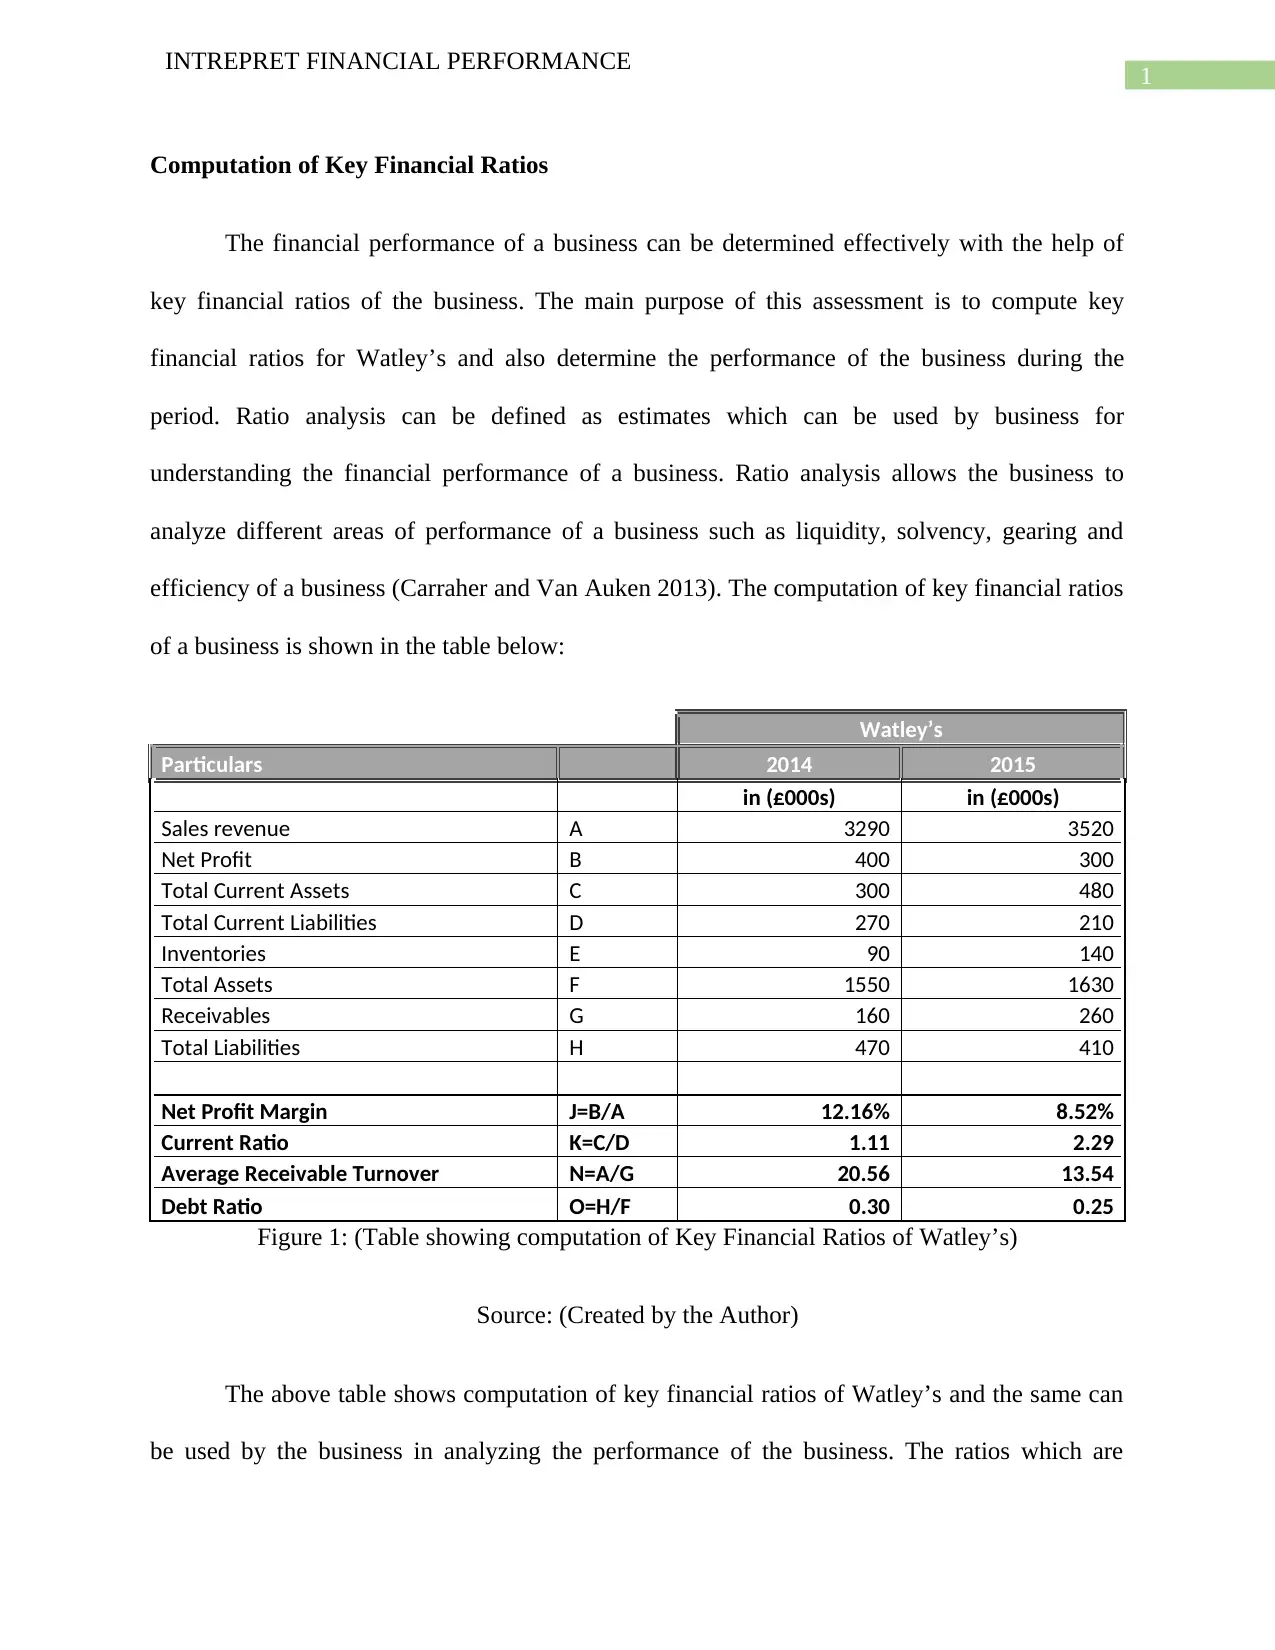
This report provides a comprehensive analysis of Watley's financial performance using key financial ratios for the years 2014 and 2015. It computes and analyzes ratios such as net profit margin, current ratio, average receivable turnover, and debt ratio to assess the company's profitability, liquidity, efficiency, and solvency. The analysis reveals a decrease in net profit margin from 12.16% in 2014 to 8.52% in 2015, indicating a potential issue with sales or cost management. The current ratio improved significantly, suggesting better liquidity. However, the average receivable turnover decreased, pointing to reduced efficiency in debt collection. The debt ratio also slightly decreased, indicating a reduction in debt. The report concludes with management recommendations to improve profitability and efficiency.

Running head: INTERPRET FINANCIAL PERFORMANCE
Interpret Financial Performance
Name of the Student:
Name of the University:
Author’s Note:
Interpret Financial Performance
Name of the Student:
Name of the University:
Author’s Note:
Paraphrase This Document
Need a fresh take? Get an instant paraphrase of this document with our AI Paraphraser

1
INTREPRET FINANCIAL PERFORMANCE
Computation of Key Financial Ratios
The financial performance of a business can be determined effectively with the help of
key financial ratios of the business. The main purpose of this assessment is to compute key
financial ratios for Watley’s and also determine the performance of the business during the
period. Ratio analysis can be defined as estimates which can be used by business for
understanding the financial performance of a business. Ratio analysis allows the business to
analyze different areas of performance of a business such as liquidity, solvency, gearing and
efficiency of a business (Carraher and Van Auken 2013). The computation of key financial ratios
of a business is shown in the table below:
Watley’s
Particulars 2014 2015
in (£000s) in (£000s)
Sales revenue A 3290 3520
Net Profit B 400 300
Total Current Assets C 300 480
Total Current Liabilities D 270 210
Inventories E 90 140
Total Assets F 1550 1630
Receivables G 160 260
Total Liabilities H 470 410
Net Profit Margin J=B/A 12.16% 8.52%
Current Ratio K=C/D 1.11 2.29
Average Receivable Turnover N=A/G 20.56 13.54
Debt Ratio O=H/F 0.30 0.25
Figure 1: (Table showing computation of Key Financial Ratios of Watley’s)
Source: (Created by the Author)
The above table shows computation of key financial ratios of Watley’s and the same can
be used by the business in analyzing the performance of the business. The ratios which are

2
INTREPRET FINANCIAL PERFORMANCE
shown in the table above comprises of Net profit margin, Current ratio, Average Receivable
turnover ratio and Debt ratio of a business (Delen, Kuzey and Uyar 2013). The ratios of the
business effectively show the performance of the business for two years which are 2014 and
2015. The table which is shown above considers key financial information which is related to the
business for the year and on the basis of such information the ratios which are shown in the
above table is computed.
Part 2
Analysis of Key Ratios
The main purpose of this part is to analyze the ratios which are computed in figure 1
shown above and also interpret the financial performance of the business on the basis of the
ratios which are computed in the above figure. Ratio analysis is an important tool which helps
businesses to not only measure the performance of the business in different areas but also has a
significant role in decision making process (Weygandt, Kimmel and Kieso 2015). As the ratios
cover specific areas of liquidity, solvency, gearing and efficiency. The ratios which are shown in
the above table covers different area for performance of the business.
The net profit of the business is shown to be 12.16% for the year 2014 and the same is
shown to be 8.52% in 2015. The net profit ratio of the business is considered to be an important
financial indictor of business and investors are always looking for a positive net profit margin
and also looking for growth in net profit margin of the business. The net profit of Watley’s is
shown to have decreased in comparison to previous years estimate which is calculated in the
above table. This is not a good sign for the business and the management of the company needs
to effectively formulate a strategy which can improve the profitability of the business (Tayeh,
⊘ This is a preview!⊘
Do you want full access?
Subscribe today to unlock all pages.

Trusted by 1+ million students worldwide

3
INTREPRET FINANCIAL PERFORMANCE
Al-Jarrah and Tarhini 2015). The profitability of the business is considered by potential investors
before they take any decisions regarding investments in a business. The fall in the net profit of
the business can be attributed to the fall in the sales which is achieved by the business during the
period. The income statement of the business shows that the main source of revenue for the
business is through sales and the same is shown to be £ 3,520,000 for the year 2015 and the same
has decreased significantly from the estimate which is shown in 2014. Another reason for fall in
the profitability of the business can also be due to high costs of production incurred by the
business which would result in fall in the net profits and thereby result in the fall in the net profit
margin of the business (Geng, Bose and Chen 2015). In general circumstances, the higher the net
profit margin for a business, the more favorable is the results which is achieved by the business
and the management of Watley’s need to form strategies in order to improve the sales and costs
structure of the business.
The current ratio which is shown in the above table is associated with the liquidity of the
business and is considered to be one of the important indicators for overall performance of the
business. The current ratio of the business is shown to be 1.11 in 2014 and the same has
increased in 2015 and shown to be 2.29. This shows that the liquidity position of the business has
improved significantly in comparison to previous year analysis. The liquidity position of a
business is considered to be an important aspect of a business and the operations which are
carried out on the basis of the liquidity of the business (Gitman, Juchau and Flanagan 2015). The
current ratio of a business is shown to have increased in the current year and this also suggest
that the business can effectively meet the current obligations of the business. The ratio also
shows the ability of the business to raise funds for any projects or operations of the business and
maintain the operations of the business. In general terms, the current ratio of a business considers
Paraphrase This Document
Need a fresh take? Get an instant paraphrase of this document with our AI Paraphraser

4
INTREPRET FINANCIAL PERFORMANCE
the current assets and current liabilities of the business and if the current assets of the business
are more than the current liabilities of the business, the liquidity position of the business is
shown to be favorable. An ideal estimate for current ratio should be 2:1 and the estimate which is
computed for 2015 is shown to be 2.29 which confirms the fact that the current ratio of the
business is ideal in all respect. Therefore, the liquidity position of Watley’s is shown to be
favorable for the business.
The average receivable turnover ratio of the business is covered under efficiency ratio of
a business and the same is shown to have decreased slightly in comparison to the estimates
which are shown for previous year. The efficiency of the business is shown to have reduced
significantly in comparison to previous year. The average turnover ratio of the business is shown
to be 20.56 in the year 2014 and the same is shown to be 13.54 in 2015. The management of the
company needs to effectively formulate strategies which can help the business to improve the
efficiency structure of the business (Bentley et al. 2013). The average receivable turnover ratio is
associated with the collections from the debtors of the business and the same is shown to have
fallen. This also shows that there has been change in the debtor’s policy of the business and the
efficiency of the business is affected due to such a situation. There is scope of bringing about
improvement in the efficiency structure of the business which would help the business to
generate more profitability in the business.
The debt ratio of a business shows the gearing aspect in the business and the use of debt
capital in the capital structure if a business. Any increase in the debt ratio of the business suggest
that the management of the business is incorporating more of debt capital in the capital structure
of the business. The debt of the business is shown to have reduced slightly in comparison to the
estimate which is shown for previous year. The debt ratio for the year 2015 is shown to be 0.25

5
INTREPRET FINANCIAL PERFORMANCE
which has slightly decreased from the estimate which is shown for 2014. This suggest that the
management of the business has effectively repaid a portion of debt of the business. This also
signifies that the business is trying to make changes in the capital structure of the business and
also at the same time also reduce the risks of the business.
Management Decision
The management of the business needs to improve the profitability of the business which
can be done by either increasing the sales of the business or reducing the overall costs of the
business. The sales of the business are shown to have fallen significantly in comparison to
previous year estimate and the management should formulate a plan to increase the sales of the
business and thereby also generate higher revenues for the business (Storey et al. 2016). The
liquidity position of the business is shown to be appropriate and the same suggest that the
management can undertake any projects which requires appropriate amount of funds and it also
suggest that the management is effectively able to handle all current obligations of the business
(Ehrhardt and Brigham 2016). The efficiency of the business has fallen slightly as shown in the
table above and the management needs to formulate strategy in order to improve the efficiency
of the business. This can be achieved by implementing proper supervision and control in the
business.
The management needs to take appropriate steps to set up a proper internal control
system in the business so that the operational structure of the business can be improved and also
bring about efficiency in the operations. The gearing ratio of the business is shown by debt ratio
which is shown to have reduce in 2015 which suggest that the management is making changes to
the capital structure of the business and repaying a portion of debt capital of the business.
⊘ This is a preview!⊘
Do you want full access?
Subscribe today to unlock all pages.

Trusted by 1+ million students worldwide

6
INTREPRET FINANCIAL PERFORMANCE
Reference
Bentley, K.A., Omer, T.C. and Sharp, N.Y., 2013. Business strategy, financial reporting
irregularities, and audit effort. Contemporary Accounting Research, 30(2), pp.780-817.
Carraher, S. and Van Auken, H., 2013. The use of financial statements for decision making by
small firms. Journal of Small Business & Entrepreneurship, 26(3), pp.323-336.
Delen, D., Kuzey, C. and Uyar, A., 2013. Measuring firm performance using financial ratios: A
decision tree approach. Expert Systems with Applications, 40(10), pp.3970-3983.
Ehrhardt, M.C. and Brigham, E.F., 2016. Corporate finance: A focused approach. Cengage
learning.
Geng, R., Bose, I. and Chen, X., 2015. Prediction of financial distress: An empirical study of
listed Chinese companies using data mining. European Journal of Operational Research, 241(1),
pp.236-247.
Gitman, L.J., Juchau, R. and Flanagan, J., 2015. Principles of managerial finance. Pearson
Higher Education AU.
Storey, D.J., Keasey, K., Watson, R. and Wynarczyk, P., 2016. The performance of small firms:
Profits, jobs and failures. Routledge.
Paraphrase This Document
Need a fresh take? Get an instant paraphrase of this document with our AI Paraphraser

7
INTREPRET FINANCIAL PERFORMANCE
Tayeh, M., Al-Jarrah, I.M. and Tarhini, A., 2015. Accounting vs. market-based measures of firm
performance related to information technology investments. International Review of Social
Sciences and Humanities, 9(1), pp.129-145.
Weygandt, J.J., Kimmel, P.D. and Kieso, D.E., 2015. Financial & managerial accounting. John
Wiley & Sons.
1 out of 8