Financial Analysis Report: Watley's Manufacturing Company Performance
VerifiedAdded on 2022/02/15
|8
|2535
|13
Report
AI Summary
This report presents a financial analysis of Watley's Manufacturing Company, focusing on its performance in 2014 and 2015. The analysis employs four key financial ratios: liquidity, gearing, activity, and profitability. Liquidity ratios, including the current and quick ratios, indicate Watley's strong ability to meet short-term obligations. Gearing ratios demonstrate a low level of financial risk, suggesting a financially secure position. Activity ratios reveal an increase in inventory, implying slower sales than anticipated. Finally, the profitability ratios, specifically the ROCE, highlight a slight decline in profit margins, suggesting areas for improvement. The report concludes with recommendations for Watley's to enhance its financial performance by improving its revenue and decreasing expenses.
Financial Analysis for Watley’s Manufacturing Company
Intro:
Financial statements are reports that include statistics and information about the company and aid
management in evaluating the financial activities of the organization. by implementing the use of
financial ratio analysis, these statements help forecast the company's future growth. Financial ratios can
be used to evaluate a company's financial health.
Financial ratios can also measure the performance of a company for a certain accounting period and can
anticipate what the financial performance of the firm will be in the future. However, using ratio analysis
as a performance evaluation tool has a few drawbacks, since the figure that they provide are absolute
and not relative thus sometimes offering misleading information.
To begin with, the data derived from the previous accounting year's financial statements is underlined
as historical data, which implies that organizations cannot be certain that the same figures from
previous performance analysis would be maintained in the future. As a result, a ratio study for a single
period cannot always predict the company's performance would have the same corresponding future as
it had before. Furthermore, because financial statements are produced on a regular basis, another
limitation could be inflation within the market which they play a part in.
If there is inflation within the periods of accounting, the real prices will not be represented in the
financial accounts, making comparisons between periods impossible.The four basic categories of
financial ratios are as stated liquidity ratios, gearing ratios, activity ratios, and profitability ratios. The
goal of this article is to use these four financial ratios to analyze Watley's financial performance. In a
nutshell, Watley's is a tiny furniture manufacturing firm established in England that has 52 people and
specializes employed they specialize in putting together high-end furniture.
Overall, a financial analysis for Watley's will be undertaken in this report, with financial ratios being used
to calculate and then assess data for the years 2014 and 2015. This study evaluates the topic using both
primary and secondary data. Academic literature and financial information from Watley's Manufacturing
Company were used to compile the statistical results. Finally, a conclusion will be reached regarding the
company's financial health and what Watley's should change for the better of the companies financial
future.
Ratio Analysis:
Liquidity Ratios:
Liquidity ratios are used by businesses to assess their cash situation and ability to pay off
all of their short-term commitments. Thus a company's liquidity is defined by how fast it
can liquidate assets, or how it's assets can be converted into cash quickly(Atrill and
McLaney, 2019). The Current and Quick Ratios, are the two most critical liquidity ratios.
The current ratio, on the one hand, assesses a company's capacity to pay current
liabilities with current assets. To put it differently, the current ratio examines the
Paraphrase This Document
Need a fresh take? Get an instant paraphrase of this document with our AI Paraphraser
Financial Analysis for Watley’s Manufacturing Company
company's liquid assets and compares them to its current liabilities (Armstrong, 2018).
The current ratio formula is caulcutated as followed:
Current Ratio=Current Assets ÷ Current Liabilities.
The fast ratio, on the other hand, allows a corporation to test its liquidity more
precisely. This ratio assesses a company's liquidity without requiring any goods to be
sold (Rashid, 2018). The quick ratio formula is as follows:
Quick Ratio= (Current Assets – Closing Stock) ÷ Current Liabilities.
When a company evaluates its liquidity, it must take into considration a number of
elements, including the company's own operations, its rivals, and the industry in which
it operates. A company with a low ratio, less than one, indicates that revenues are
falling. It means the company's assets are less than its liabilities, and as a result, it won't
be able to pay off its short-term bills (Atrill, Harvey and McLaney, 2002), And w hen the
ratio is greater than one, it indicates that the company is financially sound, meaning that
the present assets owned can be turned into cash to cover short-term debts (Atrill and
McLaney, 2019).
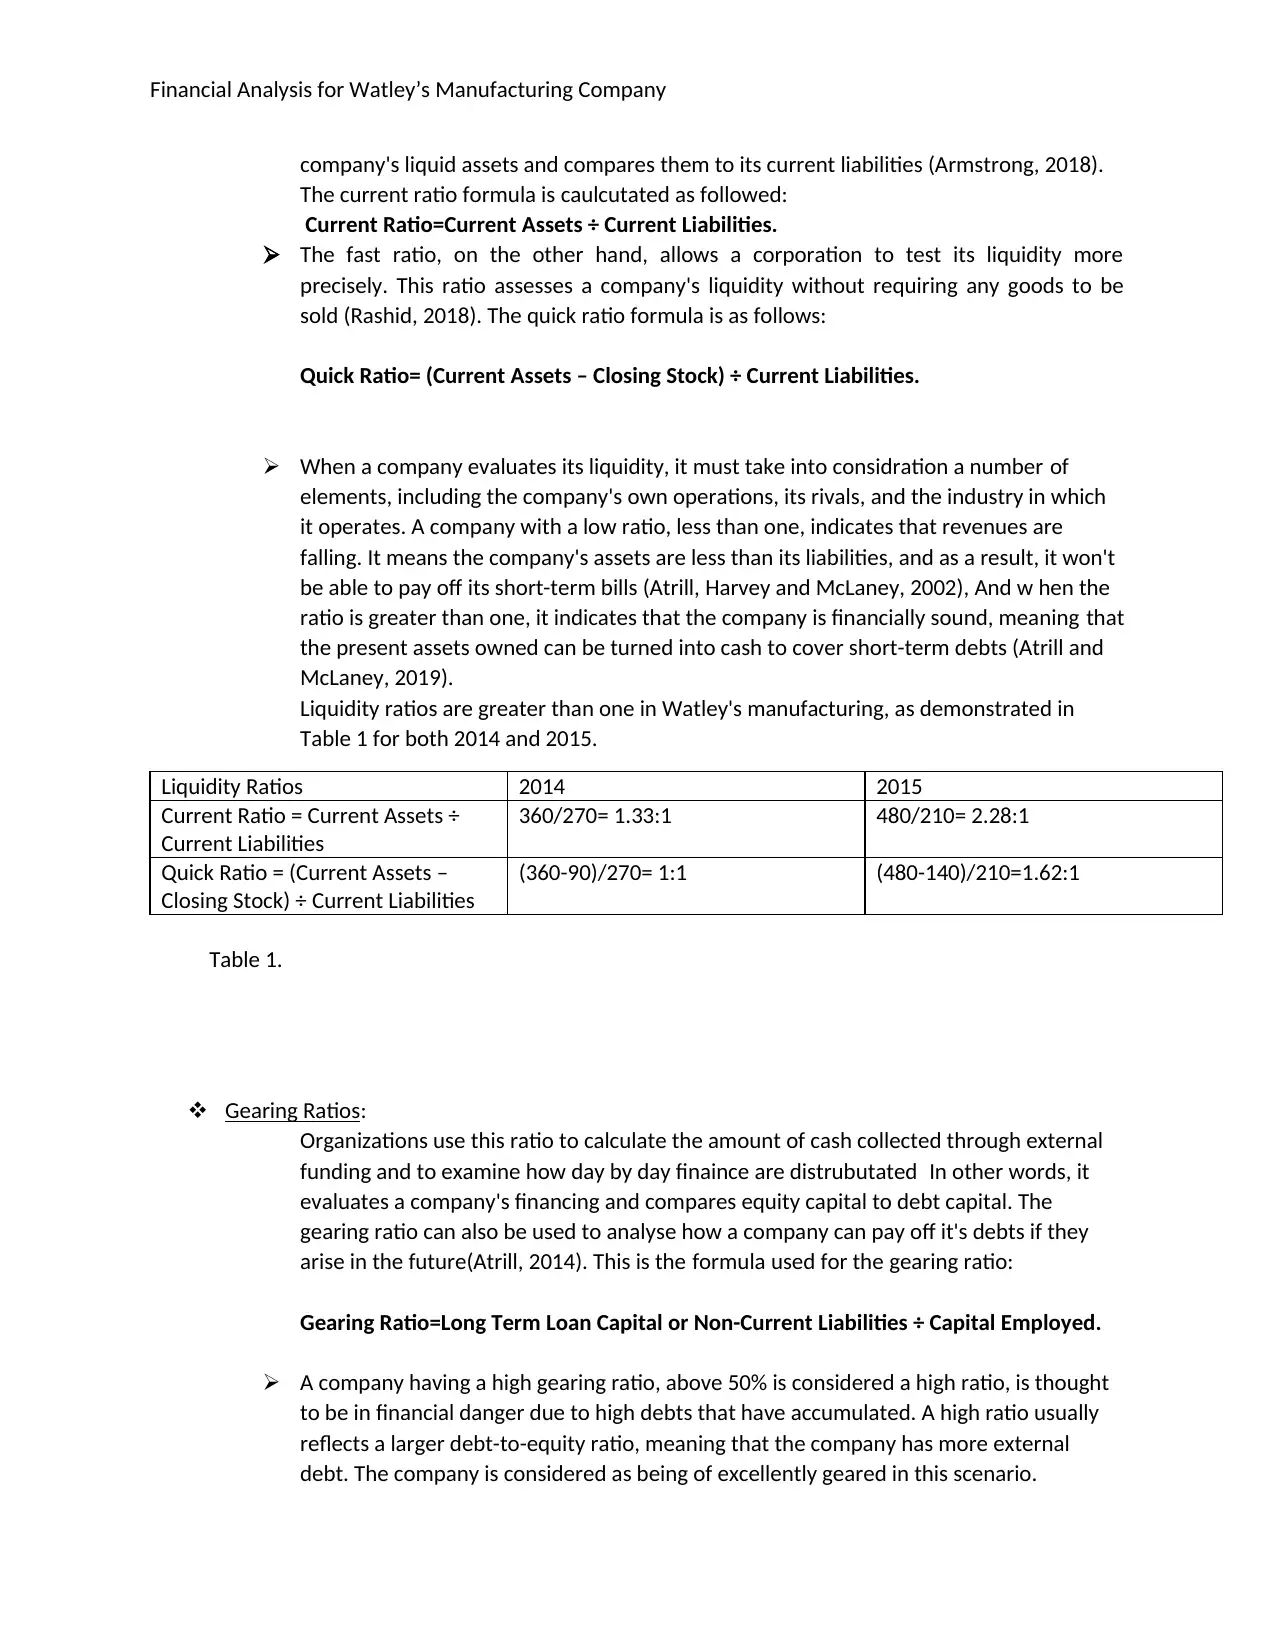
Liquidity ratios are greater than one in Watley's manufacturing, as demonstrated in
Table 1 for both 2014 and 2015.
Liquidity Ratios 2014 2015
Current Ratio = Current Assets ÷
Current Liabilities
360/270= 1.33:1 480/210= 2.28:1
Quick Ratio = (Current Assets –
Closing Stock) ÷ Current Liabilities
(360-90)/270= 1:1 (480-140)/210=1.62:1
Table 1.
Gearing Ratios:
Organizations use this ratio to calculate the amount of cash collected through external
funding and to examine how day by day finaince are distrubutated In other words, it
evaluates a company's financing and compares equity capital to debt capital. The
gearing ratio can also be used to analyse how a company can pay off it's debts if they
arise in the future(Atrill, 2014). This is the formula used for the gearing ratio:
Gearing Ratio=Long Term Loan Capital or Non-Current Liabilities ÷ Capital Employed.
A company having a high gearing ratio, above 50% is considered a high ratio, is thought
to be in financial danger due to high debts that have accumulated. A high ratio usually
reflects a larger debt-to-equity ratio, meaning that the company has more external
debt. The company is considered as being of excellently geared in this scenario.
company's liquid assets and compares them to its current liabilities (Armstrong, 2018).
The current ratio formula is caulcutated as followed:
Current Ratio=Current Assets ÷ Current Liabilities.
The fast ratio, on the other hand, allows a corporation to test its liquidity more
precisely. This ratio assesses a company's liquidity without requiring any goods to be
sold (Rashid, 2018). The quick ratio formula is as follows:
Quick Ratio= (Current Assets – Closing Stock) ÷ Current Liabilities.
When a company evaluates its liquidity, it must take into considration a number of
elements, including the company's own operations, its rivals, and the industry in which
it operates. A company with a low ratio, less than one, indicates that revenues are
falling. It means the company's assets are less than its liabilities, and as a result, it won't
be able to pay off its short-term bills (Atrill, Harvey and McLaney, 2002), And w hen the
ratio is greater than one, it indicates that the company is financially sound, meaning that
the present assets owned can be turned into cash to cover short-term debts (Atrill and
McLaney, 2019).
Liquidity ratios are greater than one in Watley's manufacturing, as demonstrated in
Table 1 for both 2014 and 2015.
Liquidity Ratios 2014 2015
Current Ratio = Current Assets ÷
Current Liabilities
360/270= 1.33:1 480/210= 2.28:1
Quick Ratio = (Current Assets –
Closing Stock) ÷ Current Liabilities
(360-90)/270= 1:1 (480-140)/210=1.62:1
Table 1.
Gearing Ratios:
Organizations use this ratio to calculate the amount of cash collected through external
funding and to examine how day by day finaince are distrubutated In other words, it
evaluates a company's financing and compares equity capital to debt capital. The
gearing ratio can also be used to analyse how a company can pay off it's debts if they
arise in the future(Atrill, 2014). This is the formula used for the gearing ratio:
Gearing Ratio=Long Term Loan Capital or Non-Current Liabilities ÷ Capital Employed.
A company having a high gearing ratio, above 50% is considered a high ratio, is thought
to be in financial danger due to high debts that have accumulated. A high ratio usually
reflects a larger debt-to-equity ratio, meaning that the company has more external
debt. The company is considered as being of excellently geared in this scenario.
Financial Analysis for Watley’s Manufacturing Company
Furthermore, a company with a low ratio, less than 25%, is thought to be more
financially sound because it has raised a large portion of its capital through equity. As a
result, it looks to pose fewer financial risks to outside investors and is classified as low
geared. Additionally, a gearing ratio of 25 to 50 percent is regarded standard and
indicates a solid, well-established business. Without a doubt, if the company's gearing
ratio is excessive, there are various options for lowering it and paying off the debt,
including selling stock, converting loans, or increasing profits (Atrill, Harvey and
McLaney, 2002).
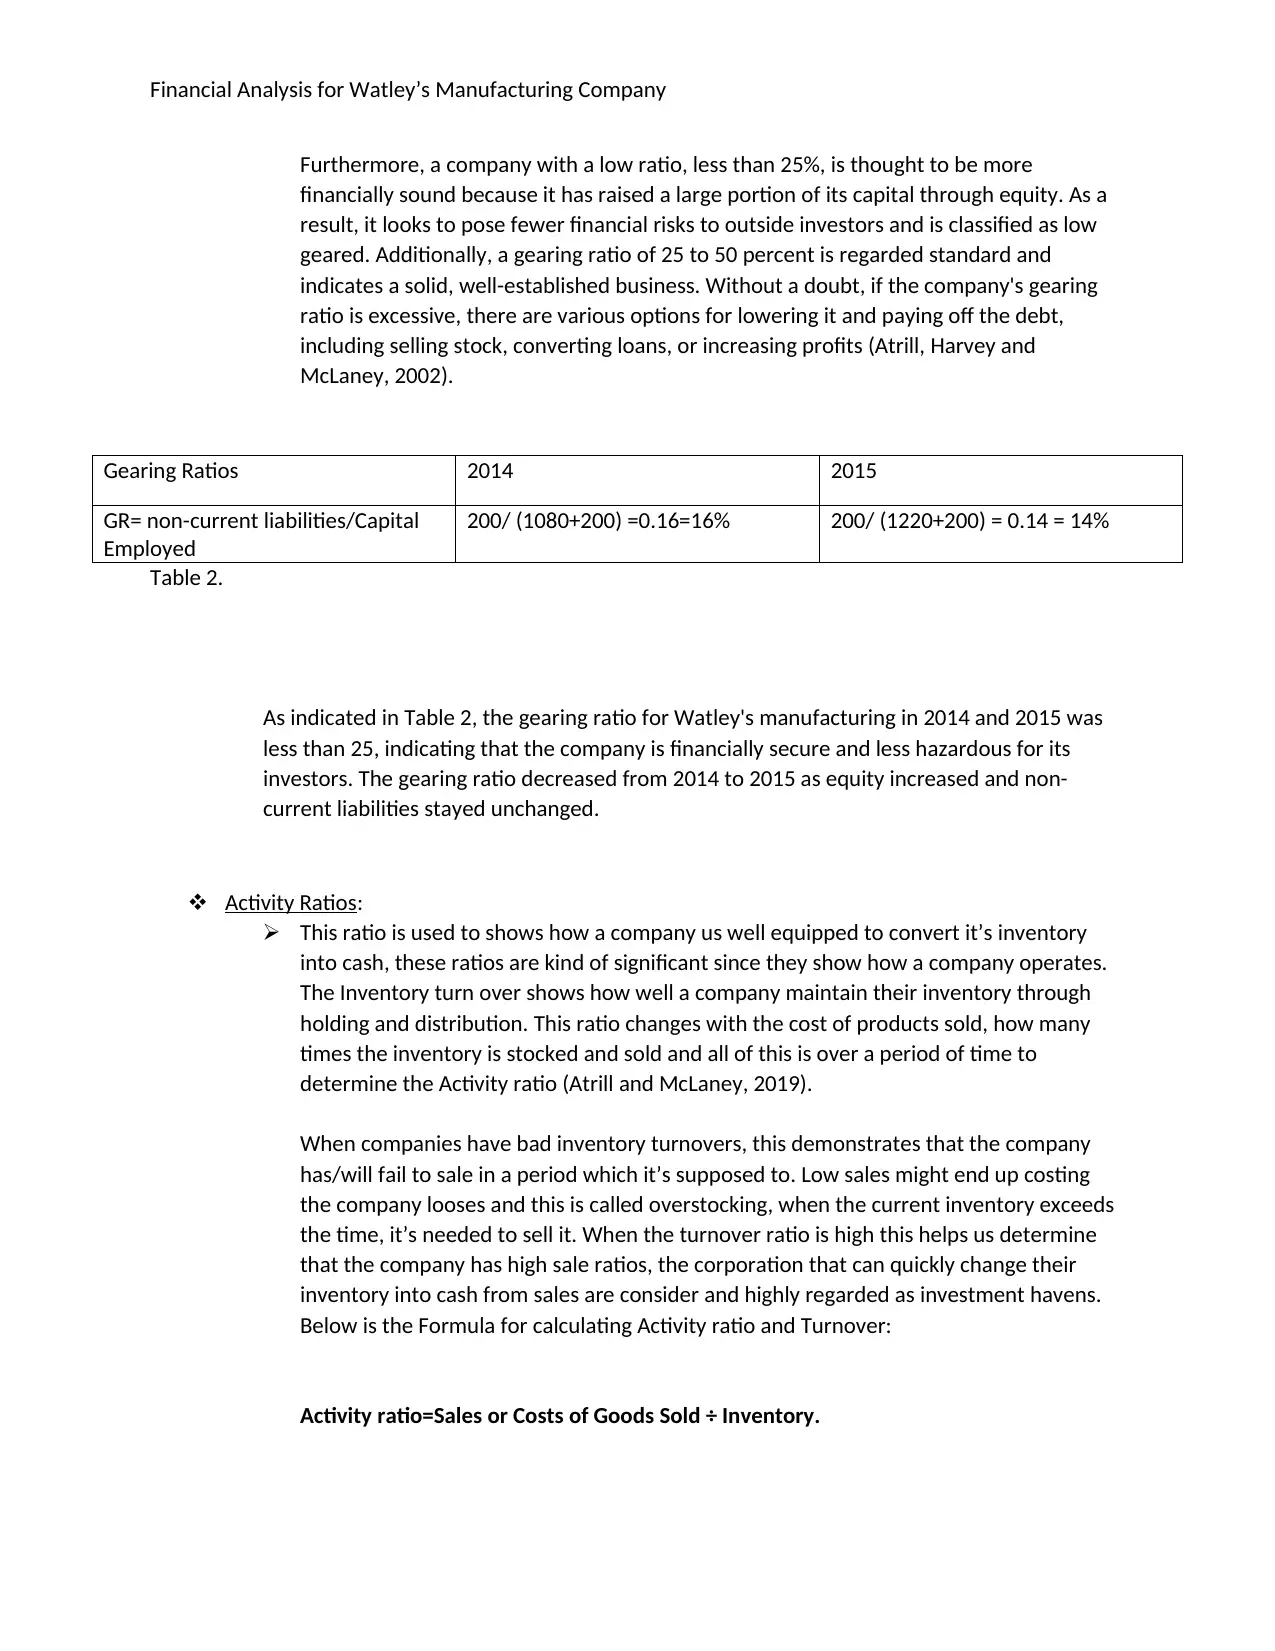
Gearing Ratios 2014 2015
GR= non-current liabilities/Capital
Employed
200/ (1080+200) =0.16=16% 200/ (1220+200) = 0.14 = 14%
Table 2.
As indicated in Table 2, the gearing ratio for Watley's manufacturing in 2014 and 2015 was
less than 25, indicating that the company is financially secure and less hazardous for its
investors. The gearing ratio decreased from 2014 to 2015 as equity increased and non-
current liabilities stayed unchanged.
Activity Ratios:
This ratio is used to shows how a company us well equipped to convert it’s inventory
into cash, these ratios are kind of significant since they show how a company operates.
The Inventory turn over shows how well a company maintain their inventory through
holding and distribution. This ratio changes with the cost of products sold, how many
times the inventory is stocked and sold and all of this is over a period of time to
determine the Activity ratio (Atrill and McLaney, 2019).
When companies have bad inventory turnovers, this demonstrates that the company
has/will fail to sale in a period which it’s supposed to. Low sales might end up costing
the company looses and this is called overstocking, when the current inventory exceeds
the time, it’s needed to sell it. When the turnover ratio is high this helps us determine
that the company has high sale ratios, the corporation that can quickly change their
inventory into cash from sales are consider and highly regarded as investment havens.
Below is the Formula for calculating Activity ratio and Turnover:
Activity ratio=Sales or Costs of Goods Sold ÷ Inventory.
Furthermore, a company with a low ratio, less than 25%, is thought to be more
financially sound because it has raised a large portion of its capital through equity. As a
result, it looks to pose fewer financial risks to outside investors and is classified as low
geared. Additionally, a gearing ratio of 25 to 50 percent is regarded standard and
indicates a solid, well-established business. Without a doubt, if the company's gearing
ratio is excessive, there are various options for lowering it and paying off the debt,
including selling stock, converting loans, or increasing profits (Atrill, Harvey and
McLaney, 2002).
Gearing Ratios 2014 2015
GR= non-current liabilities/Capital
Employed
200/ (1080+200) =0.16=16% 200/ (1220+200) = 0.14 = 14%
Table 2.
As indicated in Table 2, the gearing ratio for Watley's manufacturing in 2014 and 2015 was
less than 25, indicating that the company is financially secure and less hazardous for its
investors. The gearing ratio decreased from 2014 to 2015 as equity increased and non-
current liabilities stayed unchanged.
Activity Ratios:
This ratio is used to shows how a company us well equipped to convert it’s inventory
into cash, these ratios are kind of significant since they show how a company operates.
The Inventory turn over shows how well a company maintain their inventory through
holding and distribution. This ratio changes with the cost of products sold, how many
times the inventory is stocked and sold and all of this is over a period of time to
determine the Activity ratio (Atrill and McLaney, 2019).
When companies have bad inventory turnovers, this demonstrates that the company
has/will fail to sale in a period which it’s supposed to. Low sales might end up costing
the company looses and this is called overstocking, when the current inventory exceeds
the time, it’s needed to sell it. When the turnover ratio is high this helps us determine
that the company has high sale ratios, the corporation that can quickly change their
inventory into cash from sales are consider and highly regarded as investment havens.
Below is the Formula for calculating Activity ratio and Turnover:
Activity ratio=Sales or Costs of Goods Sold ÷ Inventory.
⊘ This is a preview!⊘
Do you want full access?
Subscribe today to unlock all pages.
Trusted by 1+ million students worldwide
Financial Analysis for Watley’s Manufacturing Company
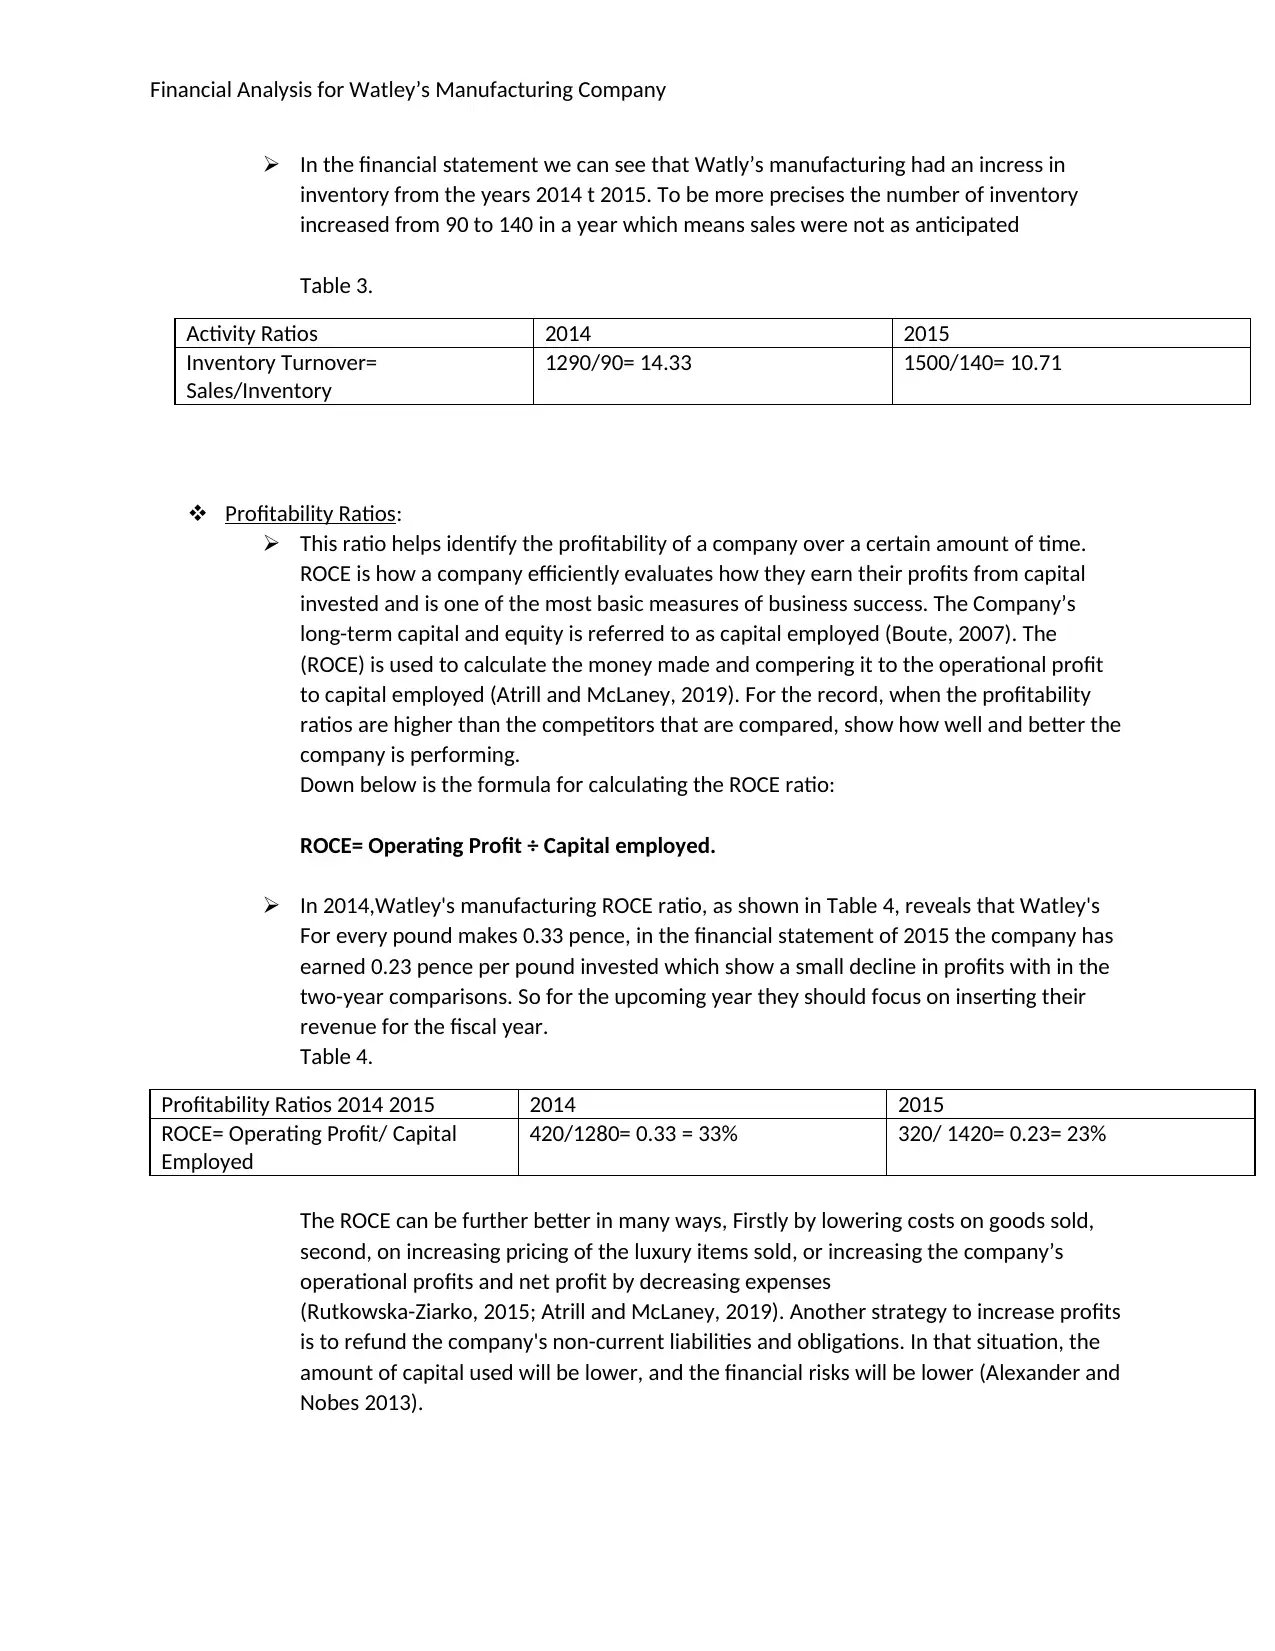
In the financial statement we can see that Watly’s manufacturing had an incress in
inventory from the years 2014 t 2015. To be more precises the number of inventory
increased from 90 to 140 in a year which means sales were not as anticipated
Table 3.
Activity Ratios 2014 2015
Inventory Turnover=
Sales/Inventory
1290/90= 14.33 1500/140= 10.71
Profitability Ratios:
This ratio helps identify the profitability of a company over a certain amount of time.
ROCE is how a company efficiently evaluates how they earn their profits from capital
invested and is one of the most basic measures of business success. The Company’s
long-term capital and equity is referred to as capital employed (Boute, 2007). The
(ROCE) is used to calculate the money made and compering it to the operational profit
to capital employed (Atrill and McLaney, 2019). For the record, when the profitability
ratios are higher than the competitors that are compared, show how well and better the
company is performing.
Down below is the formula for calculating the ROCE ratio:
ROCE= Operating Profit ÷ Capital employed.
In 2014,Watley's manufacturing ROCE ratio, as shown in Table 4, reveals that Watley's
For every pound makes 0.33 pence, in the financial statement of 2015 the company has
earned 0.23 pence per pound invested which show a small decline in profits with in the
two-year comparisons. So for the upcoming year they should focus on inserting their
revenue for the fiscal year.
Table 4.
Profitability Ratios 2014 2015 2014 2015
ROCE= Operating Profit/ Capital
Employed
420/1280= 0.33 = 33% 320/ 1420= 0.23= 23%
The ROCE can be further better in many ways, Firstly by lowering costs on goods sold,
second, on increasing pricing of the luxury items sold, or increasing the company’s
operational profits and net profit by decreasing expenses
(Rutkowska-Ziarko, 2015; Atrill and McLaney, 2019). Another strategy to increase profits
is to refund the company's non-current liabilities and obligations. In that situation, the
amount of capital used will be lower, and the financial risks will be lower (Alexander and
Nobes 2013).
Paraphrase This Document
Need a fresh take? Get an instant paraphrase of this document with our AI Paraphraser
Financial Analysis for Watley’s Manufacturing Company
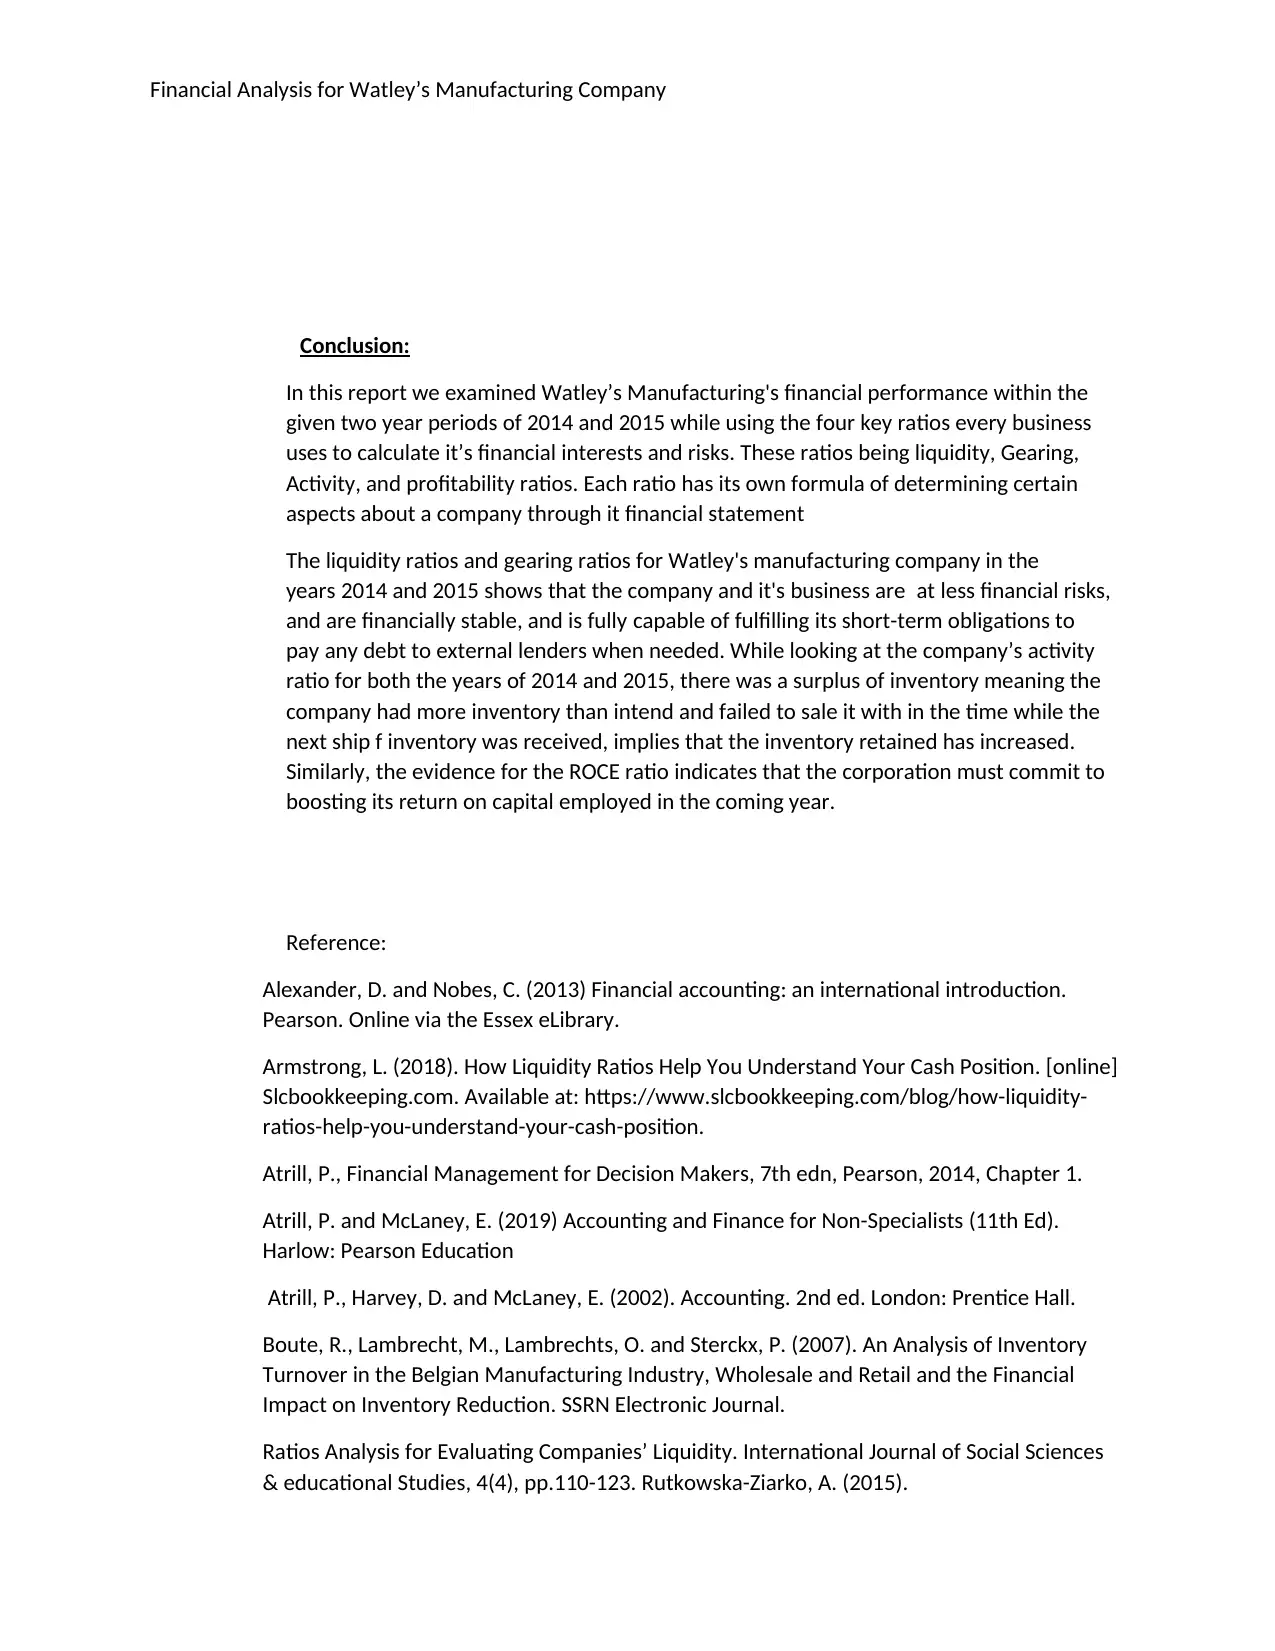
Conclusion:
In this report we examined Watley’s Manufacturing's financial performance within the
given two year periods of 2014 and 2015 while using the four key ratios every business
uses to calculate it’s financial interests and risks. These ratios being liquidity, Gearing,
Activity, and profitability ratios. Each ratio has its own formula of determining certain
aspects about a company through it financial statement
The liquidity ratios and gearing ratios for Watley's manufacturing company in the
years 2014 and 2015 shows that the company and it's business are at less financial risks,
and are financially stable, and is fully capable of fulfilling its short-term obligations to
pay any debt to external lenders when needed. While looking at the company’s activity
ratio for both the years of 2014 and 2015, there was a surplus of inventory meaning the
company had more inventory than intend and failed to sale it with in the time while the
next ship f inventory was received, implies that the inventory retained has increased.
Similarly, the evidence for the ROCE ratio indicates that the corporation must commit to
boosting its return on capital employed in the coming year.
Reference:
Alexander, D. and Nobes, C. (2013) Financial accounting: an international introduction.
Pearson. Online via the Essex eLibrary.
Armstrong, L. (2018). How Liquidity Ratios Help You Understand Your Cash Position. [online]
Slcbookkeeping.com. Available at: https://www.slcbookkeeping.com/blog/how-liquidity-
ratios-help-you-understand-your-cash-position.
Atrill, P., Financial Management for Decision Makers, 7th edn, Pearson, 2014, Chapter 1.
Atrill, P. and McLaney, E. (2019) Accounting and Finance for Non-Specialists (11th Ed).
Harlow: Pearson Education
Atrill, P., Harvey, D. and McLaney, E. (2002). Accounting. 2nd ed. London: Prentice Hall.
Boute, R., Lambrecht, M., Lambrechts, O. and Sterckx, P. (2007). An Analysis of Inventory
Turnover in the Belgian Manufacturing Industry, Wholesale and Retail and the Financial
Impact on Inventory Reduction. SSRN Electronic Journal.
Ratios Analysis for Evaluating Companies’ Liquidity. International Journal of Social Sciences
& educational Studies, 4(4), pp.110-123. Rutkowska-Ziarko, A. (2015).
Financial Analysis for Watley’s Manufacturing Company
The Influence of Profitability Ratios and Company Size on Profitability and Investment Risk in
the Capital Market. Folia Oeconomica Stetinensia, 15(1), pp.151-161.
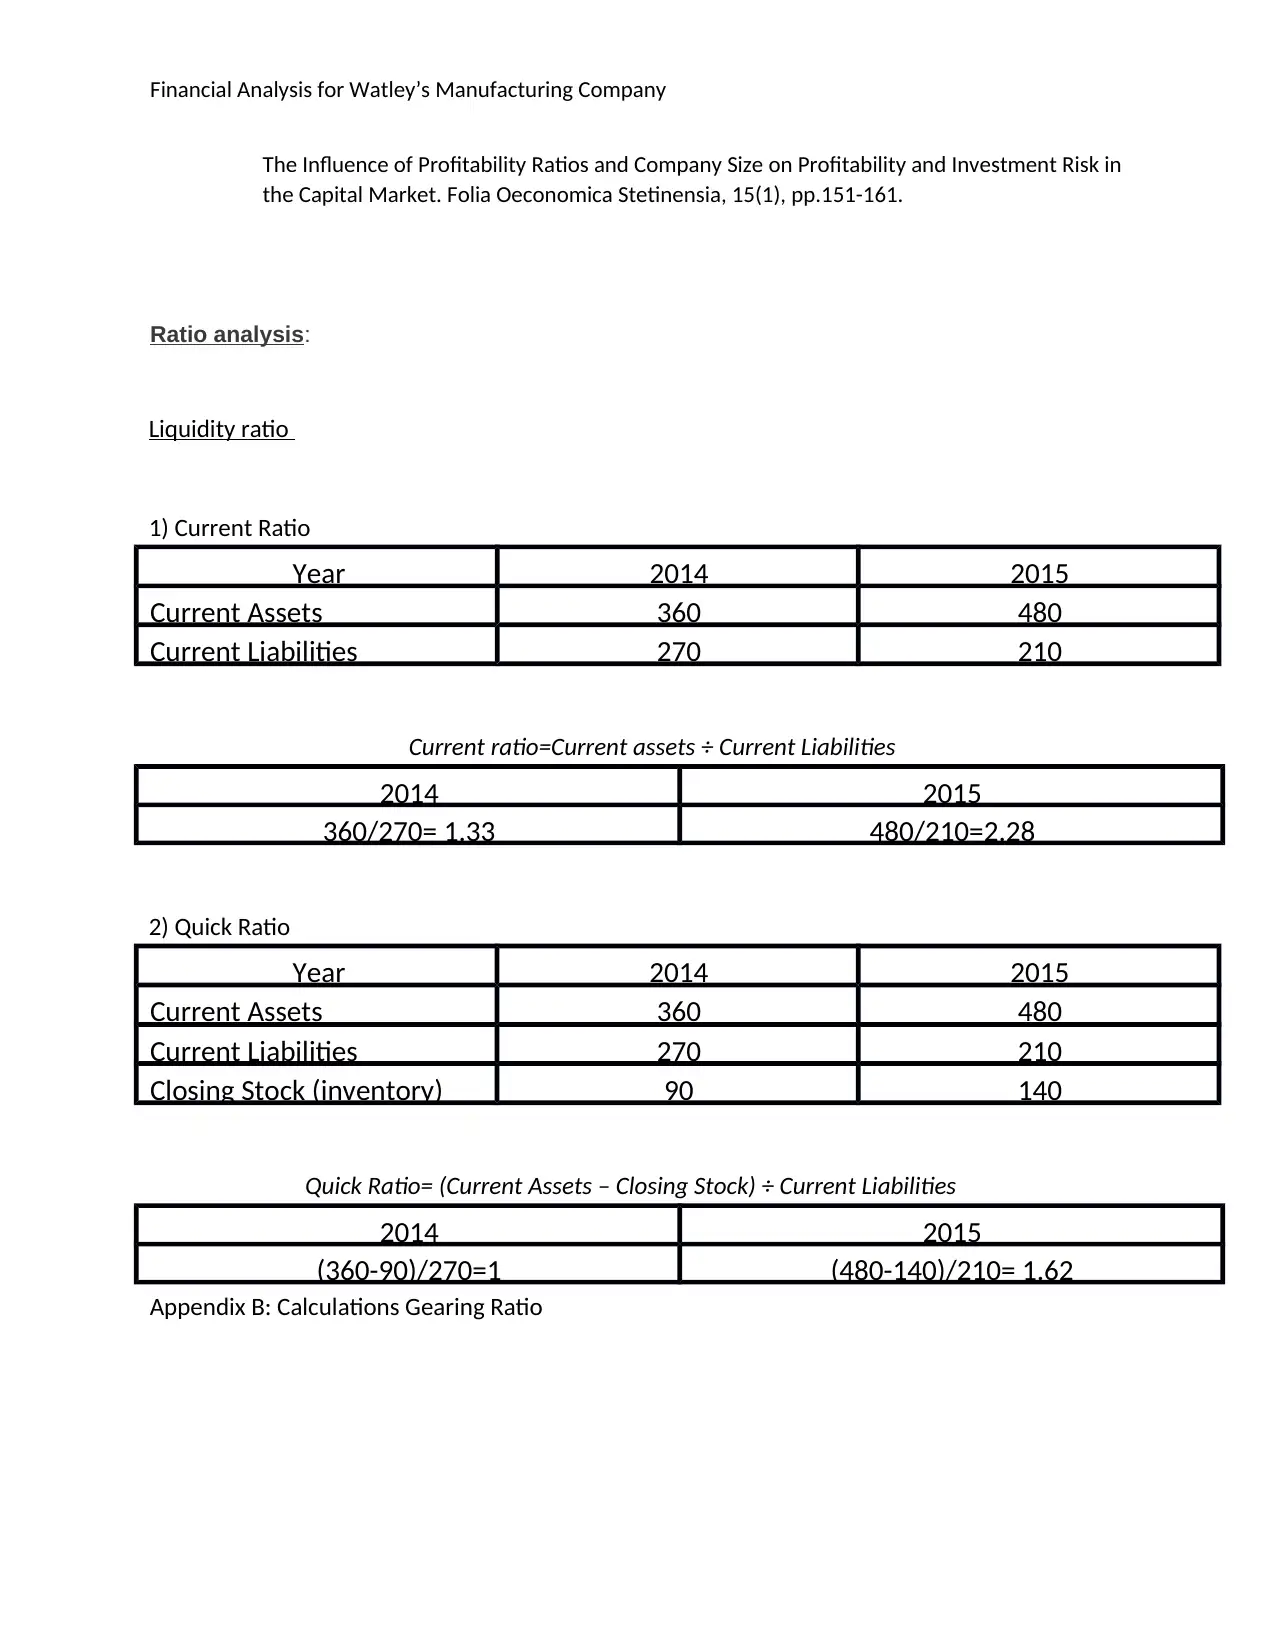
Ratio analysis:
Liquidity ratio
1) Current Ratio
Current ratio=Current assets ÷ Current Liabilities
2) Quick Ratio
Quick Ratio= (Current Assets – Closing Stock) ÷ Current Liabilities
Appendix B: Calculations Gearing Ratio
Year 2014 2015
Current Assets 360 480
Current Liabilities 270 210
2014 2015
360/270= 1.33 480/210=2.28
Year 2014 2015
Current Assets 360 480
Current Liabilities 270 210
Closing Stock (inventory) 90 140
2014 2015
(360-90)/270=1 (480-140)/210= 1.62
The Influence of Profitability Ratios and Company Size on Profitability and Investment Risk in
the Capital Market. Folia Oeconomica Stetinensia, 15(1), pp.151-161.
Ratio analysis:
Liquidity ratio
1) Current Ratio
Current ratio=Current assets ÷ Current Liabilities
2) Quick Ratio
Quick Ratio= (Current Assets – Closing Stock) ÷ Current Liabilities
Appendix B: Calculations Gearing Ratio
Year 2014 2015
Current Assets 360 480
Current Liabilities 270 210
2014 2015
360/270= 1.33 480/210=2.28
Year 2014 2015
Current Assets 360 480
Current Liabilities 270 210
Closing Stock (inventory) 90 140
2014 2015
(360-90)/270=1 (480-140)/210= 1.62
⊘ This is a preview!⊘
Do you want full access?
Subscribe today to unlock all pages.
Trusted by 1+ million students worldwide
Financial Analysis for Watley’s Manufacturing Company
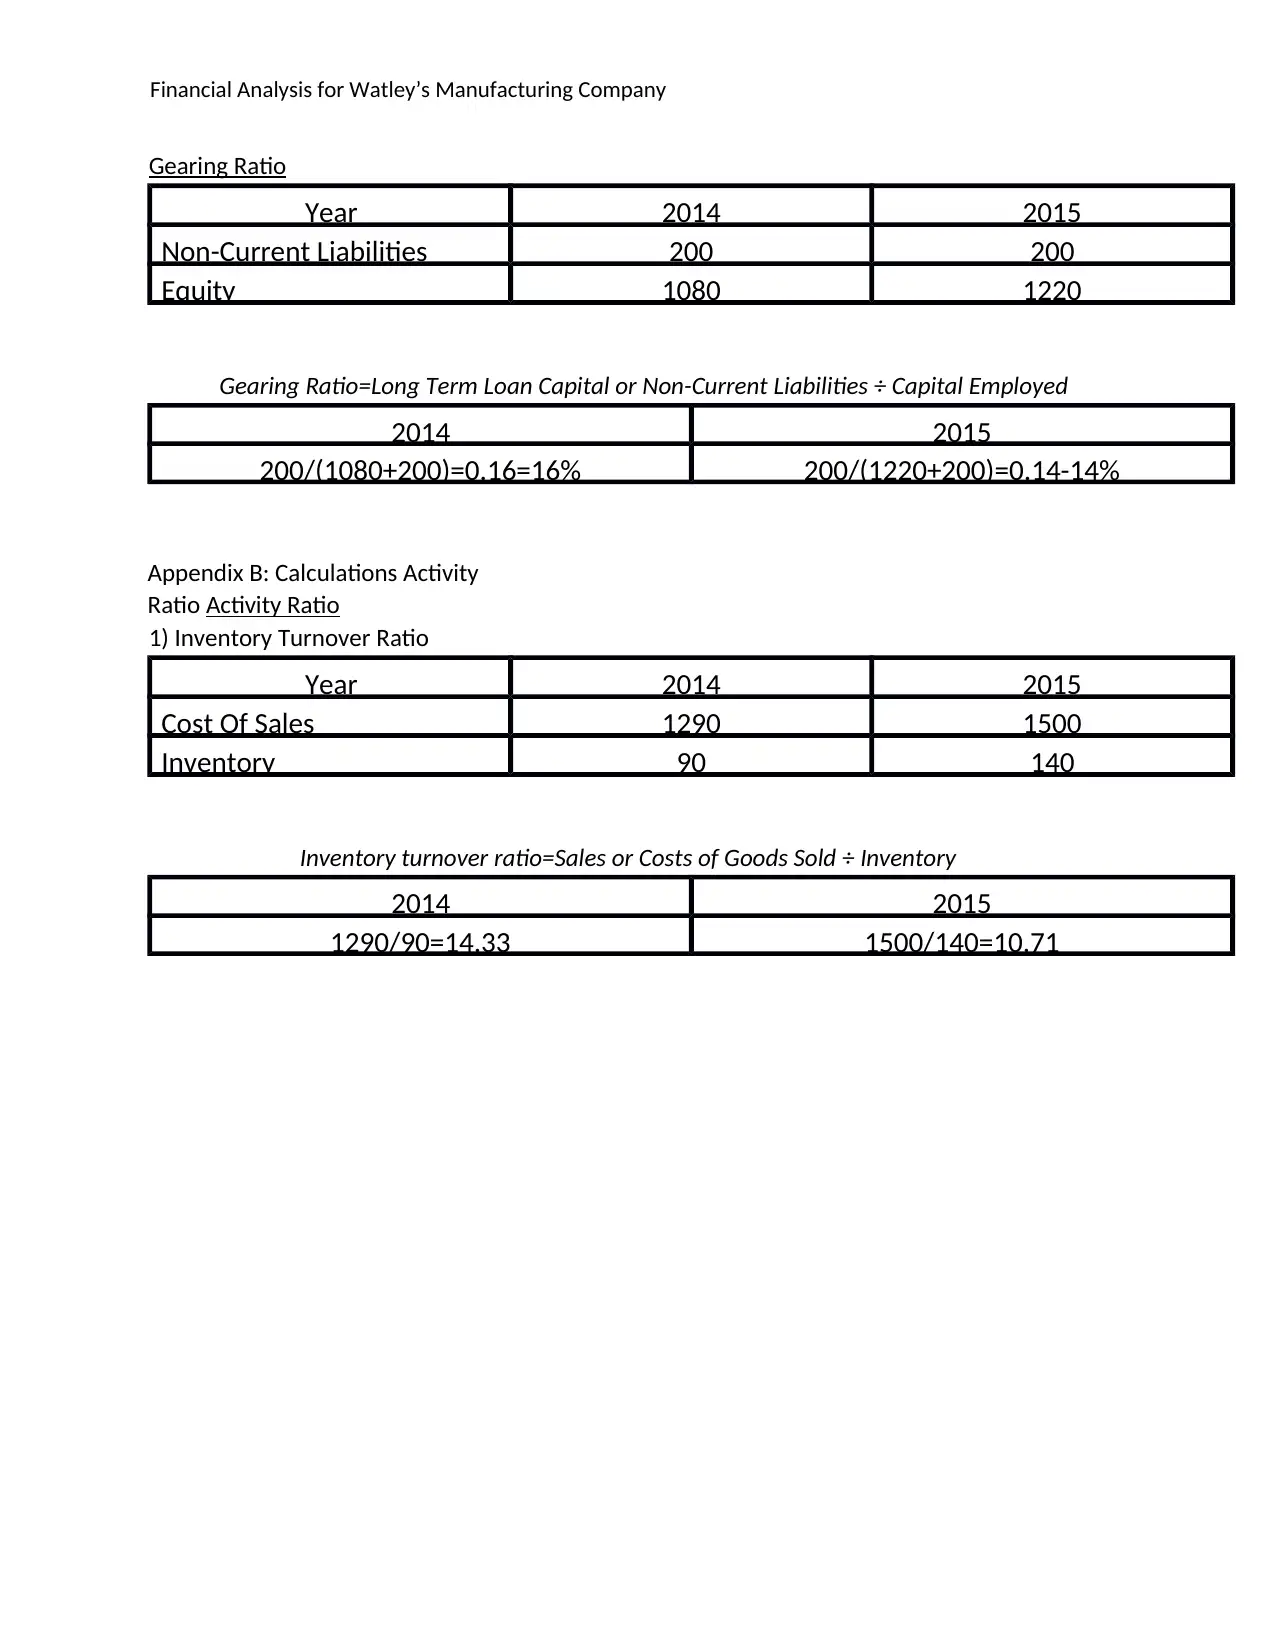
Gearing Ratio
Gearing Ratio=Long Term Loan Capital or Non-Current Liabilities ÷ Capital Employed
Appendix B: Calculations Activity
Ratio Activity Ratio
1) Inventory Turnover Ratio
Inventory turnover ratio=Sales or Costs of Goods Sold ÷ Inventory
Year 2014 2015
Non-Current Liabilities 200 200
Equity 1080 1220
2014 2015
200/(1080+200)=0.16=16% 200/(1220+200)=0.14-14%
Year 2014 2015
Cost Of Sales 1290 1500
Inventory 90 140
2014 2015
1290/90=14.33 1500/140=10.71
Paraphrase This Document
Need a fresh take? Get an instant paraphrase of this document with our AI Paraphraser
Financial Analysis for Watley’s Manufacturing Company
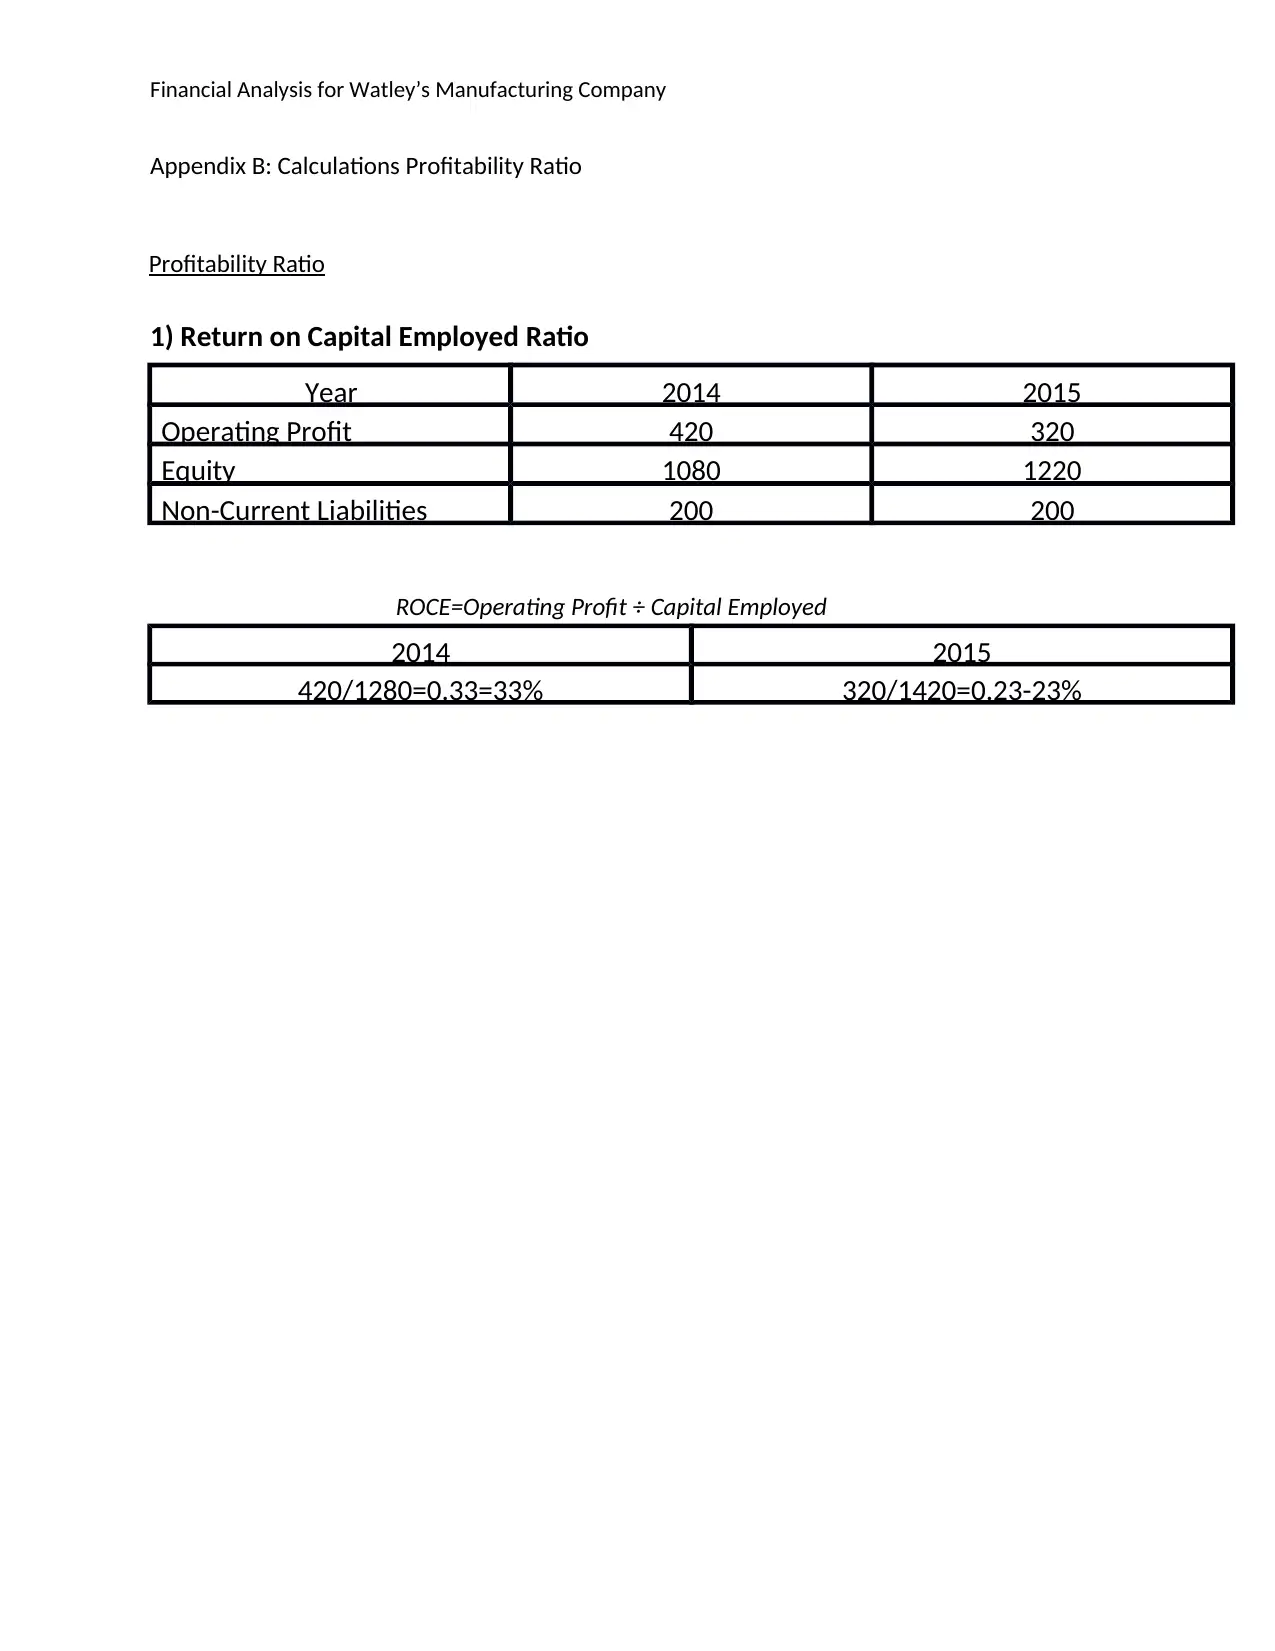
Appendix B: Calculations Profitability Ratio
Profitability Ratio
ROCE=Operating Profit ÷ Capital Employed
Return on Capital Employed Ratio1)
Year 2014 2015
Operating Profit 420 320
Equity 1080 1220
Non-Current Liabilities 200 200
2014 2015
420/1280=0.33=33% 320/1420=0.23-23%
Appendix B: Calculations Profitability Ratio
Profitability Ratio
ROCE=Operating Profit ÷ Capital Employed
Return on Capital Employed Ratio1)
Year 2014 2015
Operating Profit 420 320
Equity 1080 1220
Non-Current Liabilities 200 200
2014 2015
420/1280=0.33=33% 320/1420=0.23-23%
1 out of 8
Related Documents


Your All-in-One AI-Powered Toolkit for Academic Success.
+13062052269
info@desklib.com
Available 24*7 on WhatsApp / Email
![[object Object]](/_next/static/media/star-bottom.7253800d.svg)
Unlock your academic potential
Copyright © 2020–2026 A2Z Services. All Rights Reserved. Developed and managed by ZUCOL.