BSS004-1 WBES Data Analysis: Country Selection for Business Branch
VerifiedAdded on 2023/06/11
|10
|3166
|203
Report
AI Summary
This report analyzes data from the World Bank Enterprise Survey (WBES) to advise a company on selecting either South Africa or Kenya for opening a new branch. The analysis considers factors like political instability, customs and trade regulations, business licensing permits, access to finance, labor regulations, and access to land. Summary statistics such as mean, median, and mode are used to evaluate the extent to which each factor poses an obstacle to business operations in each country. The findings and recommendations are based on the interpretation of these statistics, providing insights into the relative challenges and opportunities in South Africa and Kenya for business expansion. The data was coded in several terminologies and sorted to make it more appealing and intelligible.The responders were given a five-point Likert scale to choose from.
Using data to build
business practices
business practices
Paraphrase This Document
Need a fresh take? Get an instant paraphrase of this document with our AI Paraphraser
Contents
INTRODUCTION......................................................................................................................4
MAIN BODY.............................................................................................................................4
Examine the data of both the countries South Africa and Kenya..........................................4
Select the question that are being analysed by considering at least six factors.....................5
Analyse the data for the questions company has chosen using the relevant summary
statistic....................................................................................................................................6
Recommendations and Findings............................................................................................9
CONCLUSION........................................................................................................................10
REFERENCES.........................................................................................................................11
INTRODUCTION
The key to effectively employing big data is to understand what it can assist an
organisation achieve. While big data is frequently associated with marketing and e-
commerce, it would have been an error to believe that data is just relevant to those areas.
Data can help businesses in a range of industries in a variety of ways, with proper analysis
helping a company to stand out from the competition. Such methods could also be used to
identify possible errors or fraud before they occur, which is extremely useful in the finance
system. E-commerce behemoths like Amazon and Walmart want to use data to their
advantage. By meticulously monitoring their clients' browsing history, these firms obtain a
deeper understanding of their clients, their habits, and their requirements. This information is
then put to better use in order to maximise the company's profits (Aboelmaged, 2018). The
data also enables the company to display things that specific customers are likely to demand
and take. The following case study examines a company that intends to expand its operations
into the African market. The company is also analysing several aspects that are active in
nations such as Kenya and South Africa for the same objective. The company must choose
one of the two countries indicated above, and data from the World Bank's website is being
analysed for this purpose.
MAIN BODY
Examine the data of both the countries South Africa and Kenya.
A dataset is a set of data or a collection of data. This data is typically presented in a
tabular manner. Each column represents a separate variable. Therefore, as per the subject,
each row corresponds to a specific data set member. This is a necessary step in the data
management procedure. Undefined quantities like as an entity's size, weight, warmth,
volume, and other attributes, as well as the outcomes of random integers, are represented as
data sets. The term datum refers to a group of values. Every row with in collection of data
corresponds to one or more members' information. In this post, we will learn about the
concept of datasets, various kinds of datasets, attributes, and more, as well as several solved
examples. The data set being evaluated for this research pertains to two countries named
South Africa and Kenya. Different elements are included in the report purpose of providing
insights to the firm on how challenging it is for the company to open up shop and run their
activities in the chosen country (Ali, Ally and Dwivedi, 2020).
⊘ This is a preview!⊘
Do you want full access?
Subscribe today to unlock all pages.
Trusted by 1+ million students worldwide
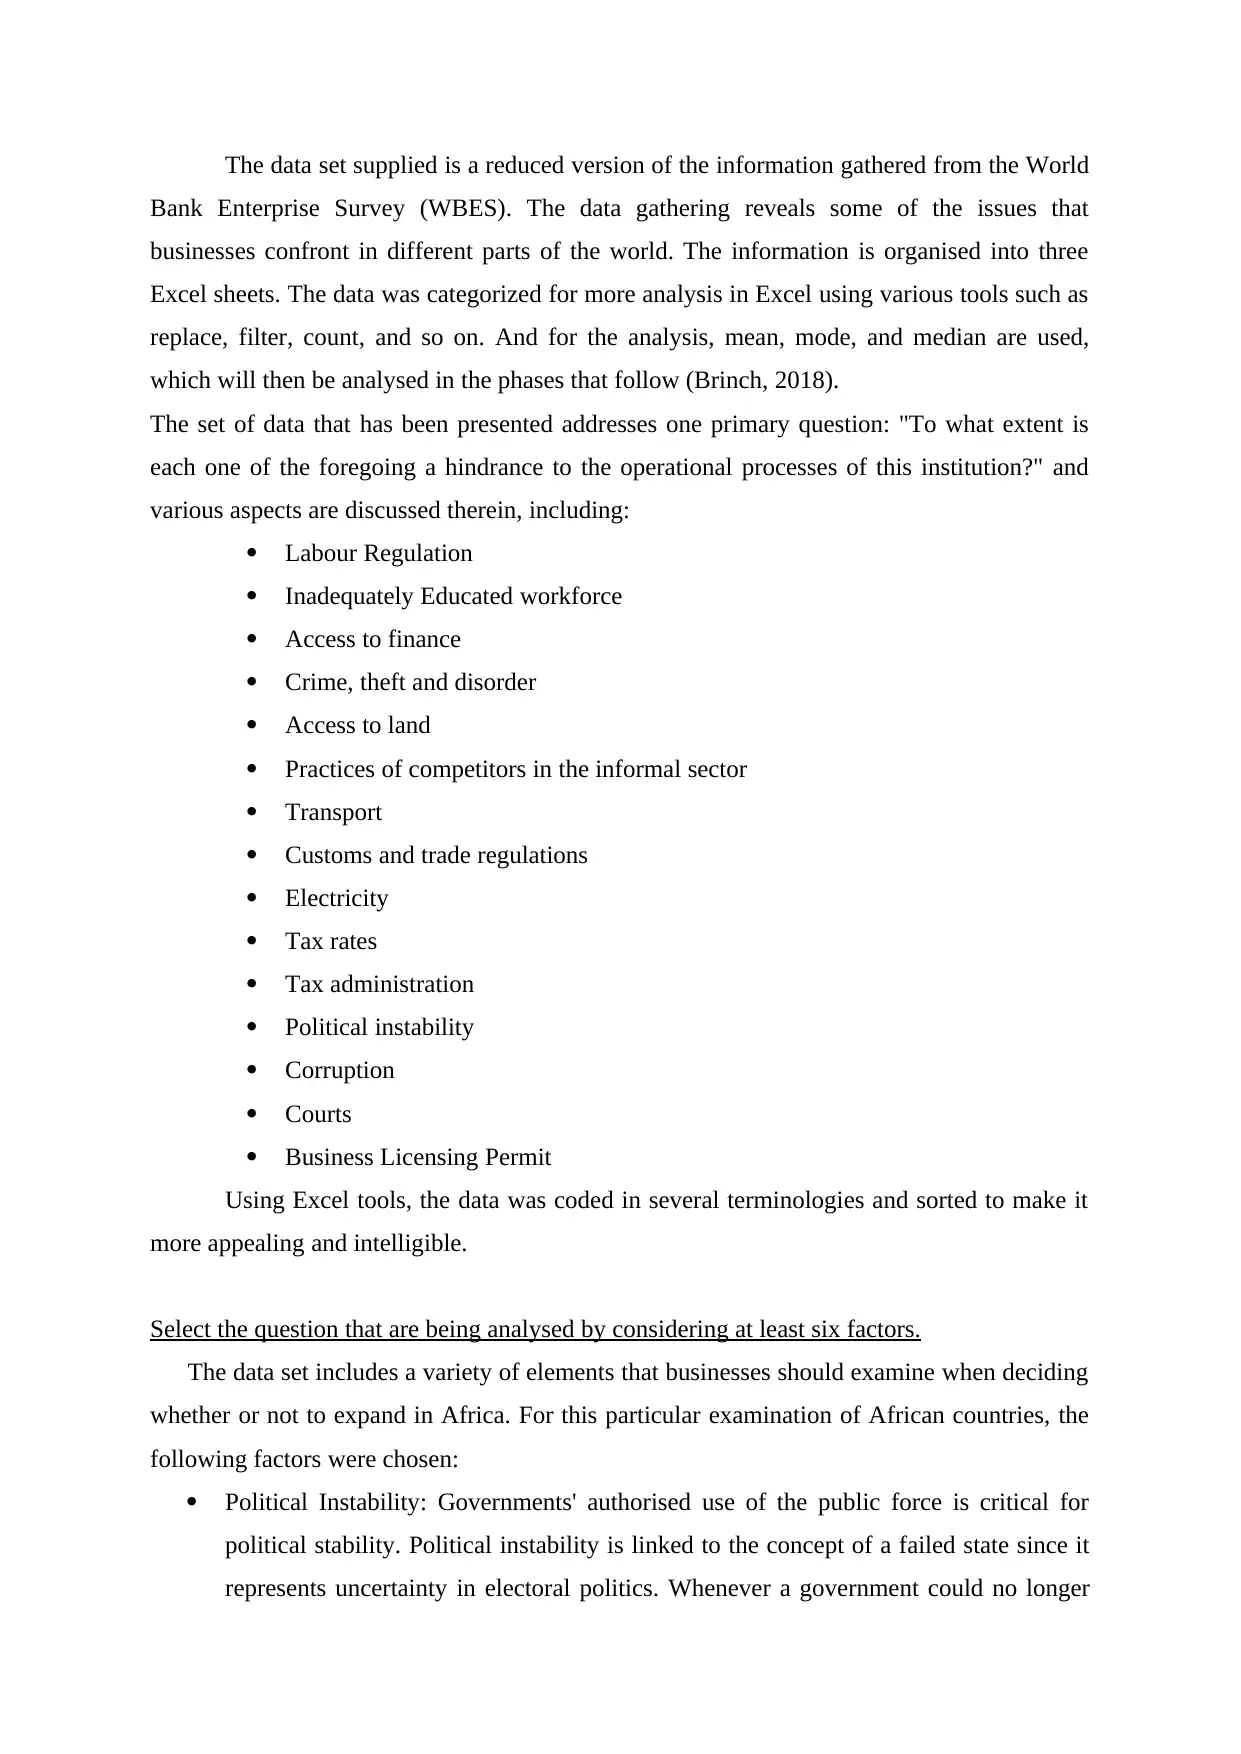
The data set supplied is a reduced version of the information gathered from the World
Bank Enterprise Survey (WBES). The data gathering reveals some of the issues that
businesses confront in different parts of the world. The information is organised into three
Excel sheets. The data was categorized for more analysis in Excel using various tools such as
replace, filter, count, and so on. And for the analysis, mean, mode, and median are used,
which will then be analysed in the phases that follow (Brinch, 2018).
The set of data that has been presented addresses one primary question: "To what extent is
each one of the foregoing a hindrance to the operational processes of this institution?" and
various aspects are discussed therein, including:
Labour Regulation
Inadequately Educated workforce
Access to finance
Crime, theft and disorder
Access to land
Practices of competitors in the informal sector
Transport
Customs and trade regulations
Electricity
Tax rates
Tax administration
Political instability
Corruption
Courts
Business Licensing Permit
Using Excel tools, the data was coded in several terminologies and sorted to make it
more appealing and intelligible.
Select the question that are being analysed by considering at least six factors.
The data set includes a variety of elements that businesses should examine when deciding
whether or not to expand in Africa. For this particular examination of African countries, the
following factors were chosen:
Political Instability: Governments' authorised use of the public force is critical for
political stability. Political instability is linked to the concept of a failed state since it
represents uncertainty in electoral politics. Whenever a government could no longer
Paraphrase This Document
Need a fresh take? Get an instant paraphrase of this document with our AI Paraphraser
manage to provide basic services to its population, including such security and the
ability to acquire shelter and food, it loses its legal power, which leads to political
unrest. Businesses must evaluate the impact of the new law enacted by the
government on their business. In order to meet statutory goals, businesses may be
obliged to establish new strategies or procedures (Di Vaio and et.al., 2020).
Customs and trade regulations: Trade regulations are laws enacted by the federal and
state governments to promote free corporate competition. Consumer protection laws,
advertising regulations, trademark laws, and franchise laws are all examples of trade
regulation.
Business Licensing Permit: A business licence is a government-issued permit that
allows individuals or businesses to conduct legitimate business within the
government's jurisdiction.
Financial resources: A company's financial foundation is critical. Finance is required
for the acquisition of assets, products, and raw materials, as well as other economic
activities. Let's look at the definition of business finance in more detail.
Labour Regulation: Labour law compliance refers to the laws and regulations that
firms must follow. These are the employment-related rules and regulations. Labour
laws are the rules that govern the relationships with staff, employers, labour unions,
and the authorities. Collective labour law regulates the three-way relationship
between the employees, employers, and union. Staff members' rights during work,
and the employment contract, are covered by individual labour law (Kotu and
Deshpande, 2018).
Access to Land: Land could be used as a source of capital for a business. Land is also
used to build the structure of a business and to perform the duties and operations that
businesses desire, such as farming.
Analyse the data for the questions company has chosen using the relevant summary statistic.
The central tendency is a statistical measure that represents the specific value of the
entire distribution or dataset. Its purpose is to characterise all of the data inside the
distribution precisely.
The mean is used to represent the dataset's average value. It can be computed by
adding the sum of all of the items in the data by the dataset's size. The arithmetic mean is the
name given to it. Whether the dataset is ordered in ascending or descending, the median is the
middle value. When a dataset has an equal number of elements, the median value can be
computed by averaging the two middle values. The most common value in the dataset is
reflected in the mode. There are times when the database has a lot of modes as well as other
times when it does not (Krishnamoorthi and Mathew, 2018).
A five-point Likert Scale was presented to the participants. The responders were
given the choice of "no obstacle" as the first option. "Very severe Obstacle" was the fifth
choice. The respondents were given a five-point Likert scale to choose from.
Analysis of many factors to evaluate while making decisions about expanding in Africa:
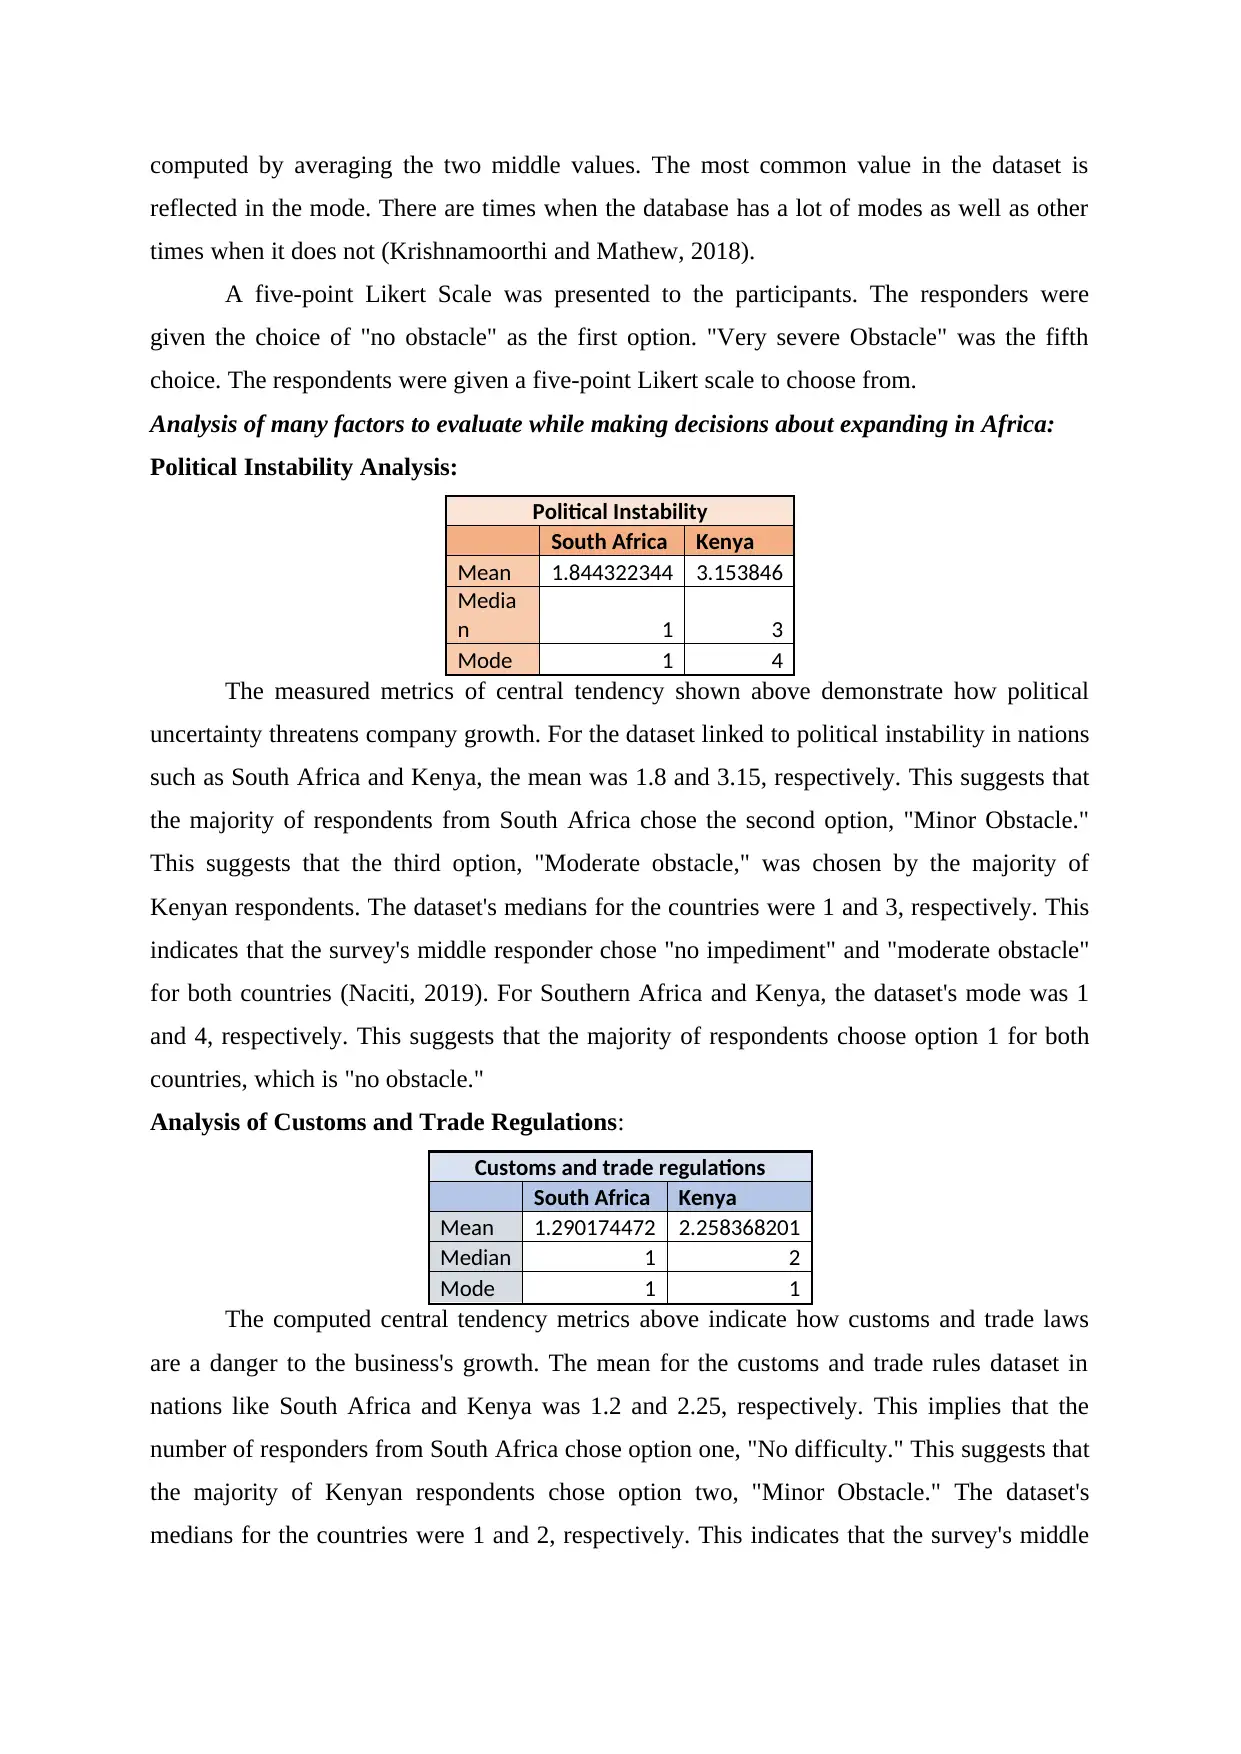
Political Instability Analysis:
Political Instability
South Africa Kenya
Mean 1.844322344 3.153846
Media
n 1 3
Mode 1 4
The measured metrics of central tendency shown above demonstrate how political
uncertainty threatens company growth. For the dataset linked to political instability in nations
such as South Africa and Kenya, the mean was 1.8 and 3.15, respectively. This suggests that
the majority of respondents from South Africa chose the second option, "Minor Obstacle."
This suggests that the third option, "Moderate obstacle," was chosen by the majority of
Kenyan respondents. The dataset's medians for the countries were 1 and 3, respectively. This
indicates that the survey's middle responder chose "no impediment" and "moderate obstacle"
for both countries (Naciti, 2019). For Southern Africa and Kenya, the dataset's mode was 1
and 4, respectively. This suggests that the majority of respondents choose option 1 for both
countries, which is "no obstacle."
Analysis of Customs and Trade Regulations:
Customs and trade regulations
South Africa Kenya
Mean 1.290174472 2.258368201
Median 1 2
Mode 1 1
The computed central tendency metrics above indicate how customs and trade laws
are a danger to the business's growth. The mean for the customs and trade rules dataset in
nations like South Africa and Kenya was 1.2 and 2.25, respectively. This implies that the
number of responders from South Africa chose option one, "No difficulty." This suggests that
the majority of Kenyan respondents chose option two, "Minor Obstacle." The dataset's
medians for the countries were 1 and 2, respectively. This indicates that the survey's middle
reflected in the mode. There are times when the database has a lot of modes as well as other
times when it does not (Krishnamoorthi and Mathew, 2018).
A five-point Likert Scale was presented to the participants. The responders were
given the choice of "no obstacle" as the first option. "Very severe Obstacle" was the fifth
choice. The respondents were given a five-point Likert scale to choose from.
Analysis of many factors to evaluate while making decisions about expanding in Africa:
Political Instability Analysis:
Political Instability
South Africa Kenya
Mean 1.844322344 3.153846
Media
n 1 3
Mode 1 4
The measured metrics of central tendency shown above demonstrate how political
uncertainty threatens company growth. For the dataset linked to political instability in nations
such as South Africa and Kenya, the mean was 1.8 and 3.15, respectively. This suggests that
the majority of respondents from South Africa chose the second option, "Minor Obstacle."
This suggests that the third option, "Moderate obstacle," was chosen by the majority of
Kenyan respondents. The dataset's medians for the countries were 1 and 3, respectively. This
indicates that the survey's middle responder chose "no impediment" and "moderate obstacle"
for both countries (Naciti, 2019). For Southern Africa and Kenya, the dataset's mode was 1
and 4, respectively. This suggests that the majority of respondents choose option 1 for both
countries, which is "no obstacle."
Analysis of Customs and Trade Regulations:
Customs and trade regulations
South Africa Kenya
Mean 1.290174472 2.258368201
Median 1 2
Mode 1 1
The computed central tendency metrics above indicate how customs and trade laws
are a danger to the business's growth. The mean for the customs and trade rules dataset in
nations like South Africa and Kenya was 1.2 and 2.25, respectively. This implies that the
number of responders from South Africa chose option one, "No difficulty." This suggests that
the majority of Kenyan respondents chose option two, "Minor Obstacle." The dataset's
medians for the countries were 1 and 2, respectively. This indicates that the survey's middle
⊘ This is a preview!⊘
Do you want full access?
Subscribe today to unlock all pages.
Trusted by 1+ million students worldwide
responder chose "no impediment" and "little obstacle" for both countries. This suggests that
the majority of respondents choose option 1 for both countries, which is "no obstacle".
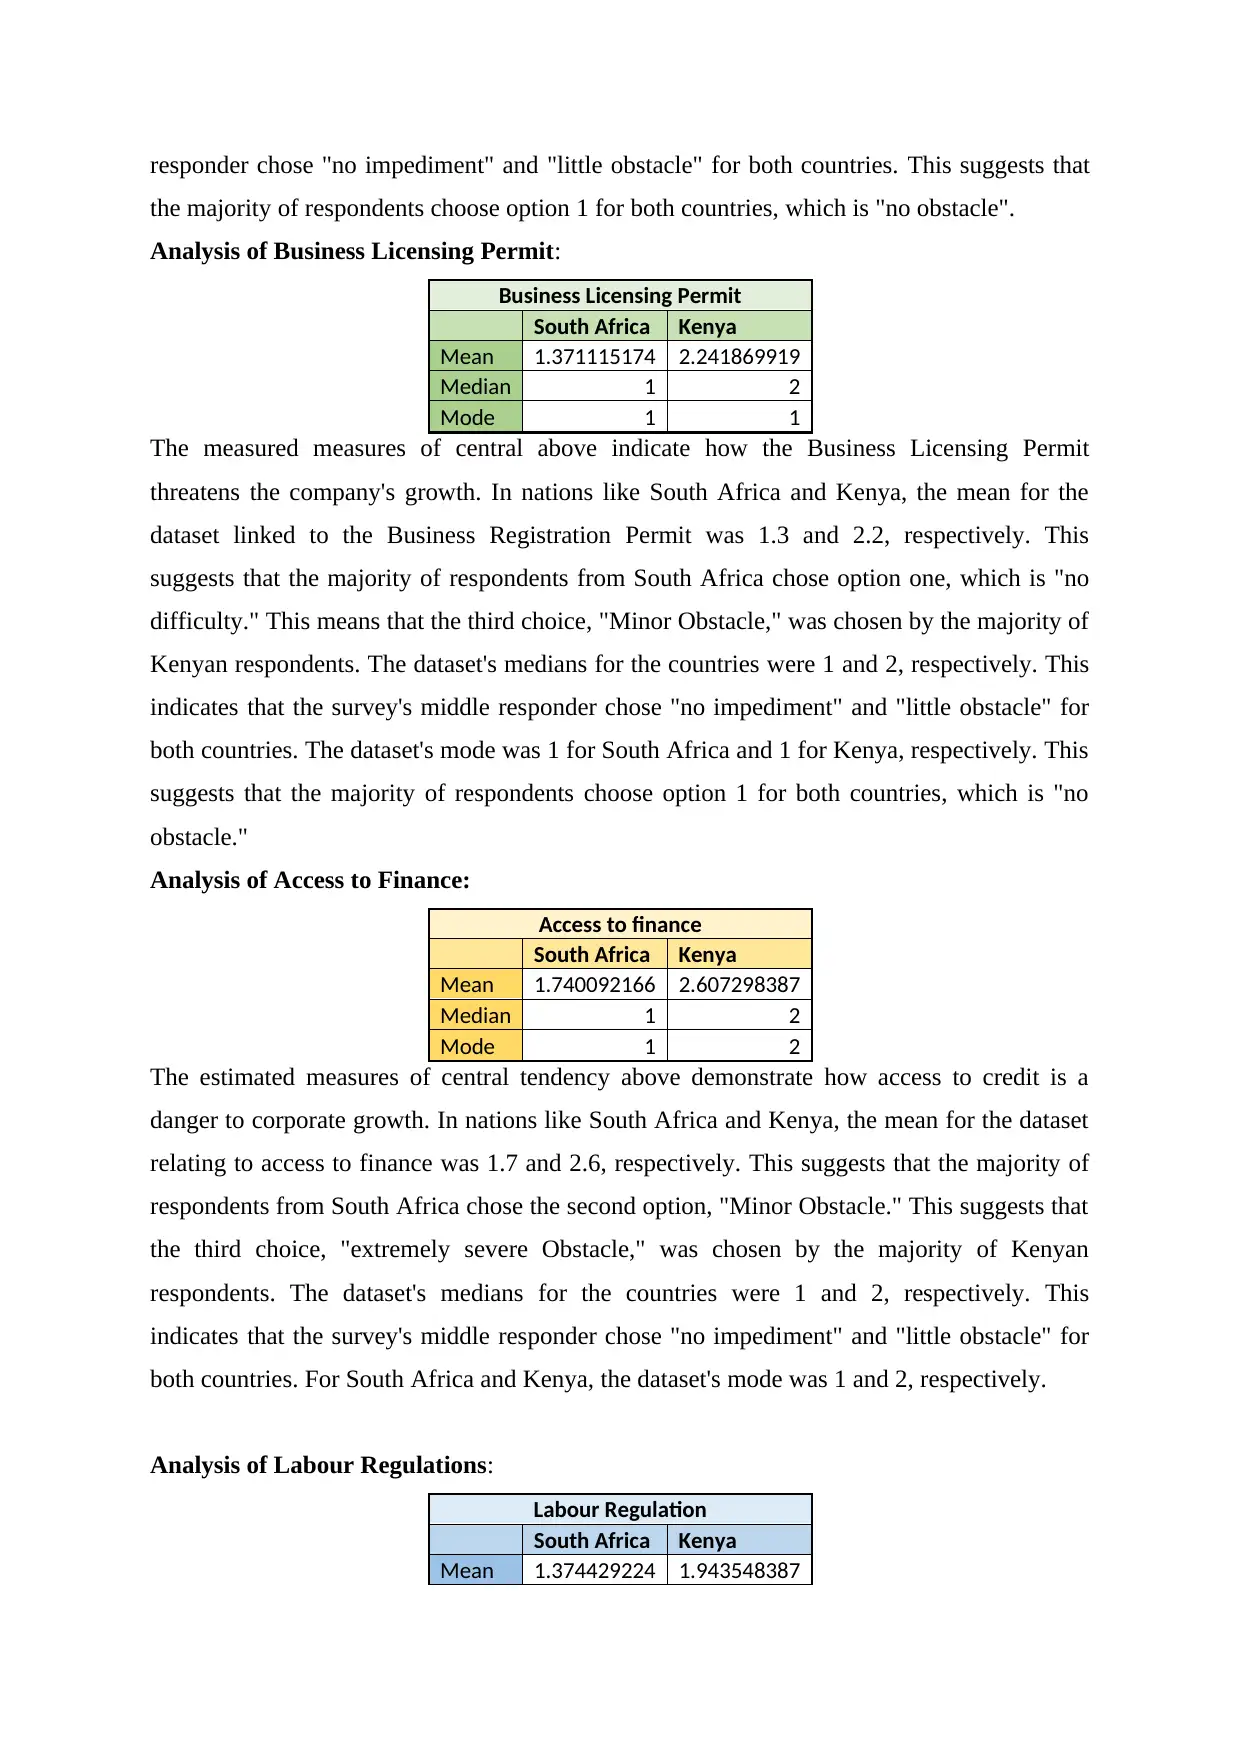
Analysis of Business Licensing Permit:
Business Licensing Permit
South Africa Kenya
Mean 1.371115174 2.241869919
Median 1 2
Mode 1 1
The measured measures of central above indicate how the Business Licensing Permit
threatens the company's growth. In nations like South Africa and Kenya, the mean for the
dataset linked to the Business Registration Permit was 1.3 and 2.2, respectively. This
suggests that the majority of respondents from South Africa chose option one, which is "no
difficulty." This means that the third choice, "Minor Obstacle," was chosen by the majority of
Kenyan respondents. The dataset's medians for the countries were 1 and 2, respectively. This
indicates that the survey's middle responder chose "no impediment" and "little obstacle" for
both countries. The dataset's mode was 1 for South Africa and 1 for Kenya, respectively. This
suggests that the majority of respondents choose option 1 for both countries, which is "no
obstacle."
Analysis of Access to Finance:
Access to finance
South Africa Kenya
Mean 1.740092166 2.607298387
Median 1 2
Mode 1 2
The estimated measures of central tendency above demonstrate how access to credit is a
danger to corporate growth. In nations like South Africa and Kenya, the mean for the dataset
relating to access to finance was 1.7 and 2.6, respectively. This suggests that the majority of
respondents from South Africa chose the second option, "Minor Obstacle." This suggests that
the third choice, "extremely severe Obstacle," was chosen by the majority of Kenyan
respondents. The dataset's medians for the countries were 1 and 2, respectively. This
indicates that the survey's middle responder chose "no impediment" and "little obstacle" for
both countries. For South Africa and Kenya, the dataset's mode was 1 and 2, respectively.
Analysis of Labour Regulations:
Labour Regulation
South Africa Kenya
Mean 1.374429224 1.943548387
the majority of respondents choose option 1 for both countries, which is "no obstacle".
Analysis of Business Licensing Permit:
Business Licensing Permit
South Africa Kenya
Mean 1.371115174 2.241869919
Median 1 2
Mode 1 1
The measured measures of central above indicate how the Business Licensing Permit
threatens the company's growth. In nations like South Africa and Kenya, the mean for the
dataset linked to the Business Registration Permit was 1.3 and 2.2, respectively. This
suggests that the majority of respondents from South Africa chose option one, which is "no
difficulty." This means that the third choice, "Minor Obstacle," was chosen by the majority of
Kenyan respondents. The dataset's medians for the countries were 1 and 2, respectively. This
indicates that the survey's middle responder chose "no impediment" and "little obstacle" for
both countries. The dataset's mode was 1 for South Africa and 1 for Kenya, respectively. This
suggests that the majority of respondents choose option 1 for both countries, which is "no
obstacle."
Analysis of Access to Finance:
Access to finance
South Africa Kenya
Mean 1.740092166 2.607298387
Median 1 2
Mode 1 2
The estimated measures of central tendency above demonstrate how access to credit is a
danger to corporate growth. In nations like South Africa and Kenya, the mean for the dataset
relating to access to finance was 1.7 and 2.6, respectively. This suggests that the majority of
respondents from South Africa chose the second option, "Minor Obstacle." This suggests that
the third choice, "extremely severe Obstacle," was chosen by the majority of Kenyan
respondents. The dataset's medians for the countries were 1 and 2, respectively. This
indicates that the survey's middle responder chose "no impediment" and "little obstacle" for
both countries. For South Africa and Kenya, the dataset's mode was 1 and 2, respectively.
Analysis of Labour Regulations:
Labour Regulation
South Africa Kenya
Mean 1.374429224 1.943548387
Paraphrase This Document
Need a fresh take? Get an instant paraphrase of this document with our AI Paraphraser
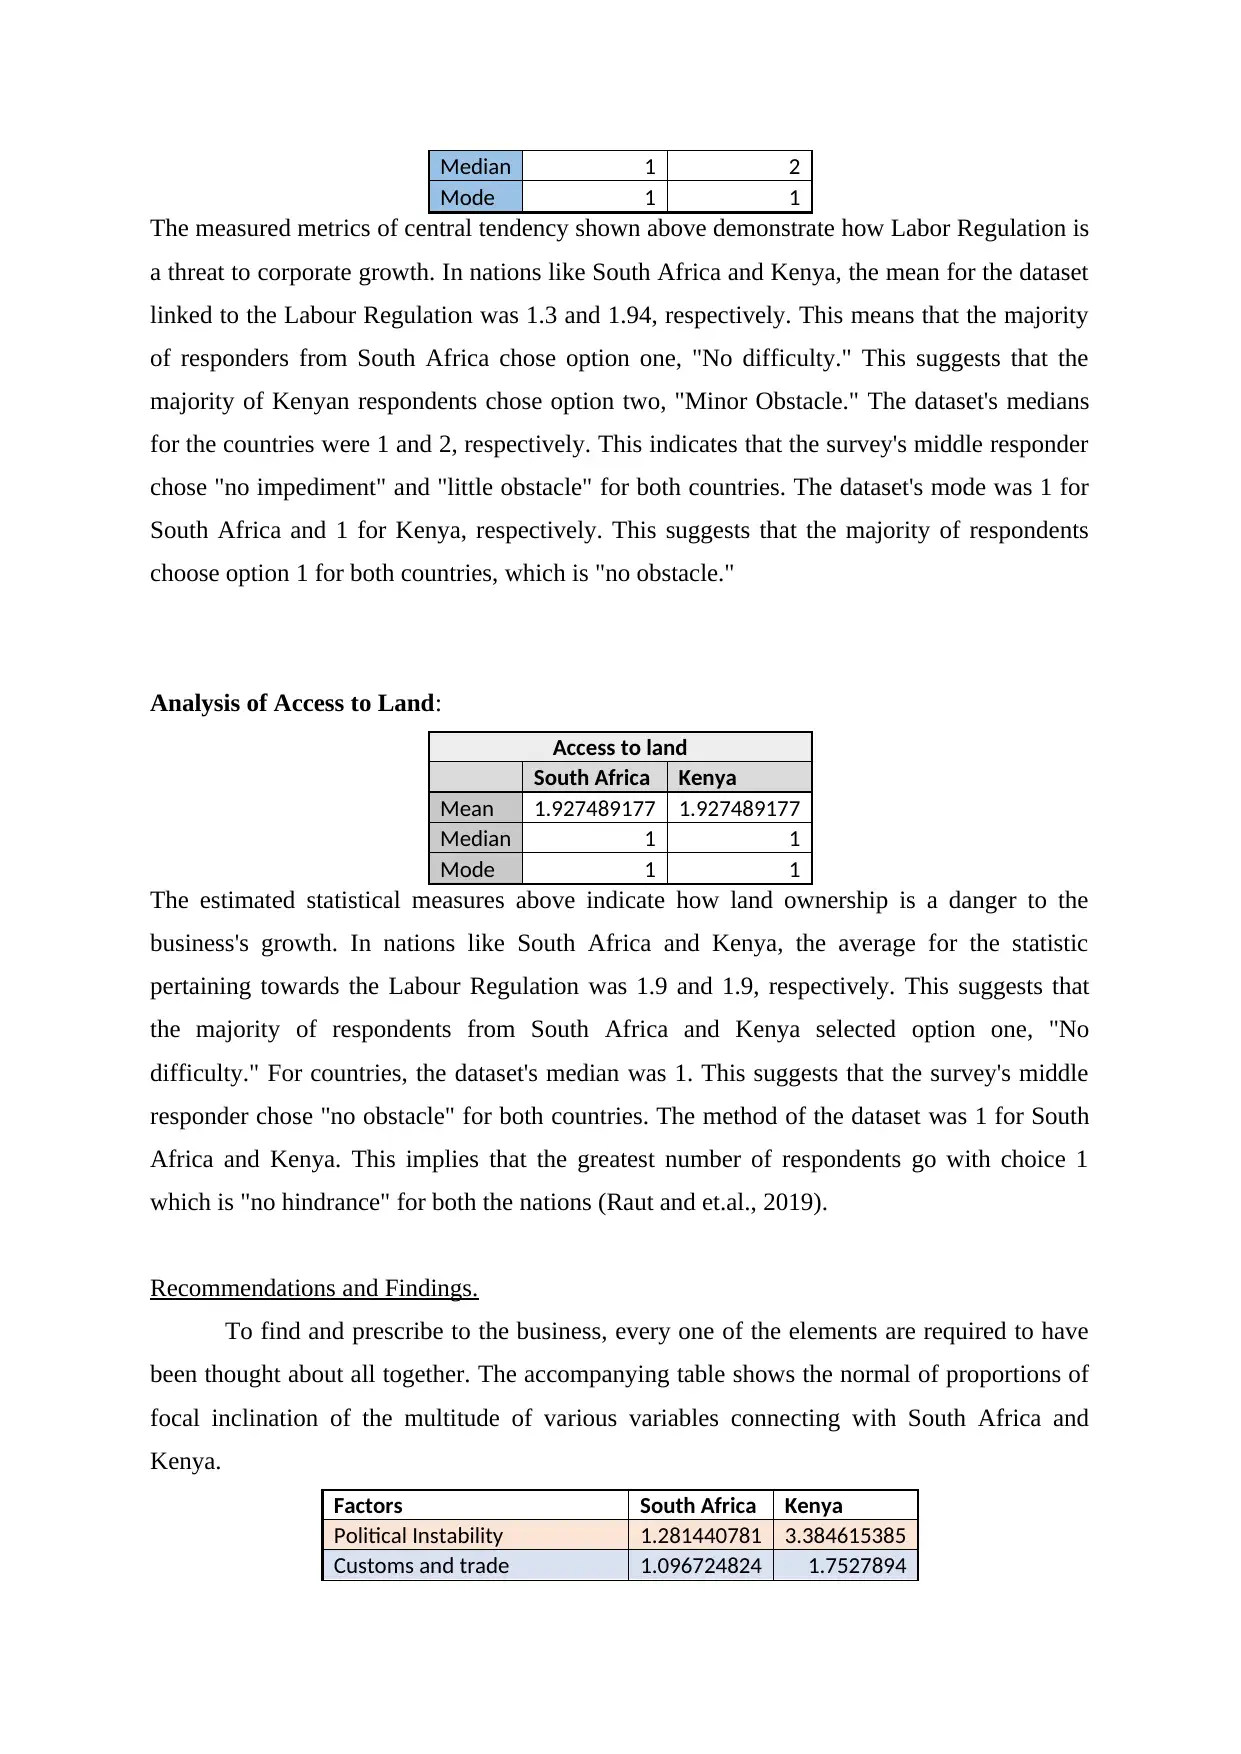
Median 1 2
Mode 1 1
The measured metrics of central tendency shown above demonstrate how Labor Regulation is
a threat to corporate growth. In nations like South Africa and Kenya, the mean for the dataset
linked to the Labour Regulation was 1.3 and 1.94, respectively. This means that the majority
of responders from South Africa chose option one, "No difficulty." This suggests that the
majority of Kenyan respondents chose option two, "Minor Obstacle." The dataset's medians
for the countries were 1 and 2, respectively. This indicates that the survey's middle responder
chose "no impediment" and "little obstacle" for both countries. The dataset's mode was 1 for
South Africa and 1 for Kenya, respectively. This suggests that the majority of respondents
choose option 1 for both countries, which is "no obstacle."
Analysis of Access to Land:
Access to land
South Africa Kenya
Mean 1.927489177 1.927489177
Median 1 1
Mode 1 1
The estimated statistical measures above indicate how land ownership is a danger to the
business's growth. In nations like South Africa and Kenya, the average for the statistic
pertaining towards the Labour Regulation was 1.9 and 1.9, respectively. This suggests that
the majority of respondents from South Africa and Kenya selected option one, "No
difficulty." For countries, the dataset's median was 1. This suggests that the survey's middle
responder chose "no obstacle" for both countries. The method of the dataset was 1 for South
Africa and Kenya. This implies that the greatest number of respondents go with choice 1
which is "no hindrance" for both the nations (Raut and et.al., 2019).
Recommendations and Findings.
To find and prescribe to the business, every one of the elements are required to have
been thought about all together. The accompanying table shows the normal of proportions of
focal inclination of the multitude of various variables connecting with South Africa and
Kenya.
Factors South Africa Kenya
Political Instability 1.281440781 3.384615385
Customs and trade 1.096724824 1.7527894
Mode 1 1
The measured metrics of central tendency shown above demonstrate how Labor Regulation is
a threat to corporate growth. In nations like South Africa and Kenya, the mean for the dataset
linked to the Labour Regulation was 1.3 and 1.94, respectively. This means that the majority
of responders from South Africa chose option one, "No difficulty." This suggests that the
majority of Kenyan respondents chose option two, "Minor Obstacle." The dataset's medians
for the countries were 1 and 2, respectively. This indicates that the survey's middle responder
chose "no impediment" and "little obstacle" for both countries. The dataset's mode was 1 for
South Africa and 1 for Kenya, respectively. This suggests that the majority of respondents
choose option 1 for both countries, which is "no obstacle."
Analysis of Access to Land:
Access to land
South Africa Kenya
Mean 1.927489177 1.927489177
Median 1 1
Mode 1 1
The estimated statistical measures above indicate how land ownership is a danger to the
business's growth. In nations like South Africa and Kenya, the average for the statistic
pertaining towards the Labour Regulation was 1.9 and 1.9, respectively. This suggests that
the majority of respondents from South Africa and Kenya selected option one, "No
difficulty." For countries, the dataset's median was 1. This suggests that the survey's middle
responder chose "no obstacle" for both countries. The method of the dataset was 1 for South
Africa and Kenya. This implies that the greatest number of respondents go with choice 1
which is "no hindrance" for both the nations (Raut and et.al., 2019).
Recommendations and Findings.
To find and prescribe to the business, every one of the elements are required to have
been thought about all together. The accompanying table shows the normal of proportions of
focal inclination of the multitude of various variables connecting with South Africa and
Kenya.
Factors South Africa Kenya
Political Instability 1.281440781 3.384615385
Customs and trade 1.096724824 1.7527894
regulations
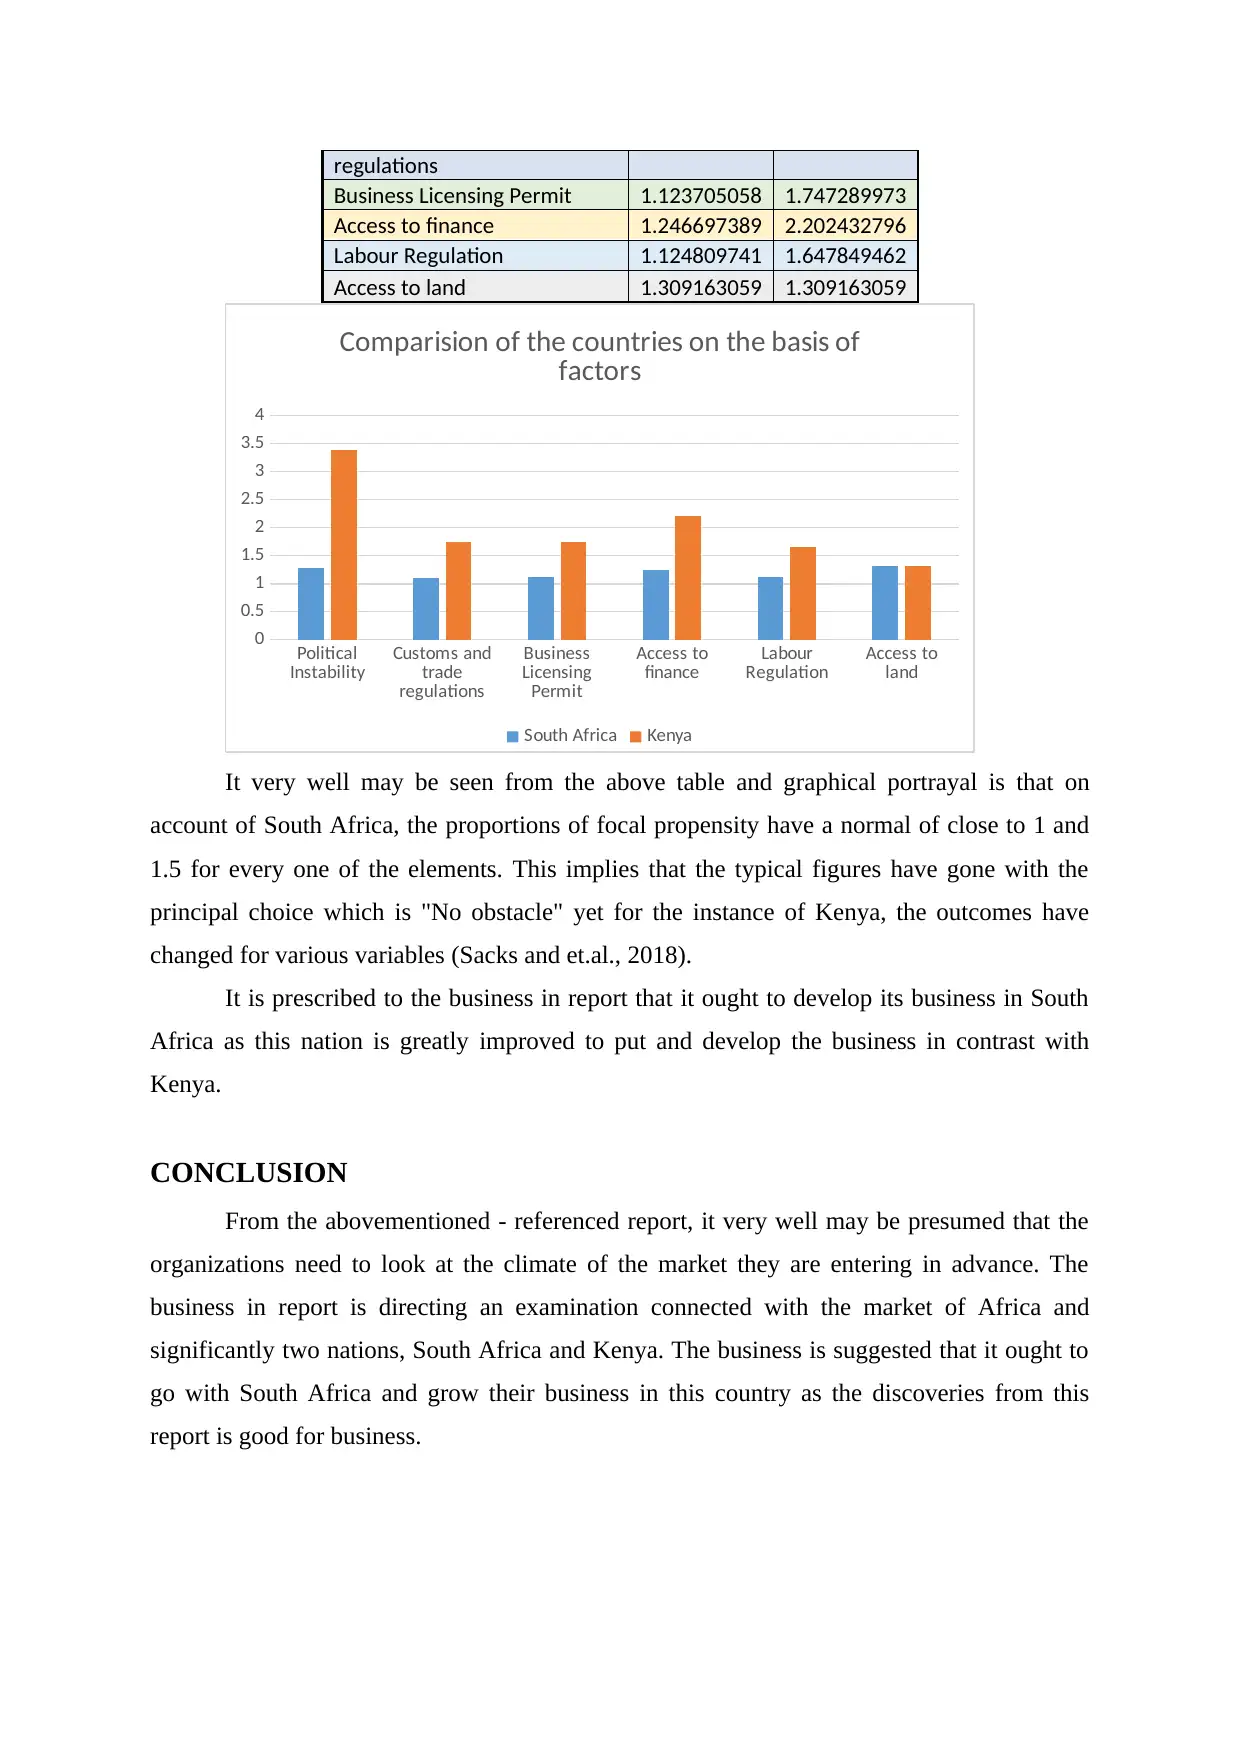
Business Licensing Permit 1.123705058 1.747289973
Access to finance 1.246697389 2.202432796
Labour Regulation 1.124809741 1.647849462
Access to land 1.309163059 1.309163059
Political
Instability Customs and
trade
regulations
Business
Licensing
Permit
Access to
finance Labour
Regulation Access to
land
0
0.5
1
1.5
2
2.5
3
3.5
4
Comparision of the countries on the basis of
factors
South Africa Kenya
It very well may be seen from the above table and graphical portrayal is that on
account of South Africa, the proportions of focal propensity have a normal of close to 1 and
1.5 for every one of the elements. This implies that the typical figures have gone with the
principal choice which is "No obstacle" yet for the instance of Kenya, the outcomes have
changed for various variables (Sacks and et.al., 2018).
It is prescribed to the business in report that it ought to develop its business in South
Africa as this nation is greatly improved to put and develop the business in contrast with
Kenya.
CONCLUSION
From the abovementioned - referenced report, it very well may be presumed that the
organizations need to look at the climate of the market they are entering in advance. The
business in report is directing an examination connected with the market of Africa and
significantly two nations, South Africa and Kenya. The business is suggested that it ought to
go with South Africa and grow their business in this country as the discoveries from this
report is good for business.
⊘ This is a preview!⊘
Do you want full access?
Subscribe today to unlock all pages.
Trusted by 1+ million students worldwide
REFERENCES
Books and Journals
Aboelmaged, M., 2018. The drivers of sustainable manufacturing practices in Egyptian SMEs
and their impact on competitive capabilities: A PLS-SEM model. Journal of
Cleaner Production, 175, pp.207-221.
Ali, O., Ally, M. and Dwivedi, Y., 2020. The state of play of blockchain technology in the
financial services sector: A systematic literature review. International Journal of
Information Management, 54, p.102199.
Brinch, M., 2018. Understanding the value of big data in supply chain management and its
business processes: Towards a conceptual framework. International Journal of
Operations & Production Management.
Di Vaio, A. and et.al., 2020. Artificial intelligence and business models in the sustainable
development goals perspective: A systematic literature review. Journal of Business
Research, 121, pp.283-314.
Kotu, V. and Deshpande, B., 2018. Data science: concepts and practice. Morgan Kaufmann.
Krishnamoorthi, S. and Mathew, S.K., 2018. Business analytics and business value: A
comparative case study. Information & Management, 55(5), pp.643-666.
Naciti, V., 2019. Corporate governance and board of directors: The effect of a board
composition on firm sustainability performance. Journal of Cleaner
Production, 237, p.117727.
Raut, R. and et.al., 2019. Linking big data analytics and operational sustainability practices
for sustainable business management. Journal of cleaner production, 224, pp.10-24.
Sacks, R and et.al., 2018. BIM handbook: A guide to building information modeling for
owners, designers, engineers, contractors, and facility managers. John Wiley &
Sons.
Sousa-Zomer, T.T. and et.al., 2018. Cleaner production as an antecedent for circular
economy paradigm shift at the micro-level: evidence from a home appliance
manufacturer. Journal of cleaner production, 185, pp.740-748.
Wang, C., Zhang, Q. and Zhang, W., 2020. Corporate social responsibility, green supply
chain management and firm performance: the moderating role of big-data analytics
capability. Research in Transportation Business & Management, 37, p.100557.
Zhu, S. and et.al., 2018. How supply chain analytics enables operational supply chain
transparency: An organizational information processing theory
perspective. International Journal of Physical Distribution & Logistics
Management.
1 out of 10
Related Documents


Your All-in-One AI-Powered Toolkit for Academic Success.
+13062052269
info@desklib.com
Available 24*7 on WhatsApp / Email
![[object Object]](/_next/static/media/star-bottom.7253800d.svg)
Unlock your academic potential
Copyright © 2020–2026 A2Z Services. All Rights Reserved. Developed and managed by ZUCOL.