Data Analysis and Forecasting of Edinburgh Weather Conditions Report

Verified

Added on  2023/01/19

|9
|1136
|28
Report
AI Summary
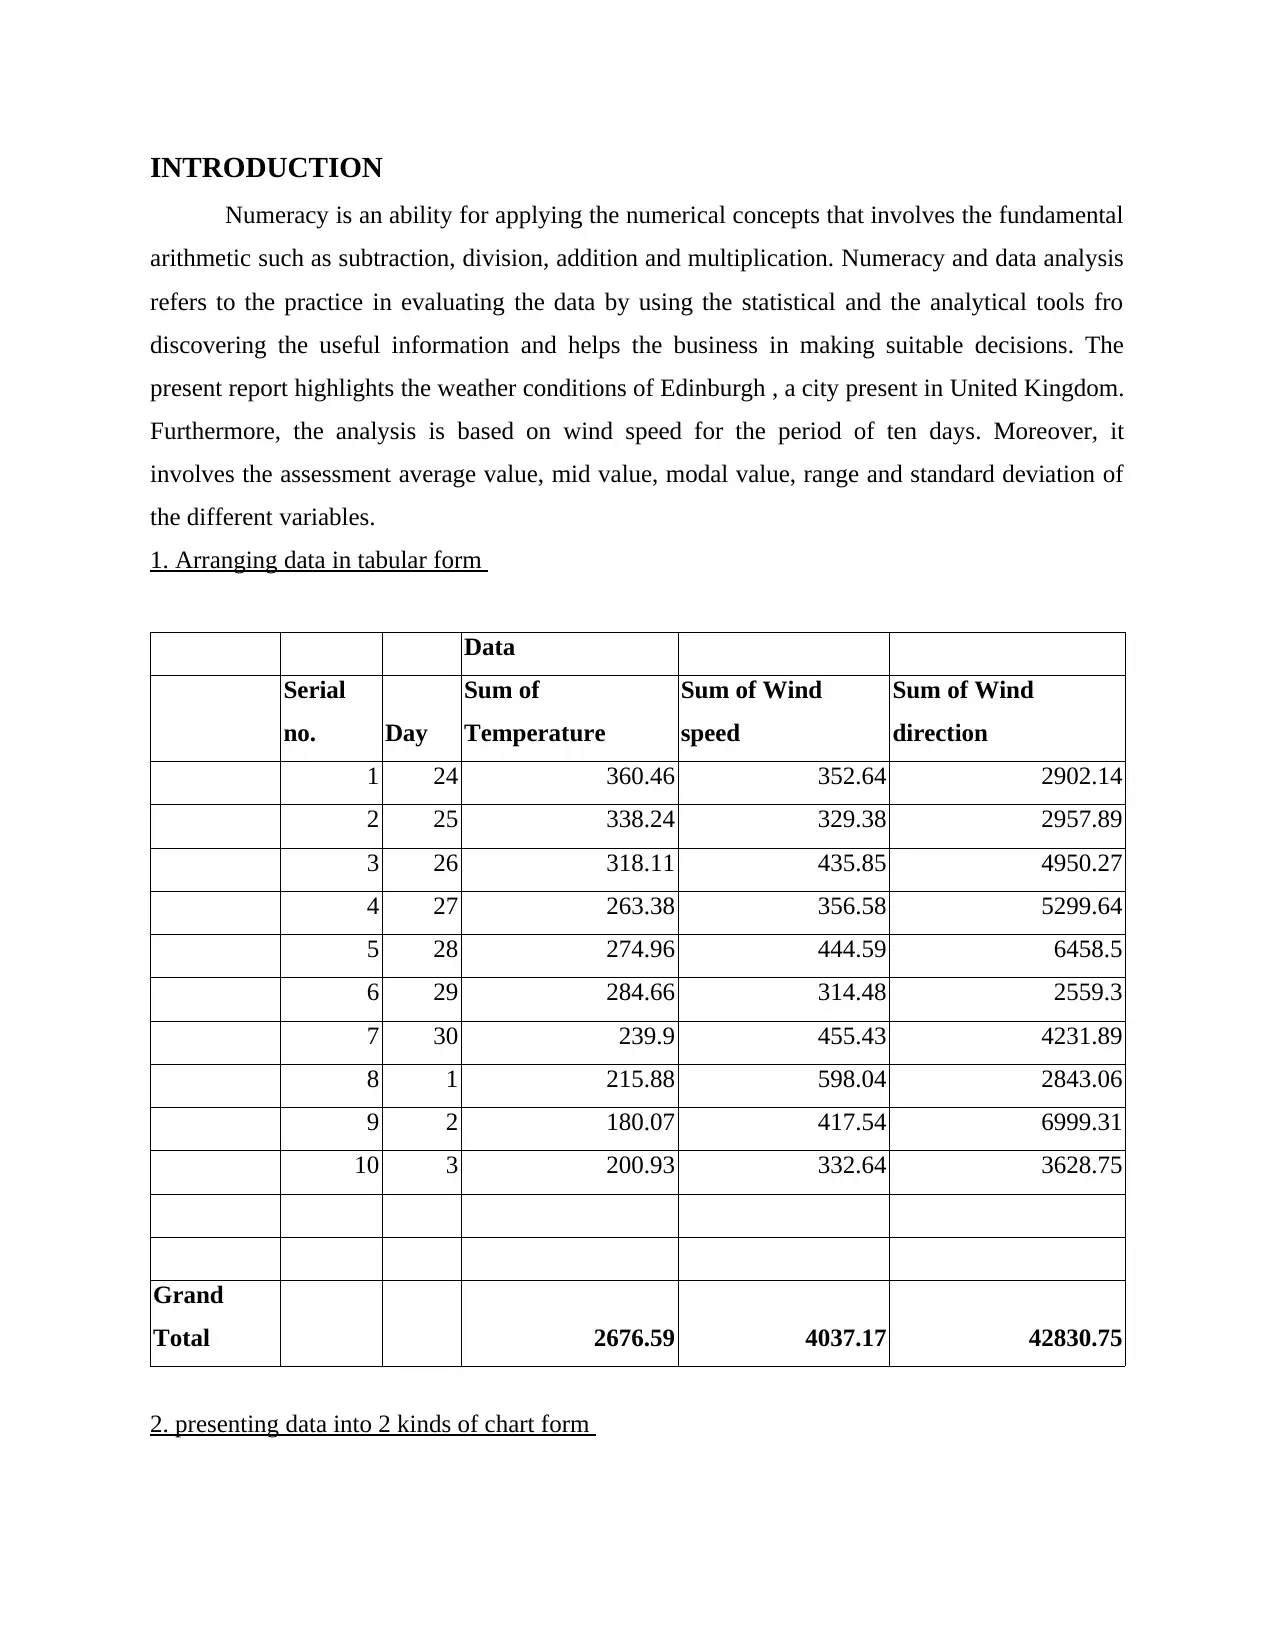
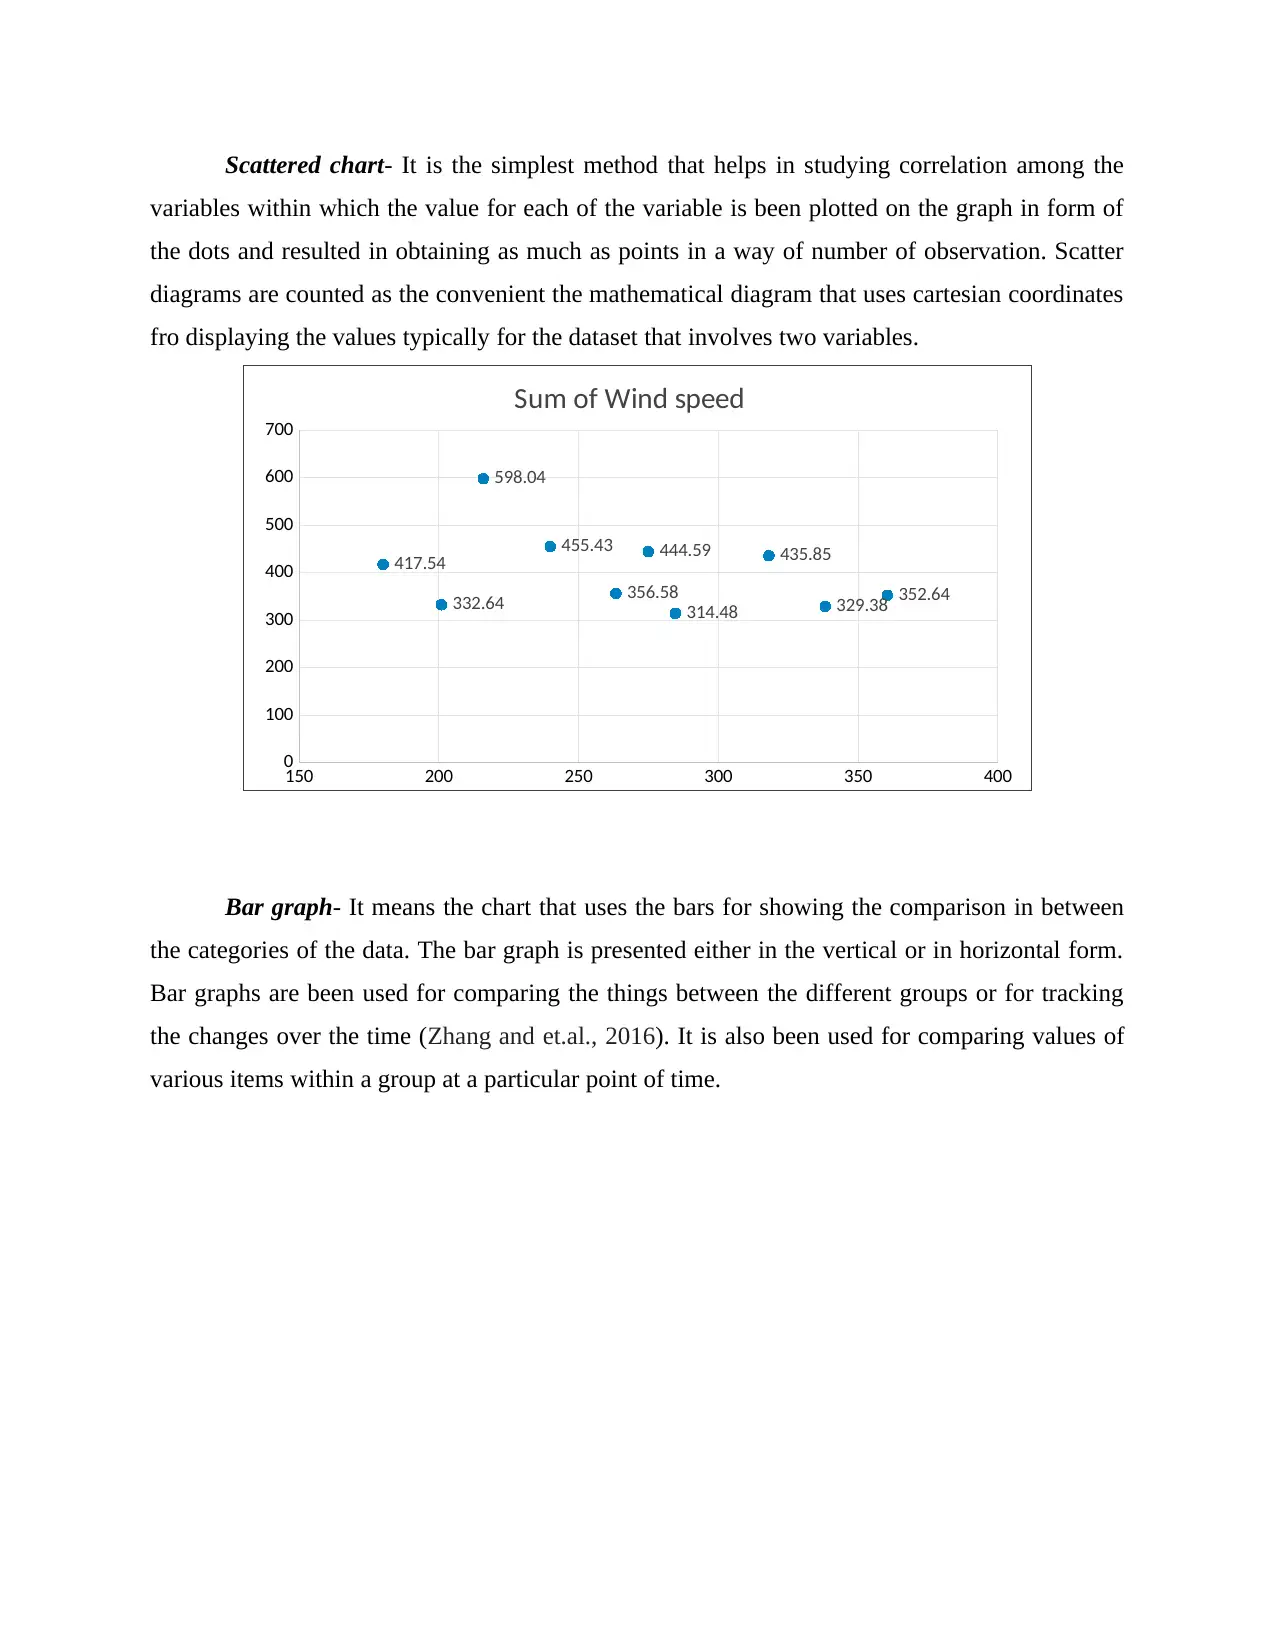
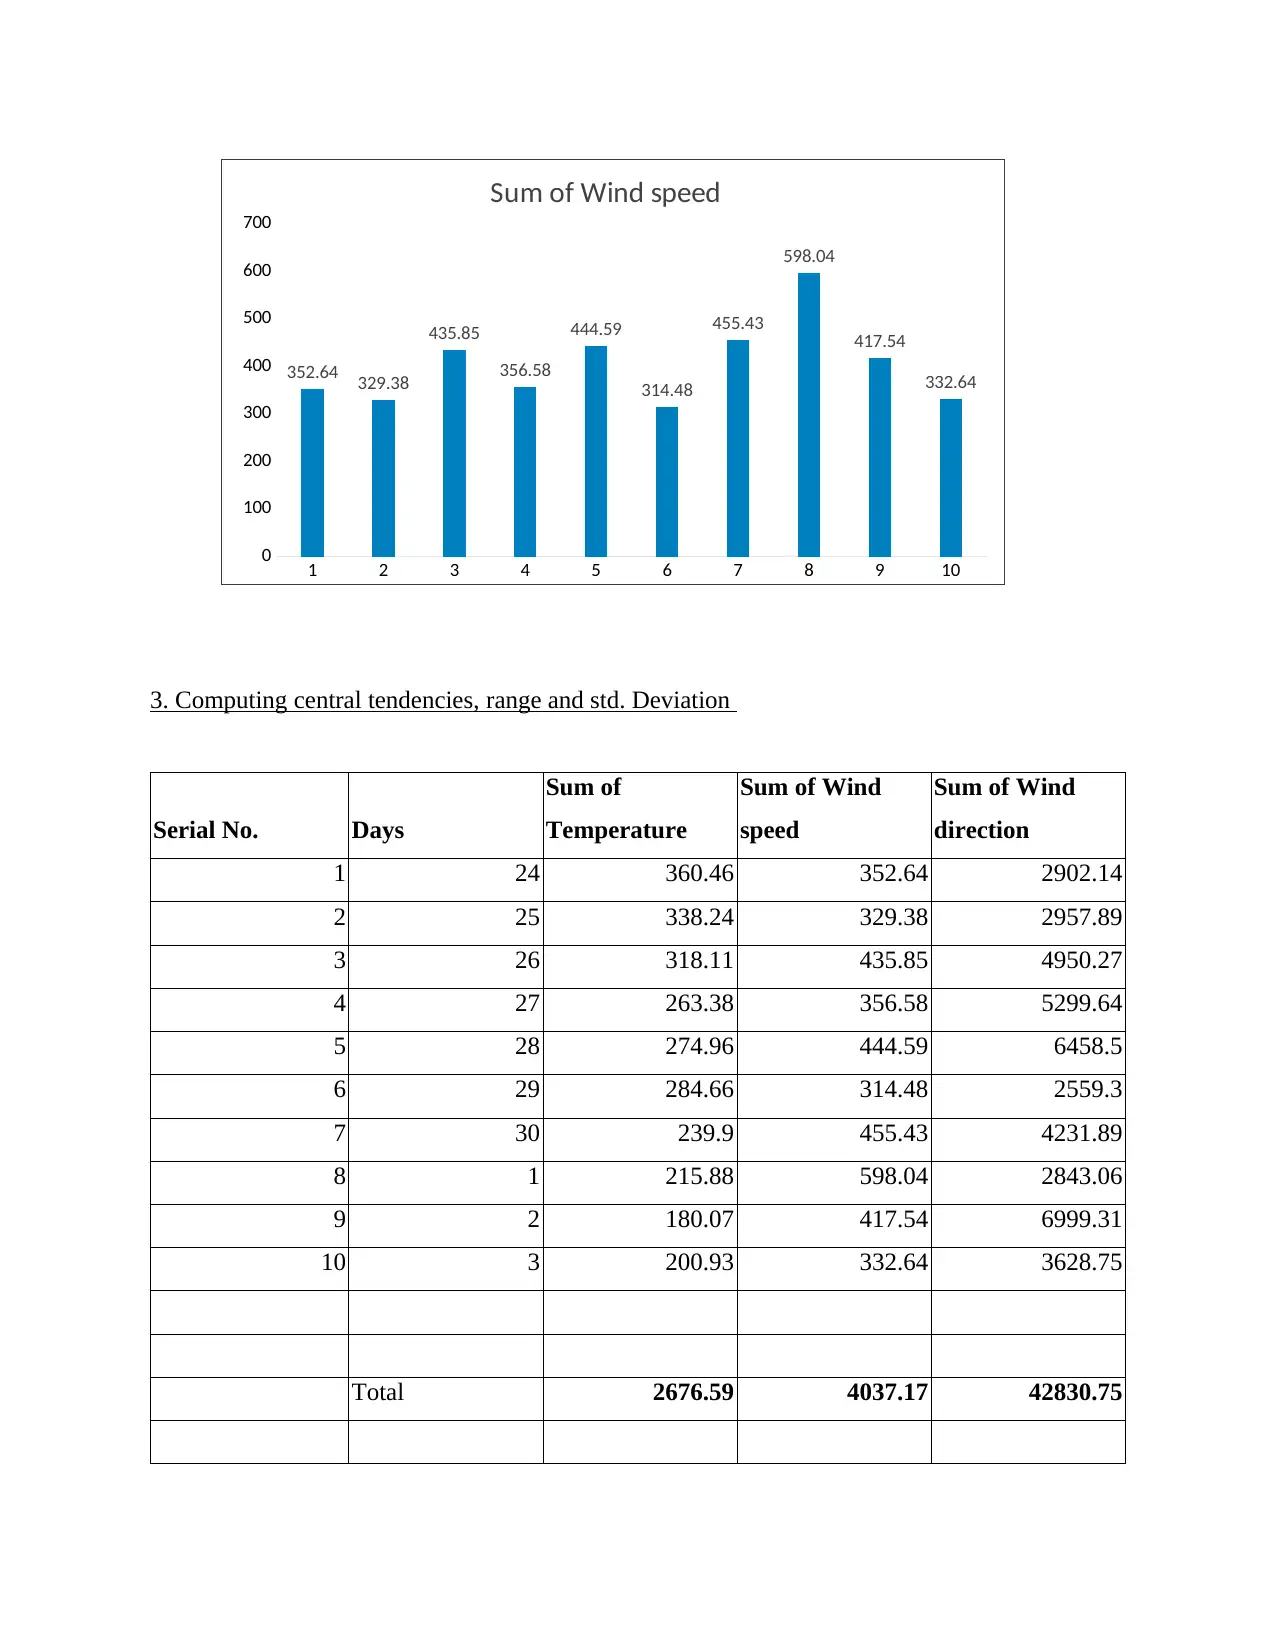
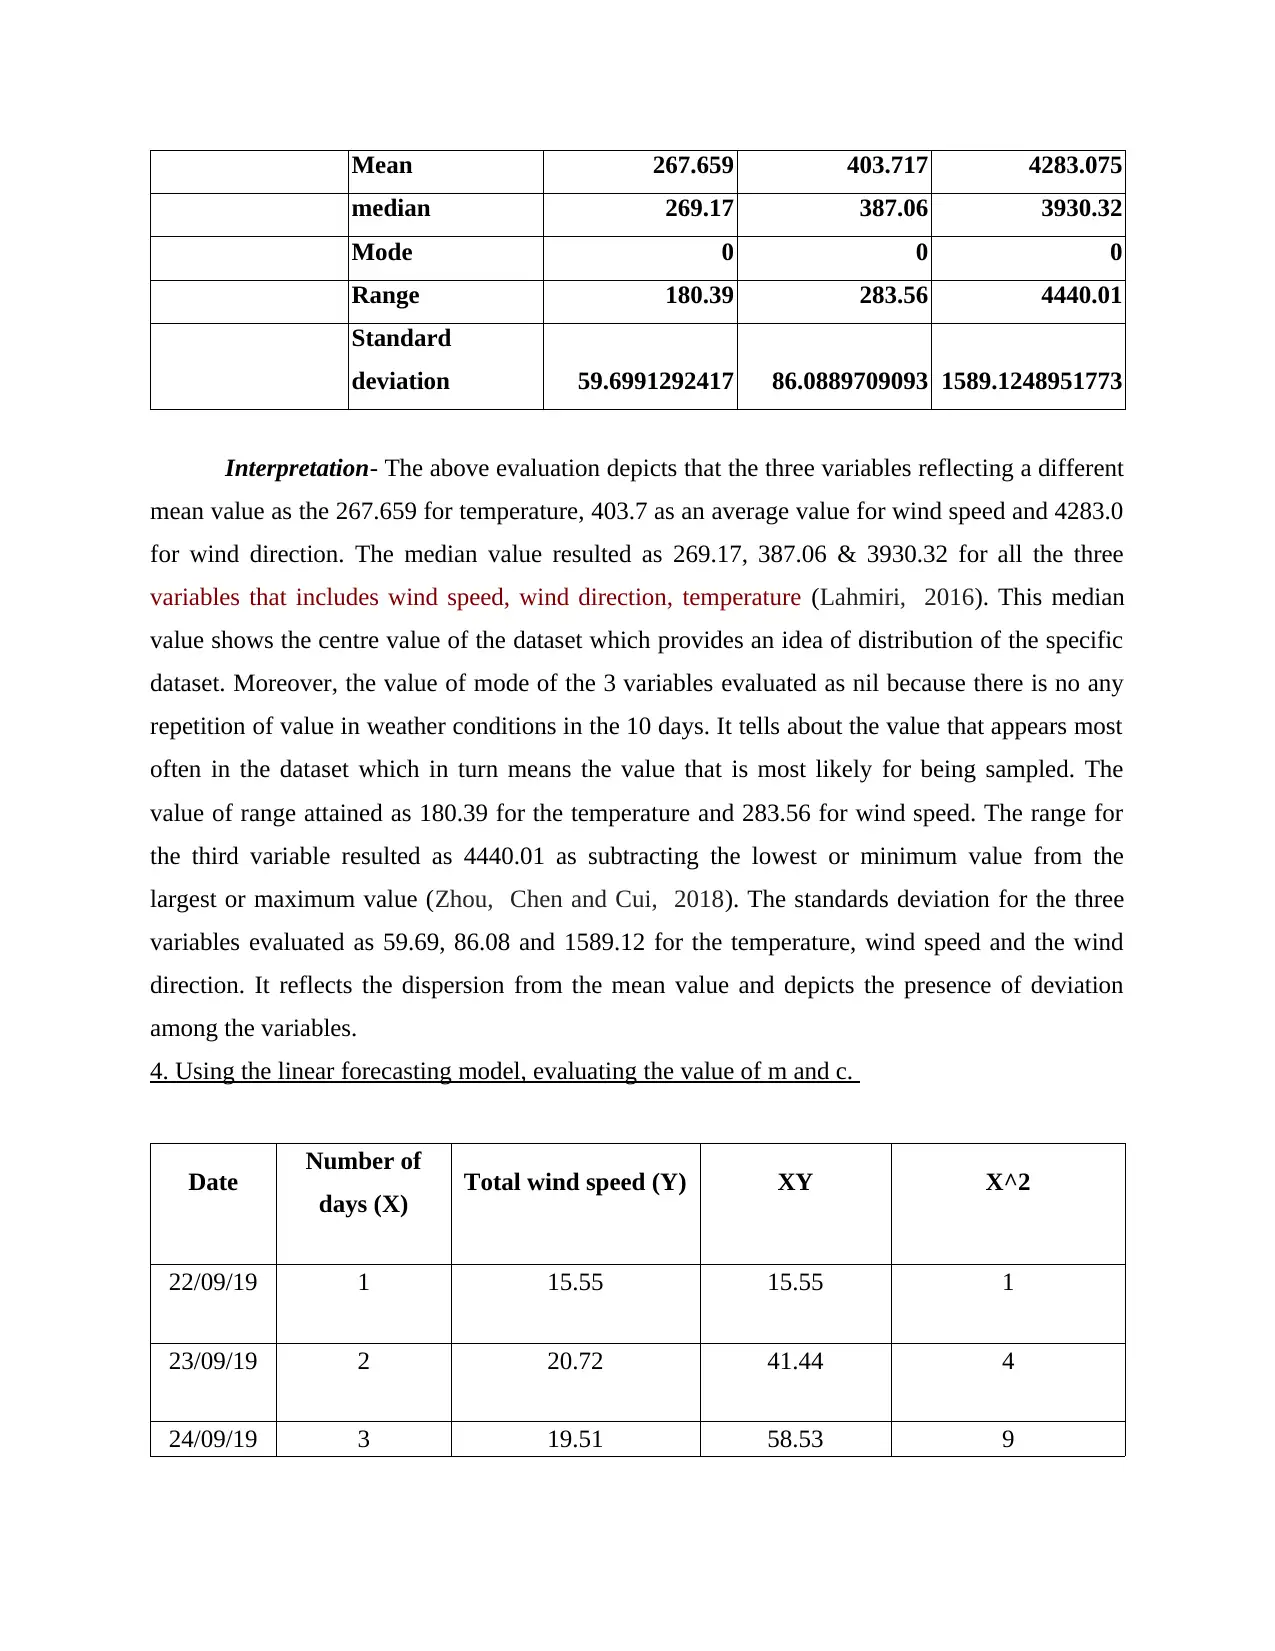
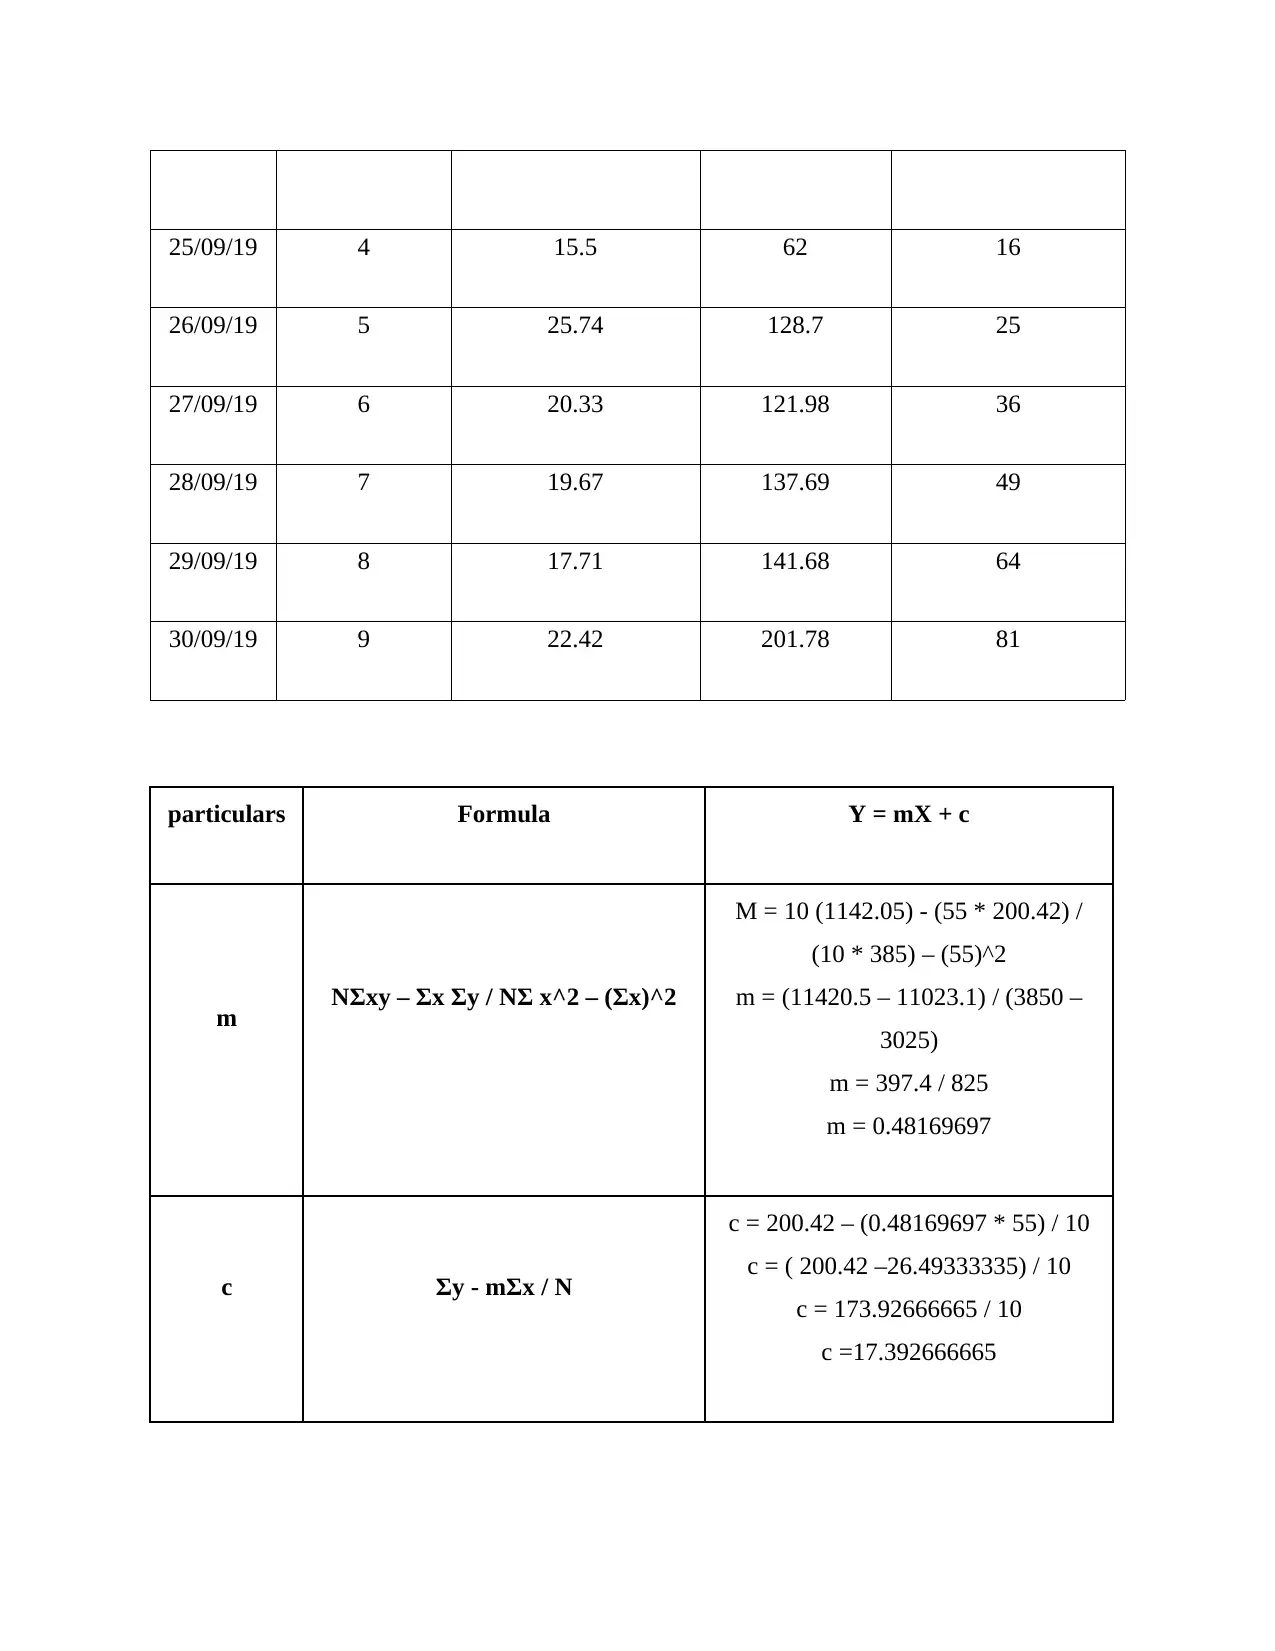
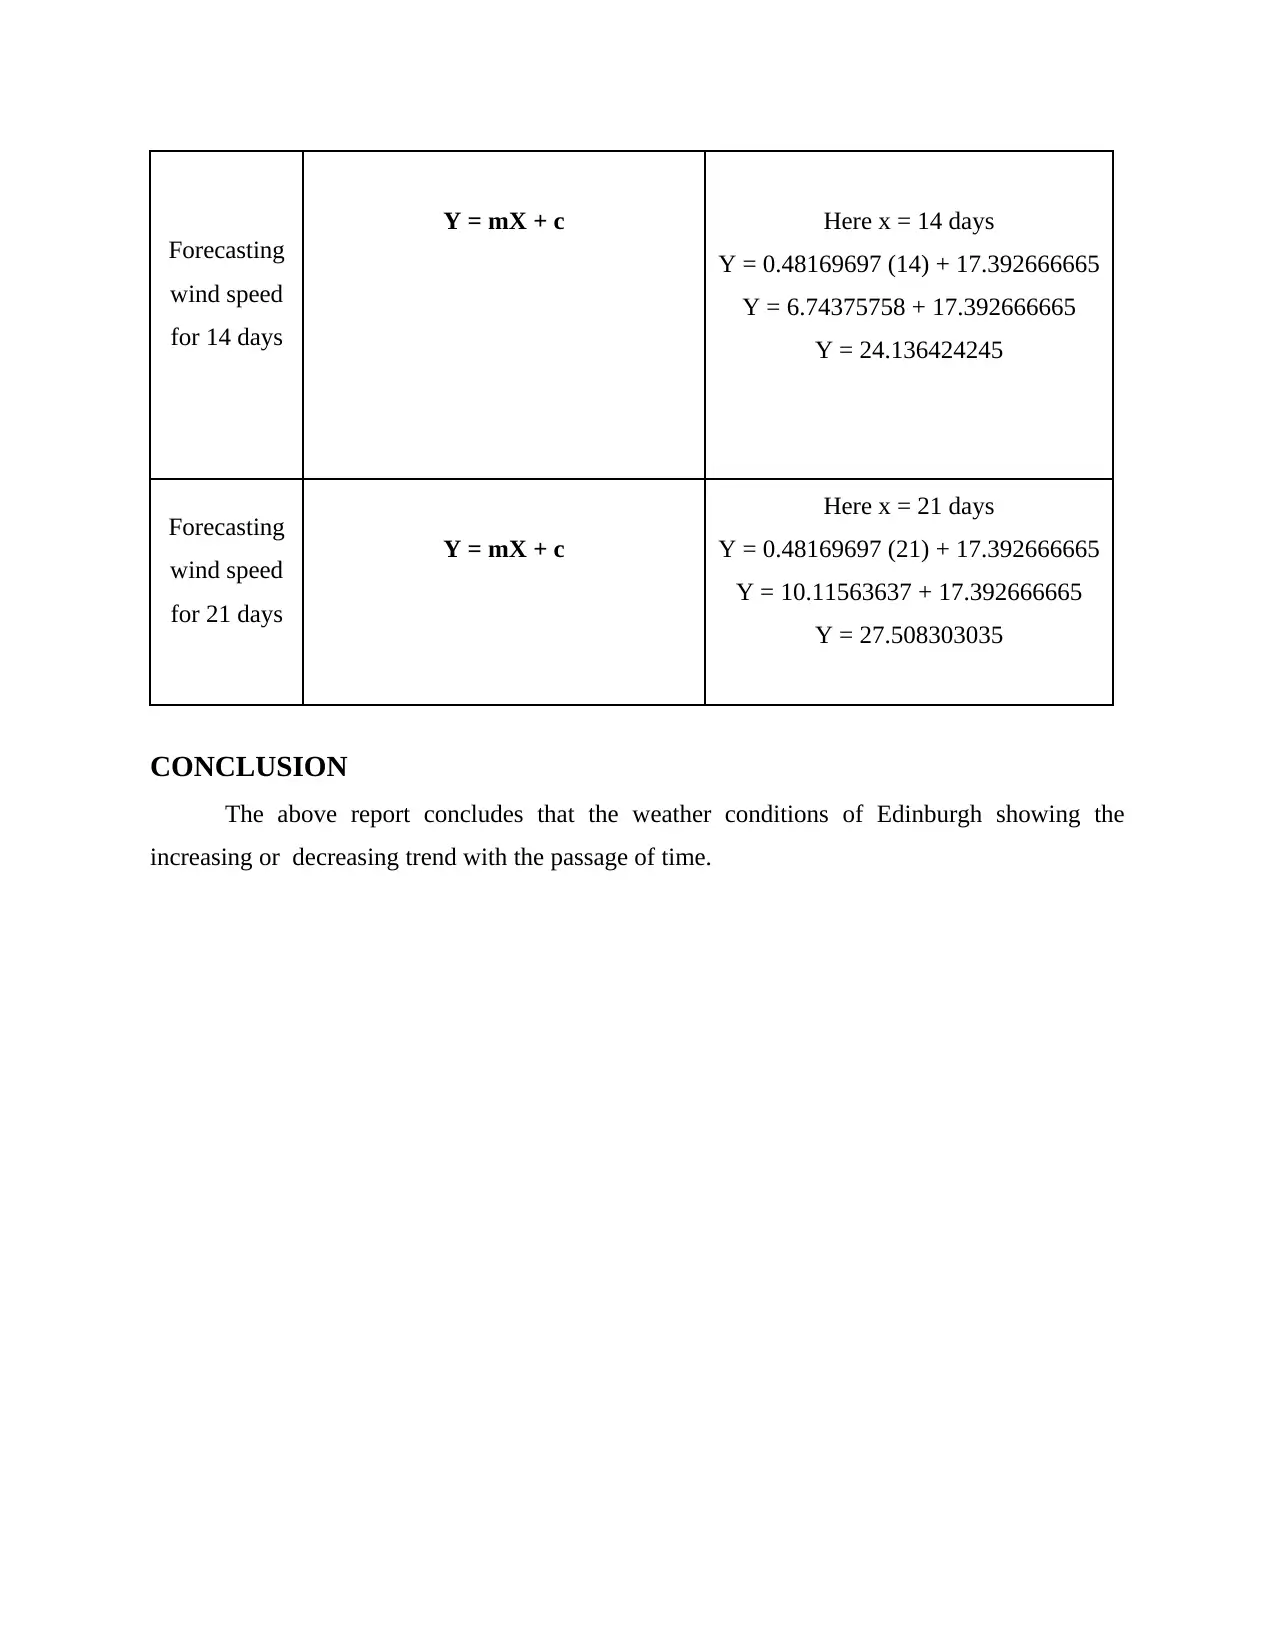
This report presents a comprehensive analysis of Edinburgh's weather conditions, focusing on data analysis and forecasting techniques. The analysis is based on ten days of wind speed data, along with temperature and wind direction. The report begins with arranging the data in a tabular form and presents it using scatter and bar graphs for visualization. It then computes central tendencies (mean, median, mode), range, and standard deviation for the variables. The report further employs a linear forecasting model to evaluate the values of 'm' and 'c' and forecasts the wind speed for 14 and 21 days. The conclusion summarizes the trends observed in Edinburgh's weather, highlighting increasing or decreasing patterns over time. The report utilizes various statistical methods and data visualization techniques to provide insights into the weather patterns of Edinburgh.
Document Page
Data Analysis and Forecasting
tabler-icon-diamond-filled.svg

Paraphrase This Document

Need a fresh take? Get an instant paraphrase of this document with our AI Paraphraser
Document Page
Table of Contents
Document Page
INTRODUCTION
Numeracy is an ability for applying the numerical concepts that involves the fundamental
arithmetic such as subtraction, division, addition and multiplication. Numeracy and data analysis
refers to the practice in evaluating the data by using the statistical and the analytical tools fro
discovering the useful information and helps the business in making suitable decisions. The
present report highlights the weather conditions of Edinburgh , a city present in United Kingdom.
Furthermore, the analysis is based on wind speed for the period of ten days. Moreover, it
involves the assessment average value, mid value, modal value, range and standard deviation of
the different variables.
1. Arranging data in tabular form
Data
Serial
no. Day
Sum of
Temperature
Sum of Wind
speed
Sum of Wind
direction
1 24 360.46 352.64 2902.14
2 25 338.24 329.38 2957.89
3 26 318.11 435.85 4950.27
4 27 263.38 356.58 5299.64
5 28 274.96 444.59 6458.5
6 29 284.66 314.48 2559.3
7 30 239.9 455.43 4231.89
8 1 215.88 598.04 2843.06
9 2 180.07 417.54 6999.31
10 3 200.93 332.64 3628.75
Grand
Total 2676.59 4037.17 42830.75
2. presenting data into 2 kinds of chart form
Document Page
Scattered chart- It is the simplest method that helps in studying correlation among the
variables within which the value for each of the variable is been plotted on the graph in form of
the dots and resulted in obtaining as much as points in a way of number of observation. Scatter
diagrams are counted as the convenient the mathematical diagram that uses cartesian coordinates
fro displaying the values typically for the dataset that involves two variables.
Bar graph- It means the chart that uses the bars for showing the comparison in between
the categories of the data. The bar graph is presented either in the vertical or in horizontal form.
Bar graphs are been used for comparing the things between the different groups or for tracking
the changes over the time (Zhang and et.al., 2016). It is also been used for comparing values of
various items within a group at a particular point of time.
150 200 250 300 350 400
0
100
200
300
400
500
600
700
352.64
329.38
435.85
356.58
444.59
314.48
455.43
598.04
417.54
332.64
Sum of Wind speed
tabler-icon-diamond-filled.svg

Paraphrase This Document

Need a fresh take? Get an instant paraphrase of this document with our AI Paraphraser
Document Page
3. Computing central tendencies, range and std. Deviation
Serial No. Days
Sum of
Temperature
Sum of Wind
speed
Sum of Wind
direction
1 24 360.46 352.64 2902.14
2 25 338.24 329.38 2957.89
3 26 318.11 435.85 4950.27
4 27 263.38 356.58 5299.64
5 28 274.96 444.59 6458.5
6 29 284.66 314.48 2559.3
7 30 239.9 455.43 4231.89
8 1 215.88 598.04 2843.06
9 2 180.07 417.54 6999.31
10 3 200.93 332.64 3628.75
Total 2676.59 4037.17 42830.75
1 2 3 4 5 6 7 8 9 10
0
100
200
300
400
500
600
700
352.64 329.38
435.85
356.58
444.59
314.48
455.43
598.04
417.54
332.64
Sum of Wind speed
Document Page
Mean 267.659 403.717 4283.075
median 269.17 387.06 3930.32
Mode 0 0 0
Range 180.39 283.56 4440.01
Standard
deviation 59.6991292417 86.0889709093 1589.1248951773
Interpretation- The above evaluation depicts that the three variables reflecting a different
mean value as the 267.659 for temperature, 403.7 as an average value for wind speed and 4283.0
for wind direction. The median value resulted as 269.17, 387.06 & 3930.32 for all the three
variables that includes wind speed, wind direction, temperature (Lahmiri, 2016). This median
value shows the centre value of the dataset which provides an idea of distribution of the specific
dataset. Moreover, the value of mode of the 3 variables evaluated as nil because there is no any
repetition of value in weather conditions in the 10 days. It tells about the value that appears most
often in the dataset which in turn means the value that is most likely for being sampled. The
value of range attained as 180.39 for the temperature and 283.56 for wind speed. The range for
the third variable resulted as 4440.01 as subtracting the lowest or minimum value from the
largest or maximum value (Zhou, Chen and Cui, 2018). The standards deviation for the three
variables evaluated as 59.69, 86.08 and 1589.12 for the temperature, wind speed and the wind
direction. It reflects the dispersion from the mean value and depicts the presence of deviation
among the variables.
4. Using the linear forecasting model, evaluating the value of m and c.
Date Number of
days (X) Total wind speed (Y) XY X^2
22/09/19 1 15.55 15.55 1
23/09/19 2 20.72 41.44 4
24/09/19 3 19.51 58.53 9
Document Page
25/09/19 4 15.5 62 16
26/09/19 5 25.74 128.7 25
27/09/19 6 20.33 121.98 36
28/09/19 7 19.67 137.69 49
29/09/19 8 17.71 141.68 64
30/09/19 9 22.42 201.78 81
particulars Formula Y = mX + c
m NΣxy – Σx Σy / NΣ x^2 – (Σx)^2
M = 10 (1142.05) - (55 * 200.42) /
(10 * 385) – (55)^2
m = (11420.5 – 11023.1) / (3850 –
3025)
m = 397.4 / 825
m = 0.48169697
c Σy - mΣx / N
c = 200.42 (0.48169697 * 55) / 10
c = ( 200.42 26.49333335) / 10
c = 173.92666665 / 10
c =17.392666665
tabler-icon-diamond-filled.svg

Paraphrase This Document

Need a fresh take? Get an instant paraphrase of this document with our AI Paraphraser
Document Page
Forecasting
wind speed
for 14 days
Y = mX + c Here x = 14 days
Y = 0.48169697 (14) + 17.392666665
Y = 6.74375758 + 17.392666665
Y = 24.136424245
Forecasting
wind speed
for 21 days
Y = mX + c
Here x = 21 days
Y = 0.48169697 (21) + 17.392666665
Y = 10.11563637 + 17.392666665
Y = 27.508303035
CONCLUSION
The above report concludes that the weather conditions of Edinburgh showing the
increasing or decreasing trend with the passage of time.
Document Page
REFERENCES
Books and journals
Lahmiri, S., 2016. A variational mode decompoisition approach for analysis and forecasting of
economic and financial time series. Expert Systems with Applications, 55, pp.268-273.
Zhang, Y. and et.al., 2016. Topic analysis and forecasting for science, technology and
innovation: Methodology with a case study focusing on big data research. Technological
Forecasting and Social Change. 105. pp.179-191.
Zhou, W., Chen, X. and Cui, B., 2018. A CASE STUDY OF ENVIRONMENTAL
MONITORING DATA ANALYSIS AND FORECASTING MODEL. Mechatronic
Systems and Control, 46(3), pp.127-131.
chevron_up_icon
1 out of 9
circle_padding
hide_on_mobile
zoom_out_icon
[object Object]