Data Analysis and Forecasting: York Weather Report and Linear Model

Verified

Added on  2020/10/05

|9
|1354
|182
Report
AI Summary
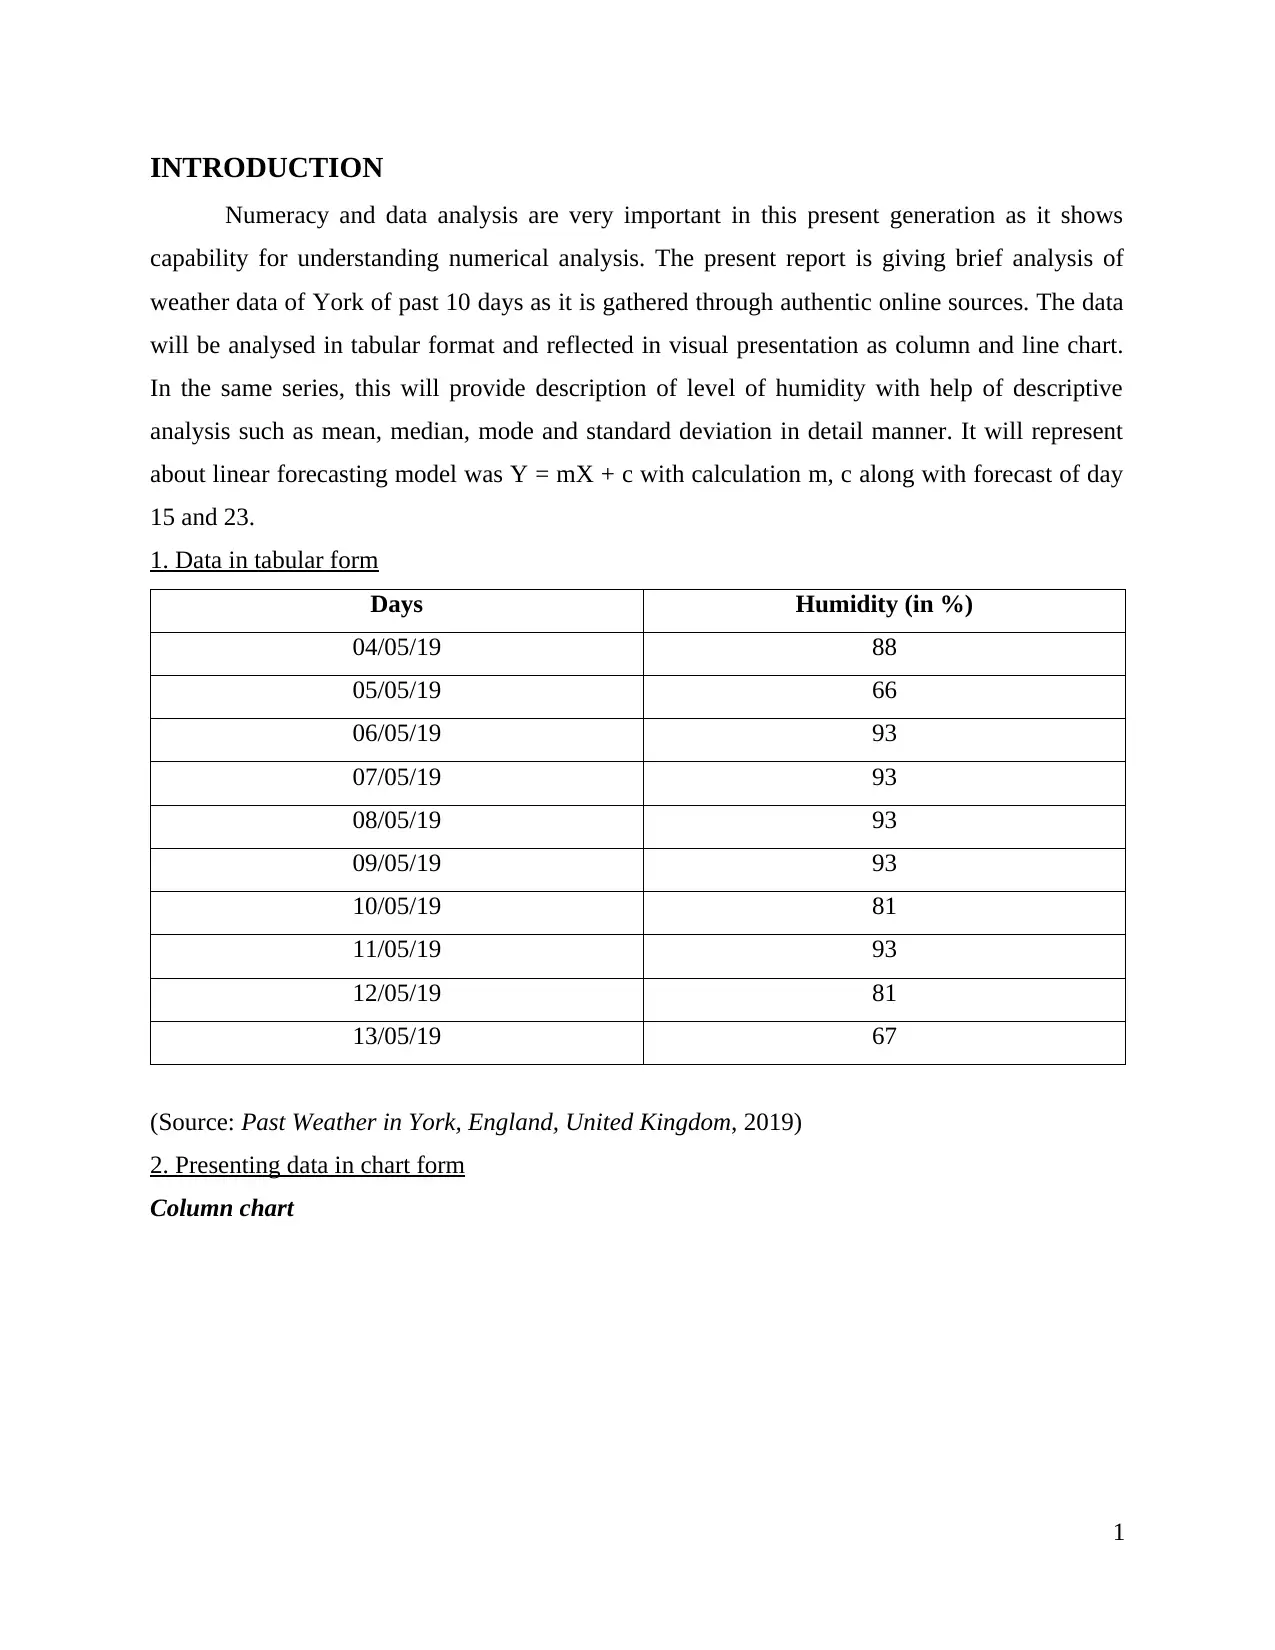
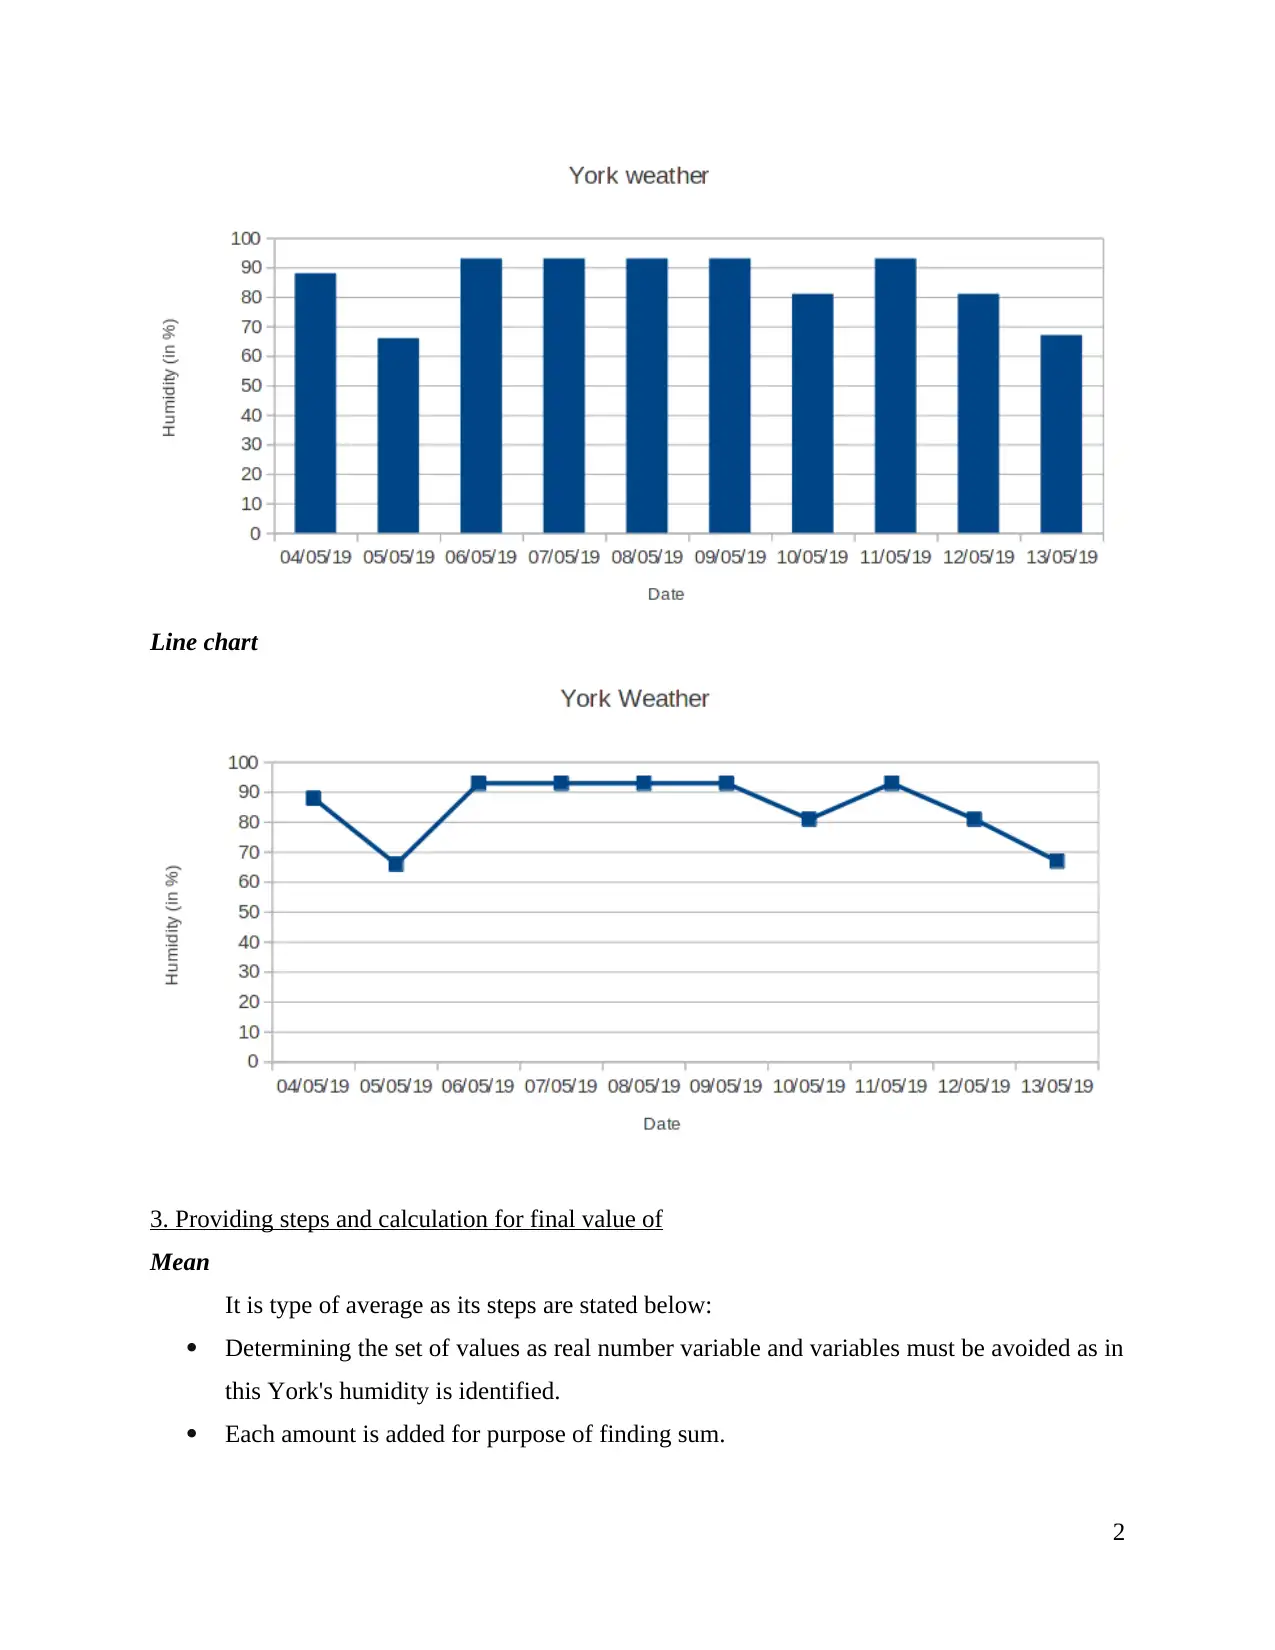
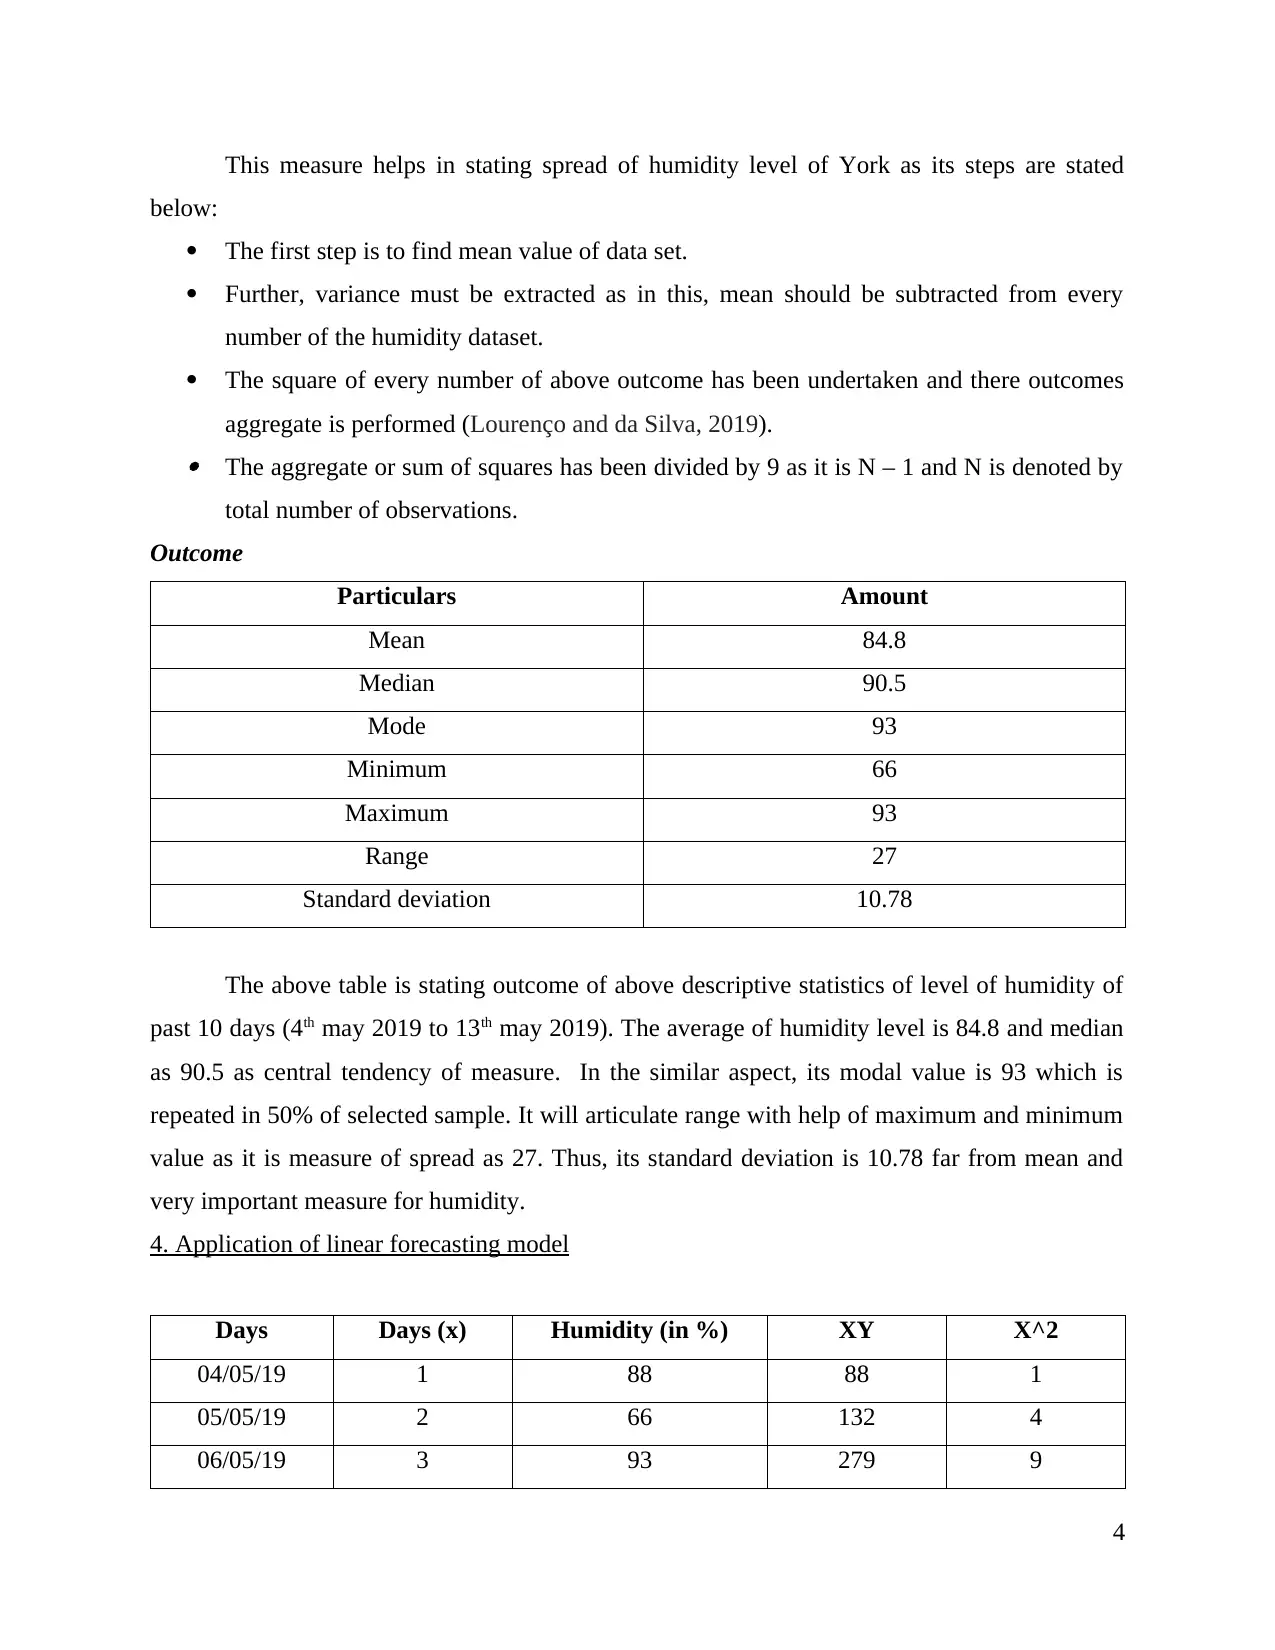
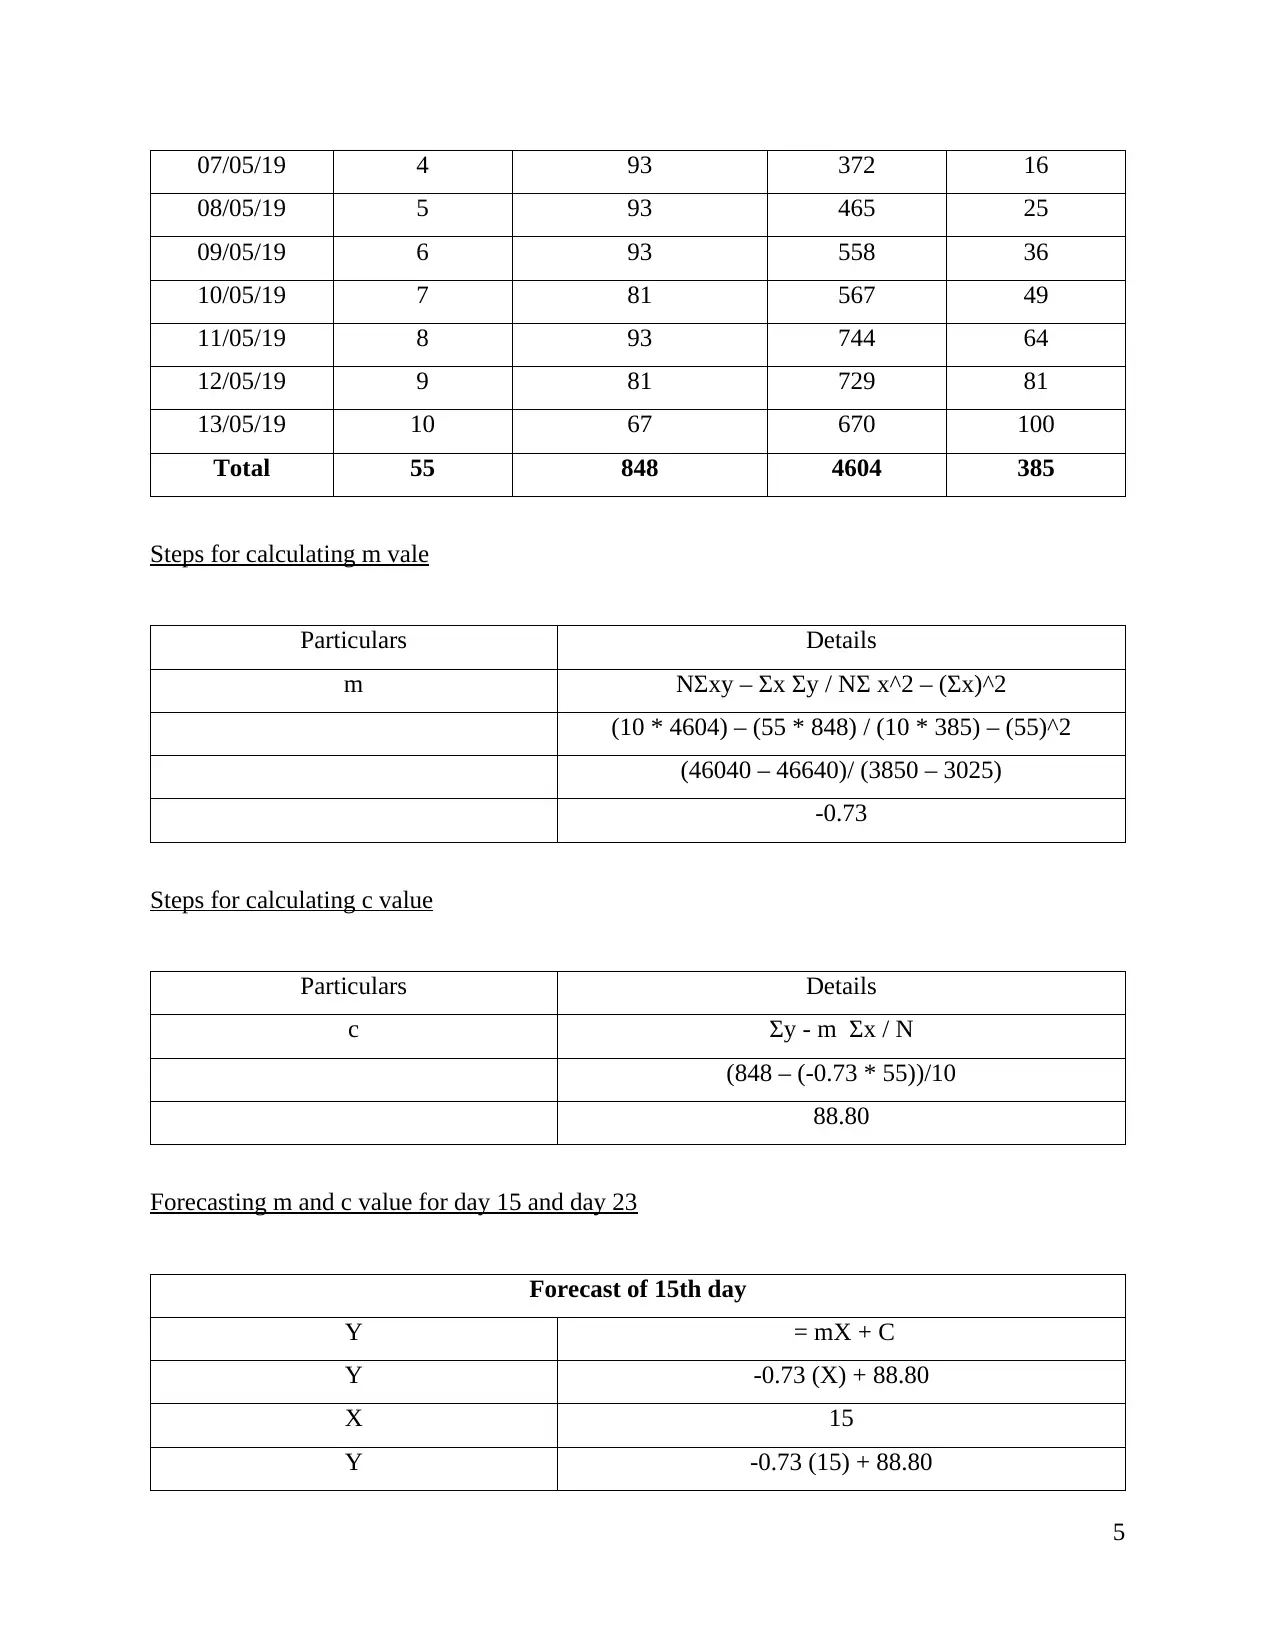
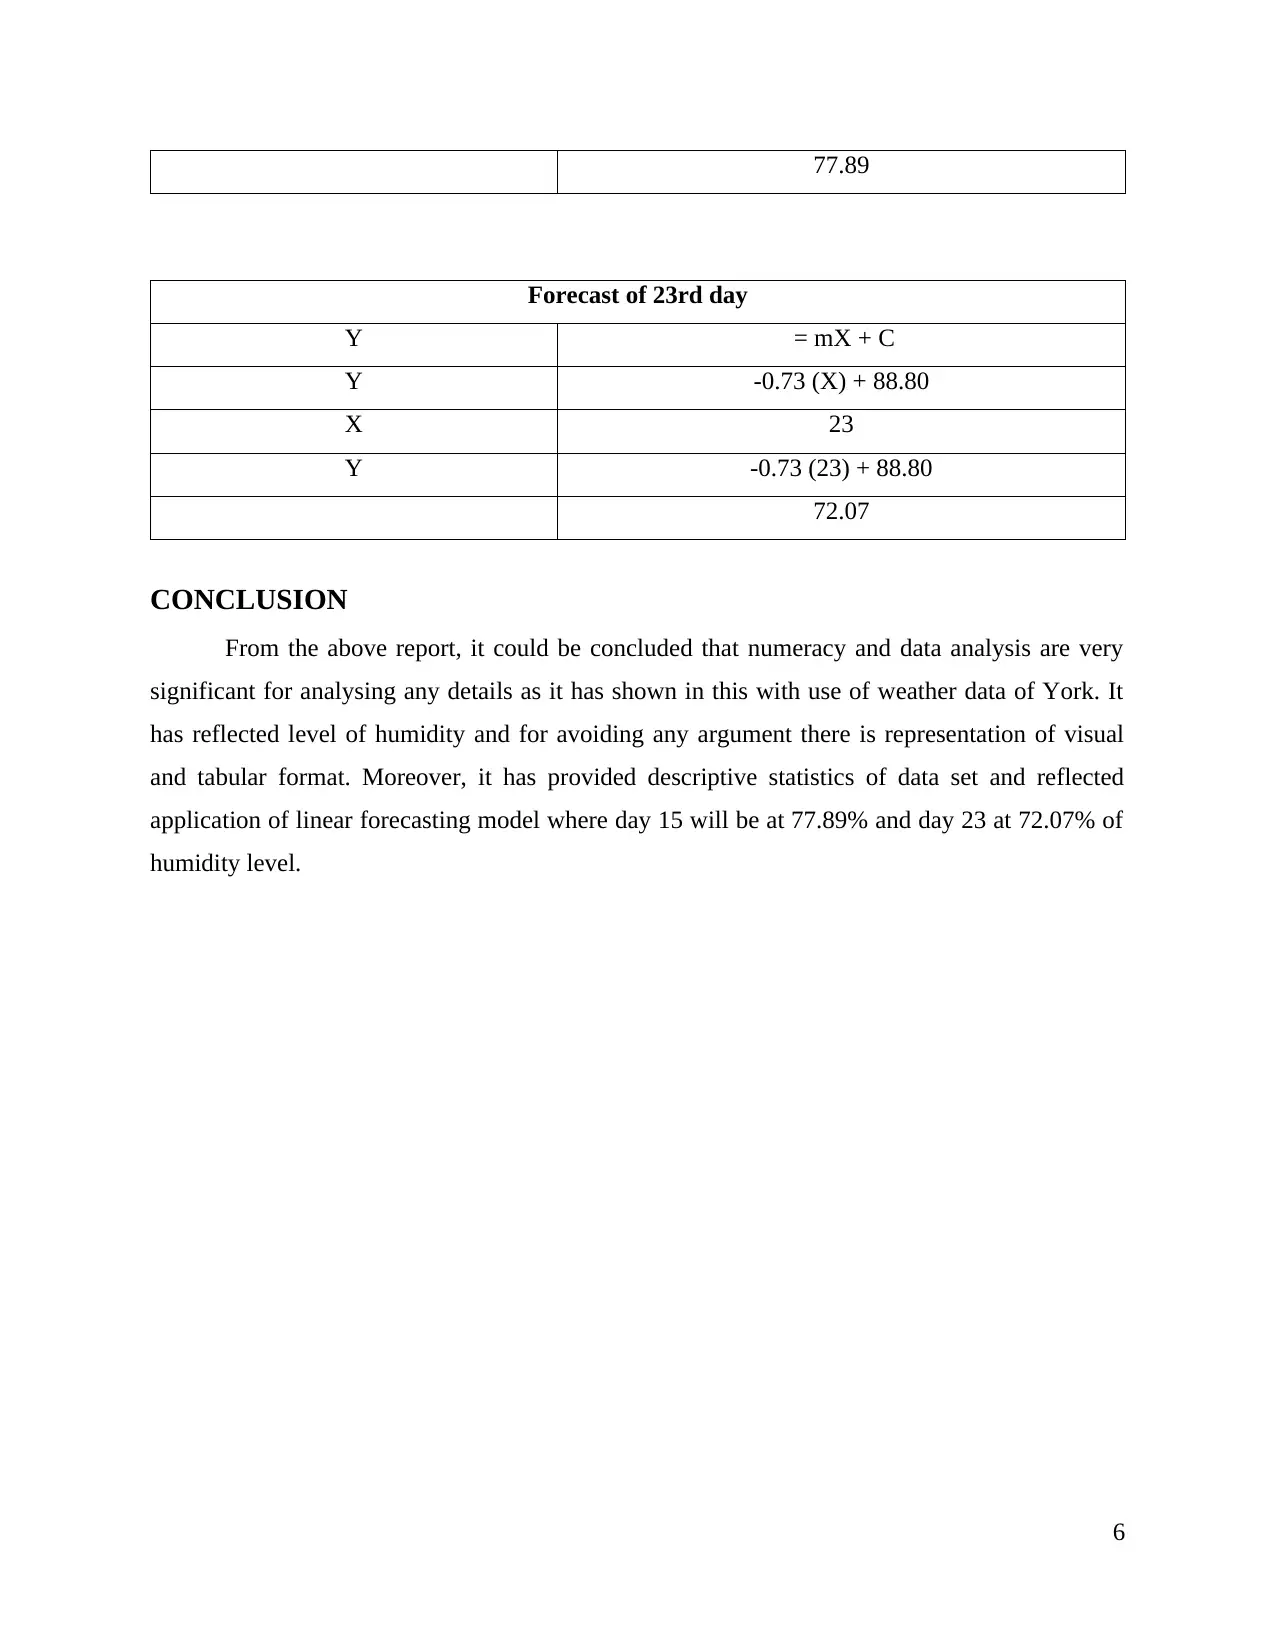
This report provides a comprehensive analysis of York's weather data over a 10-day period, focusing on humidity levels. The analysis begins with a tabular presentation of the data, followed by visual representations using column and line charts. Descriptive statistics, including mean, median, mode, range, and standard deviation, are calculated to provide a detailed understanding of the humidity data. The report then applies a linear forecasting model (Y = mX + c) to predict humidity levels for day 15 and day 23, detailing the steps for calculating the 'm' and 'c' values. The conclusion summarizes the key findings, emphasizing the significance of numeracy and data analysis in understanding and predicting weather patterns. The report includes relevant references from books, journals and online resources.
tabler-icon-diamond-filled.svg

Contribute Materials

Your contribution can guide someone’s learning journey. Share your documents today.
Document Page
NUMERACY AND DATA
ANALYSIS
tabler-icon-diamond-filled.svg

Secure Best Marks with AI Grader

Need help grading? Try our AI Grader for instant feedback on your assignments.
Document Page
TABLE OF CONTENTS
INTRODUCTION...........................................................................................................................1
1. Data in tabular form................................................................................................................1
2. Presenting data in chart form..................................................................................................1
3. Providing steps and calculation for final value of...................................................................2
4. Application of linear forecasting model..................................................................................4
Steps for calculating m vale........................................................................................................5
Steps for calculating c value.......................................................................................................5
Forecasting m and c value for day 15 and day 23.......................................................................5
CONCLUSION................................................................................................................................5
REFERENCES................................................................................................................................7
Document Page
INTRODUCTION
Numeracy and data analysis are very important in this present generation as it shows
capability for understanding numerical analysis. The present report is giving brief analysis of
weather data of York of past 10 days as it is gathered through authentic online sources. The data
will be analysed in tabular format and reflected in visual presentation as column and line chart.
In the same series, this will provide description of level of humidity with help of descriptive
analysis such as mean, median, mode and standard deviation in detail manner. It will represent
about linear forecasting model was Y = mX + c with calculation m, c along with forecast of day
15 and 23.
1. Data in tabular form
Days Humidity (in %)
04/05/19 88
05/05/19 66
06/05/19 93
07/05/19 93
08/05/19 93
09/05/19 93
10/05/19 81
11/05/19 93
12/05/19 81
13/05/19 67
(Source: Past Weather in York, England, United Kingdom, 2019)
2. Presenting data in chart form
Column chart
1
Document Page
Line chart
3. Providing steps and calculation for final value of
Mean
It is type of average as its steps are stated below:
Determining the set of values as real number variable and variables must be avoided as in
this York's humidity is identified.
Each amount is added for purpose of finding sum.
2
tabler-icon-diamond-filled.svg

Secure Best Marks with AI Grader

Need help grading? Try our AI Grader for instant feedback on your assignments.
Document Page
Every number is counted and even identical values also be counted like 93 is similar in
various observations. The sum of humidity is divided through the count of number of the values as this is final
outcome for mean.
Median
Its first step is to determine that data set belongs to mean or odd value as our data of
humidity level of York is comprised in even dataset because of 10 observations.
The data must be arranged or sorted in ascending order as least to greatest.
In this step, there should be extraction of exact middle value as in our data set of York's
humidity consist of two middle value as 5th and 6th value (Sarstedt and Mooi, 2019). Further, both middle values are aggregated and divided by 2 gives final outcome for
median of humidity of the entire data set.
Mode
In simple words, the number which appears very often is replicated as mode. The steps
for calculating mode are stated below:
Listing the numbers in data set from statistical data points along with list of numerical
values.
The important step for extracting mode is that, order numbers in increasing manner or it
could be termed as smallest to largest.
Further, count the numbers of every number repeated as its appearance. Identifying the value which is occurring highest time as it should be more than 1 is final
outcome for mode.
Range
It reflects difference among the data set's highest and lowest value and it reflects spread
out values in specific series, its detail steps are listed below:
The elements must be listed at one place.
Identifying the lowest and highest number in data related to York's humidity. The lowest number should be excluded from the largest number as last number – first
number in above series is stated as range.
Standard deviation
3
Document Page
This measure helps in stating spread of humidity level of York as its steps are stated
below:
The first step is to find mean value of data set.
Further, variance must be extracted as in this, mean should be subtracted from every
number of the humidity dataset.
The square of every number of above outcome has been undertaken and there outcomes
aggregate is performed (Lourenço and da Silva, 2019). The aggregate or sum of squares has been divided by 9 as it is N – 1 and N is denoted by
total number of observations.
Outcome
Particulars Amount
Mean 84.8
Median 90.5
Mode 93
Minimum 66
Maximum 93
Range 27
Standard deviation 10.78
The above table is stating outcome of above descriptive statistics of level of humidity of
past 10 days (4th may 2019 to 13th may 2019). The average of humidity level is 84.8 and median
as 90.5 as central tendency of measure. In the similar aspect, its modal value is 93 which is
repeated in 50% of selected sample. It will articulate range with help of maximum and minimum
value as it is measure of spread as 27. Thus, its standard deviation is 10.78 far from mean and
very important measure for humidity.
4. Application of linear forecasting model
Days Days (x) Humidity (in %) XY X^2
04/05/19 1 88 88 1
05/05/19 2 66 132 4
06/05/19 3 93 279 9
4
Document Page
07/05/19 4 93 372 16
08/05/19 5 93 465 25
09/05/19 6 93 558 36
10/05/19 7 81 567 49
11/05/19 8 93 744 64
12/05/19 9 81 729 81
13/05/19 10 67 670 100
Total 55 848 4604 385
Steps for calculating m vale
Particulars Details
m NΣxy – Σx Σy / NΣ x^2 – (Σx)^2
(10 * 4604) – (55 * 848) / (10 * 385) – (55)^2
(46040 – 46640)/ (3850 – 3025)
-0.73
Steps for calculating c value
Particulars Details
c Σy - m Σx / N
(848 – (-0.73 * 55))/10
88.80
Forecasting m and c value for day 15 and day 23
Forecast of 15th day
Y = mX + C
Y -0.73 (X) + 88.80
X 15
Y -0.73 (15) + 88.80
5
tabler-icon-diamond-filled.svg

Paraphrase This Document

Need a fresh take? Get an instant paraphrase of this document with our AI Paraphraser
Document Page
77.89
Forecast of 23rd day
Y = mX + C
Y -0.73 (X) + 88.80
X 23
Y -0.73 (23) + 88.80
72.07
CONCLUSION
From the above report, it could be concluded that numeracy and data analysis are very
significant for analysing any details as it has shown in this with use of weather data of York. It
has reflected level of humidity and for avoiding any argument there is representation of visual
and tabular format. Moreover, it has provided descriptive statistics of data set and reflected
application of linear forecasting model where day 15 will be at 77.89% and day 23 at 72.07% of
humidity level.
6
Document Page
REFERENCES
Books and Journals
Lourenço, F. R. and da Silva, R. J. B., 2019. Risk of false conformity decisions of
multicomponent items controlled by correlated measurement results due to the sharing of
analytical steps. Talanta. 196. pp.174-181.
Sarstedt, M. and Mooi, E., 2019. Descriptive Statistics. In A Concise Guide to Market
Research (pp. 91-150). Springer, Berlin, Heidelberg.
Online
Past Weather in York, England, United Kingdom. 2019. [Online]. Available through
<https://www.timeanddate.com/weather/uk/york/historic>.
7
chevron_up_icon
1 out of 9
circle_padding
hide_on_mobile
zoom_out_icon
logo.png

Your All-in-One AI-Powered Toolkit for Academic Success.

Available 24*7 on WhatsApp / Email

[object Object]