Financial Analysis of Webjet Limited: Applied Finance Case Study
VerifiedAdded on 2023/01/04
|31
|6534
|74
Case Study
AI Summary
This case study offers a comprehensive financial analysis of Webjet Limited, evaluating its corporate governance structure, risk and return profile, dividend policy, and overall financial performance. The analysis begins with an overview of Webjet's corporate governance, including the roles of the CEO and board of directors, and examines the company's ownership structure. It then delves into the assessment of risk and return, using regression analysis to determine historical risk parameters and estimate the cost of equity. Furthermore, the study explores the company's financial sources, including debt and dividend policies, and examines its valuation using various approaches, such as FCFF, DDM, and PE ratios. The report concludes with recommendations for investors, suggesting whether to hold or sell the stock based on the findings, and offers insights into the company's competitive strengths and weaknesses. The analysis is based on the company's annual reports and financial data, with the aim of providing a clear understanding of Webjet's financial position and future prospects.
Running Head: Applied Finance
1
Project Report: Applied Finance
1
Project Report: Applied Finance
Paraphrase This Document
Need a fresh take? Get an instant paraphrase of this document with our AI Paraphraser
Applied Finance
2
Executive summary:
The report over the corporate governance, risk and return analysis, valuation, financial
sources etc has been done to measure the overall performance of Web jet limited. The
analysis study explains that company has managed ownership structure, corporate
governance etc at better level. Further, the risk and return position explains that few changes
are required by the company to improve the overall position of the company. Along with that,
it has been found that the credit ratings could be improved of the company with minor
changes into the capital structure level of the company.
The overall study explains that this is the correct time for the stockholders to sell the
stock of the company to get higher return from the market.
Applied Finance
3
Contents
Introduction.......................................................................................................................4
Corporate governance.......................................................................................................4
Chief executive officer.................................................................................................4
Board of directors.........................................................................................................5
Ownership structure......................................................................................................6
Lenders- Bondholders and shareholders.......................................................................7
Financial market consideration.....................................................................................8
Societal constraints.......................................................................................................9
Risk and return................................................................................................................10
Estimating historical risk parameters..........................................................................10
Estimating default risk and cost of debt.....................................................................11
Estimating cost of capital............................................................................................13
Earnings and cash flows.................................................................................................13
Analyzing existing investment...................................................................................13
Assessing competitive strength...................................................................................17
Evaluating sustainability of competes rive strength...................................................18
Financial sources............................................................................................................19
Assessing current financing........................................................................................19
Benefits of debt...........................................................................................................19
Cost of debt.................................................................................................................20
Dividend policy..............................................................................................................20
Historical dividend policy analysis.............................................................................20
Firm characteristics.....................................................................................................21
⊘ This is a preview!⊘
Do you want full access?
Subscribe today to unlock all pages.
Trusted by 1+ million students worldwide
Applied Finance
4
Cash/ trust nexus.........................................................................................................21
Peer group...................................................................................................................22
Valuation.........................................................................................................................22
FCFF approach...........................................................................................................22
DDM approach...........................................................................................................25
PE approach................................................................................................................26
Conclusion......................................................................................................................26
References.......................................................................................................................28
Appendix.........................................................................................................................30
Paraphrase This Document
Need a fresh take? Get an instant paraphrase of this document with our AI Paraphraser
Applied Finance
5
Introduction:
In the report, analysis will go through the corporate governance structure of the
company, risk and return investment position of the company, dividend management, cash
management, capital management, and financial performance management etc of the
company. The report has been prepared to recommend the investors about investment into
Web jet. Web jet is a travel business spanning which operates its business at local as well as
global market. The company has been founded in the year of 1998. Since, 1998 company has
faced various ups and downs and the current performance of the company explains about
overall position of the company. The report focuses on all the financial indictors to inform
about the overall position of the company in the industry and the great performance of the
company.
Corporate governance:
Chief executive officer:
Roger Sharp is the CEO of Web jet limited. He has been working since 2017 in the
organization. Annual report (2018) explains that Roger Sharp was involved with the company
at initial level but because of his vast experiences and skills, he has been appointed as new
CEO of the company. He is also one of risk committee member in the organization..
Roger sharp is also at the position of chairperson in the board of directors. He makes
the decision for the board as well as the company to manage the operations and performance
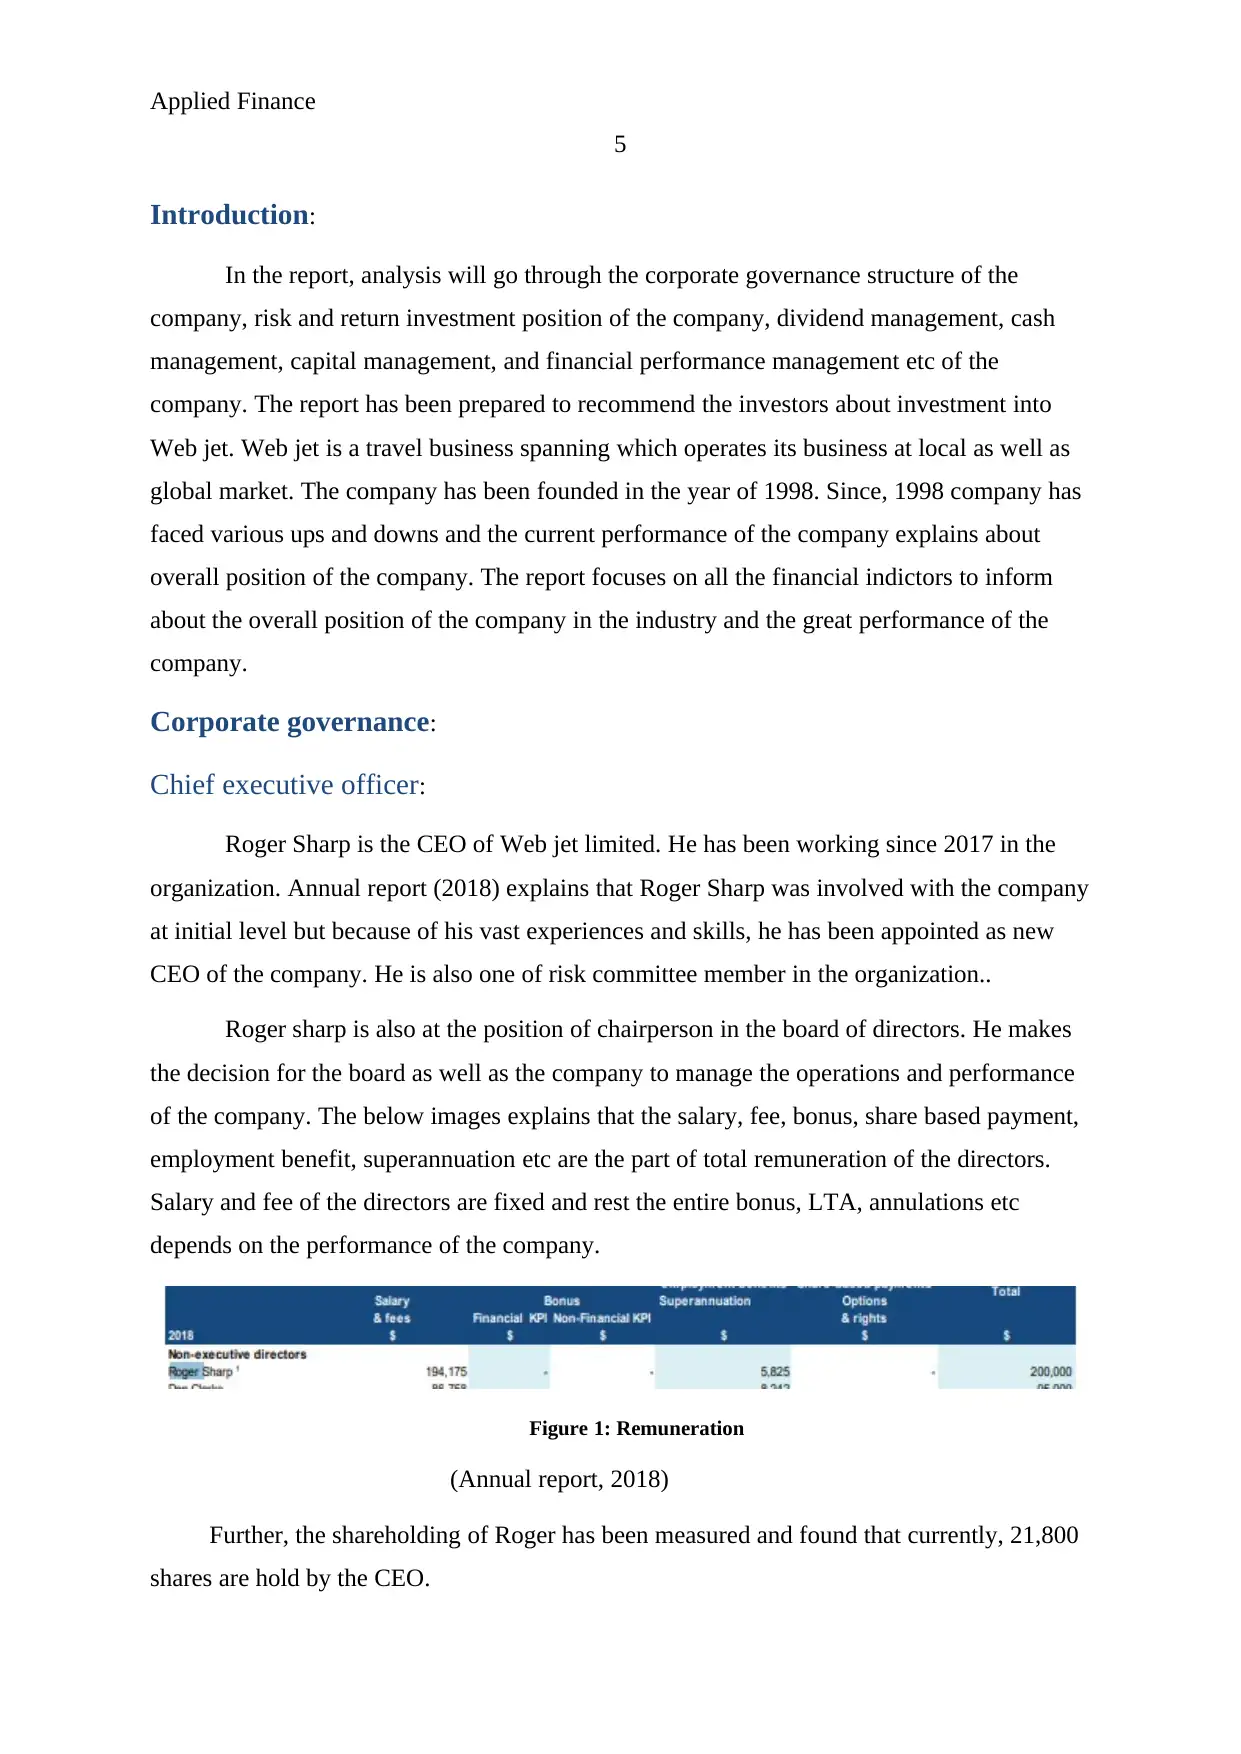
of the company. The below images explains that the salary, fee, bonus, share based payment,
employment benefit, superannuation etc are the part of total remuneration of the directors.
Salary and fee of the directors are fixed and rest the entire bonus, LTA, annulations etc
depends on the performance of the company.
Figure 1: Remuneration
(Annual report, 2018)
Further, the shareholding of Roger has been measured and found that currently, 21,800
shares are hold by the CEO.
5
Introduction:
In the report, analysis will go through the corporate governance structure of the
company, risk and return investment position of the company, dividend management, cash
management, capital management, and financial performance management etc of the
company. The report has been prepared to recommend the investors about investment into
Web jet. Web jet is a travel business spanning which operates its business at local as well as
global market. The company has been founded in the year of 1998. Since, 1998 company has
faced various ups and downs and the current performance of the company explains about
overall position of the company. The report focuses on all the financial indictors to inform
about the overall position of the company in the industry and the great performance of the
company.
Corporate governance:
Chief executive officer:
Roger Sharp is the CEO of Web jet limited. He has been working since 2017 in the
organization. Annual report (2018) explains that Roger Sharp was involved with the company
at initial level but because of his vast experiences and skills, he has been appointed as new
CEO of the company. He is also one of risk committee member in the organization..
Roger sharp is also at the position of chairperson in the board of directors. He makes
the decision for the board as well as the company to manage the operations and performance
of the company. The below images explains that the salary, fee, bonus, share based payment,
employment benefit, superannuation etc are the part of total remuneration of the directors.
Salary and fee of the directors are fixed and rest the entire bonus, LTA, annulations etc
depends on the performance of the company.
Figure 1: Remuneration
(Annual report, 2018)
Further, the shareholding of Roger has been measured and found that currently, 21,800
shares are hold by the CEO.
Applied Finance
6
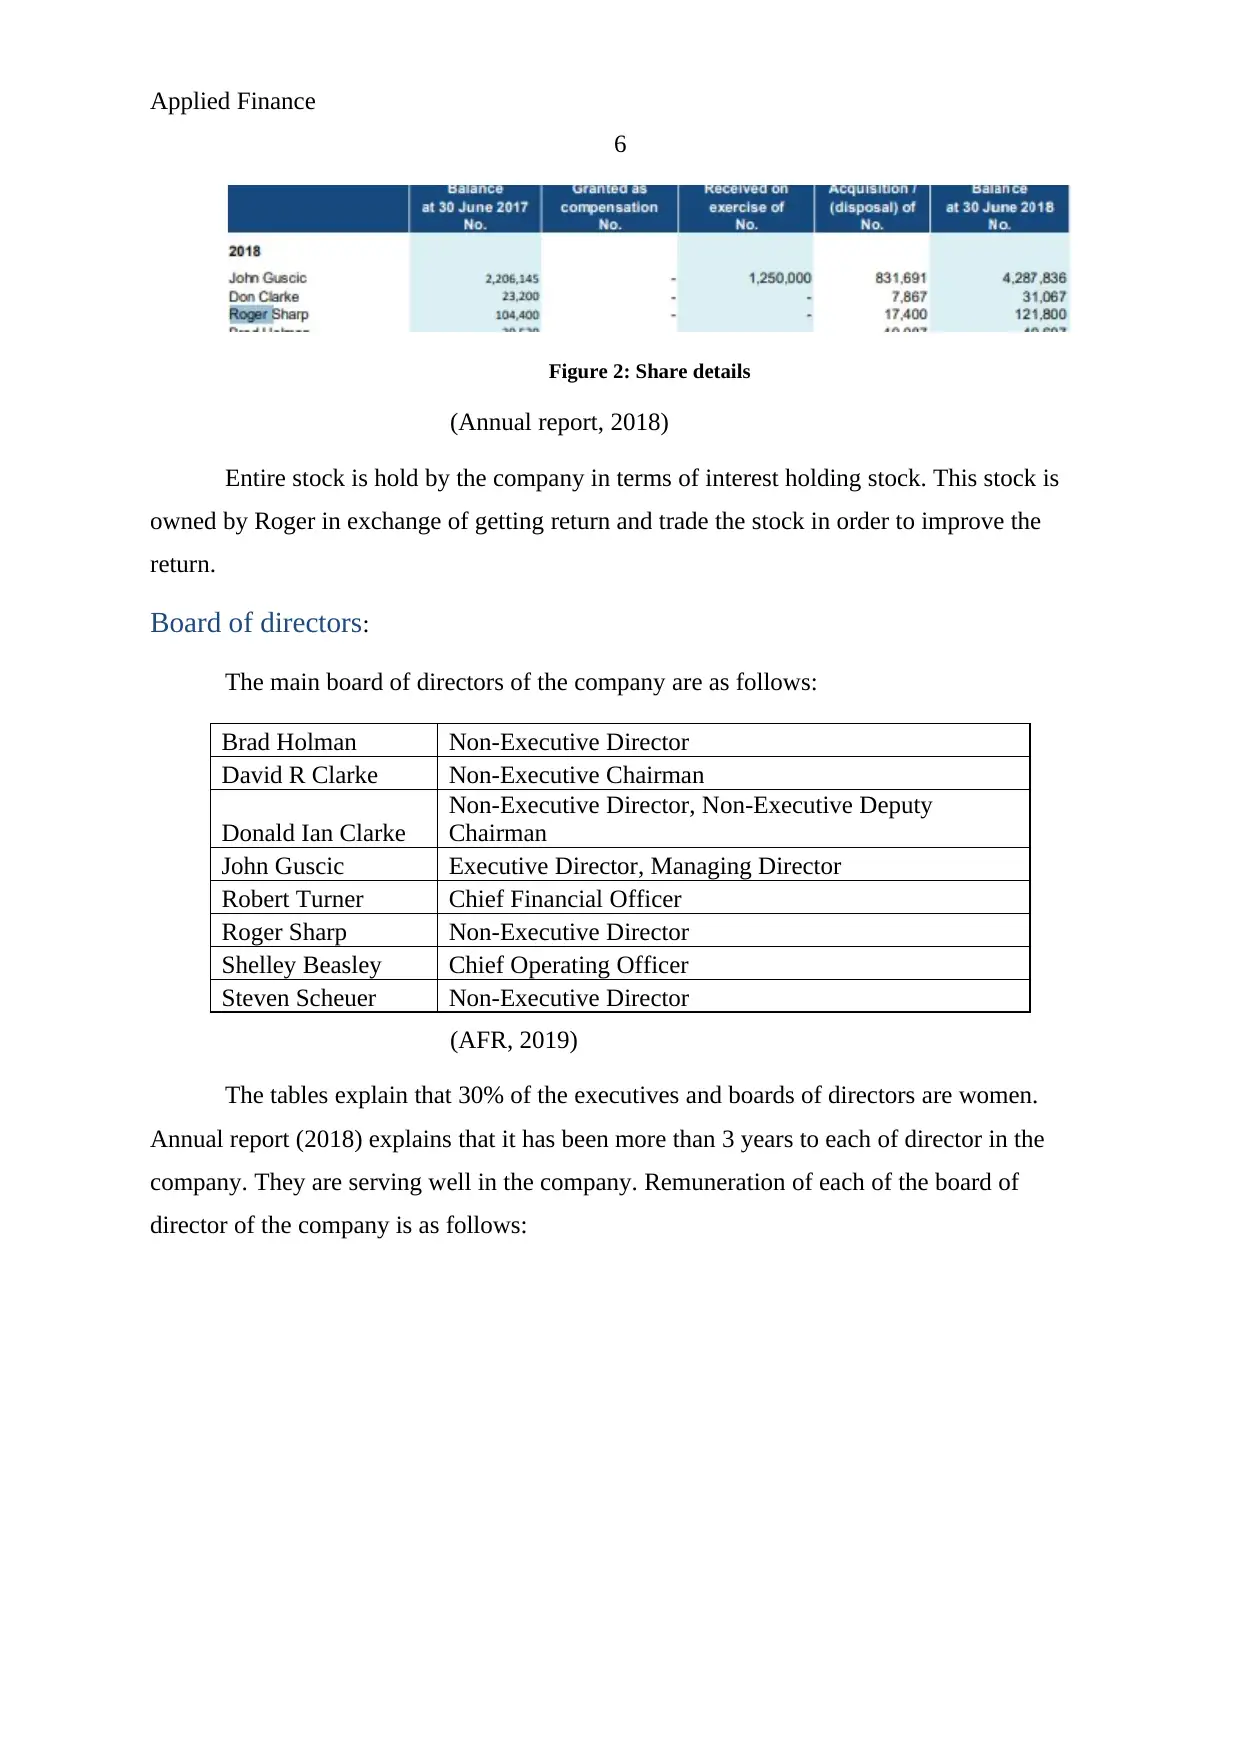
Figure 2: Share details
(Annual report, 2018)
Entire stock is hold by the company in terms of interest holding stock. This stock is
owned by Roger in exchange of getting return and trade the stock in order to improve the
return.
Board of directors:
The main board of directors of the company are as follows:
Brad Holman Non-Executive Director
David R Clarke Non-Executive Chairman
Donald Ian Clarke
Non-Executive Director, Non-Executive Deputy
Chairman
John Guscic Executive Director, Managing Director
Robert Turner Chief Financial Officer
Roger Sharp Non-Executive Director
Shelley Beasley Chief Operating Officer
Steven Scheuer Non-Executive Director
(AFR, 2019)
The tables explain that 30% of the executives and boards of directors are women.
Annual report (2018) explains that it has been more than 3 years to each of director in the
company. They are serving well in the company. Remuneration of each of the board of
director of the company is as follows:
6
Figure 2: Share details
(Annual report, 2018)
Entire stock is hold by the company in terms of interest holding stock. This stock is
owned by Roger in exchange of getting return and trade the stock in order to improve the
return.
Board of directors:
The main board of directors of the company are as follows:
Brad Holman Non-Executive Director
David R Clarke Non-Executive Chairman
Donald Ian Clarke
Non-Executive Director, Non-Executive Deputy
Chairman
John Guscic Executive Director, Managing Director
Robert Turner Chief Financial Officer
Roger Sharp Non-Executive Director
Shelley Beasley Chief Operating Officer
Steven Scheuer Non-Executive Director
(AFR, 2019)
The tables explain that 30% of the executives and boards of directors are women.
Annual report (2018) explains that it has been more than 3 years to each of director in the
company. They are serving well in the company. Remuneration of each of the board of
director of the company is as follows:
⊘ This is a preview!⊘
Do you want full access?
Subscribe today to unlock all pages.
Trusted by 1+ million students worldwide
Applied Finance
7
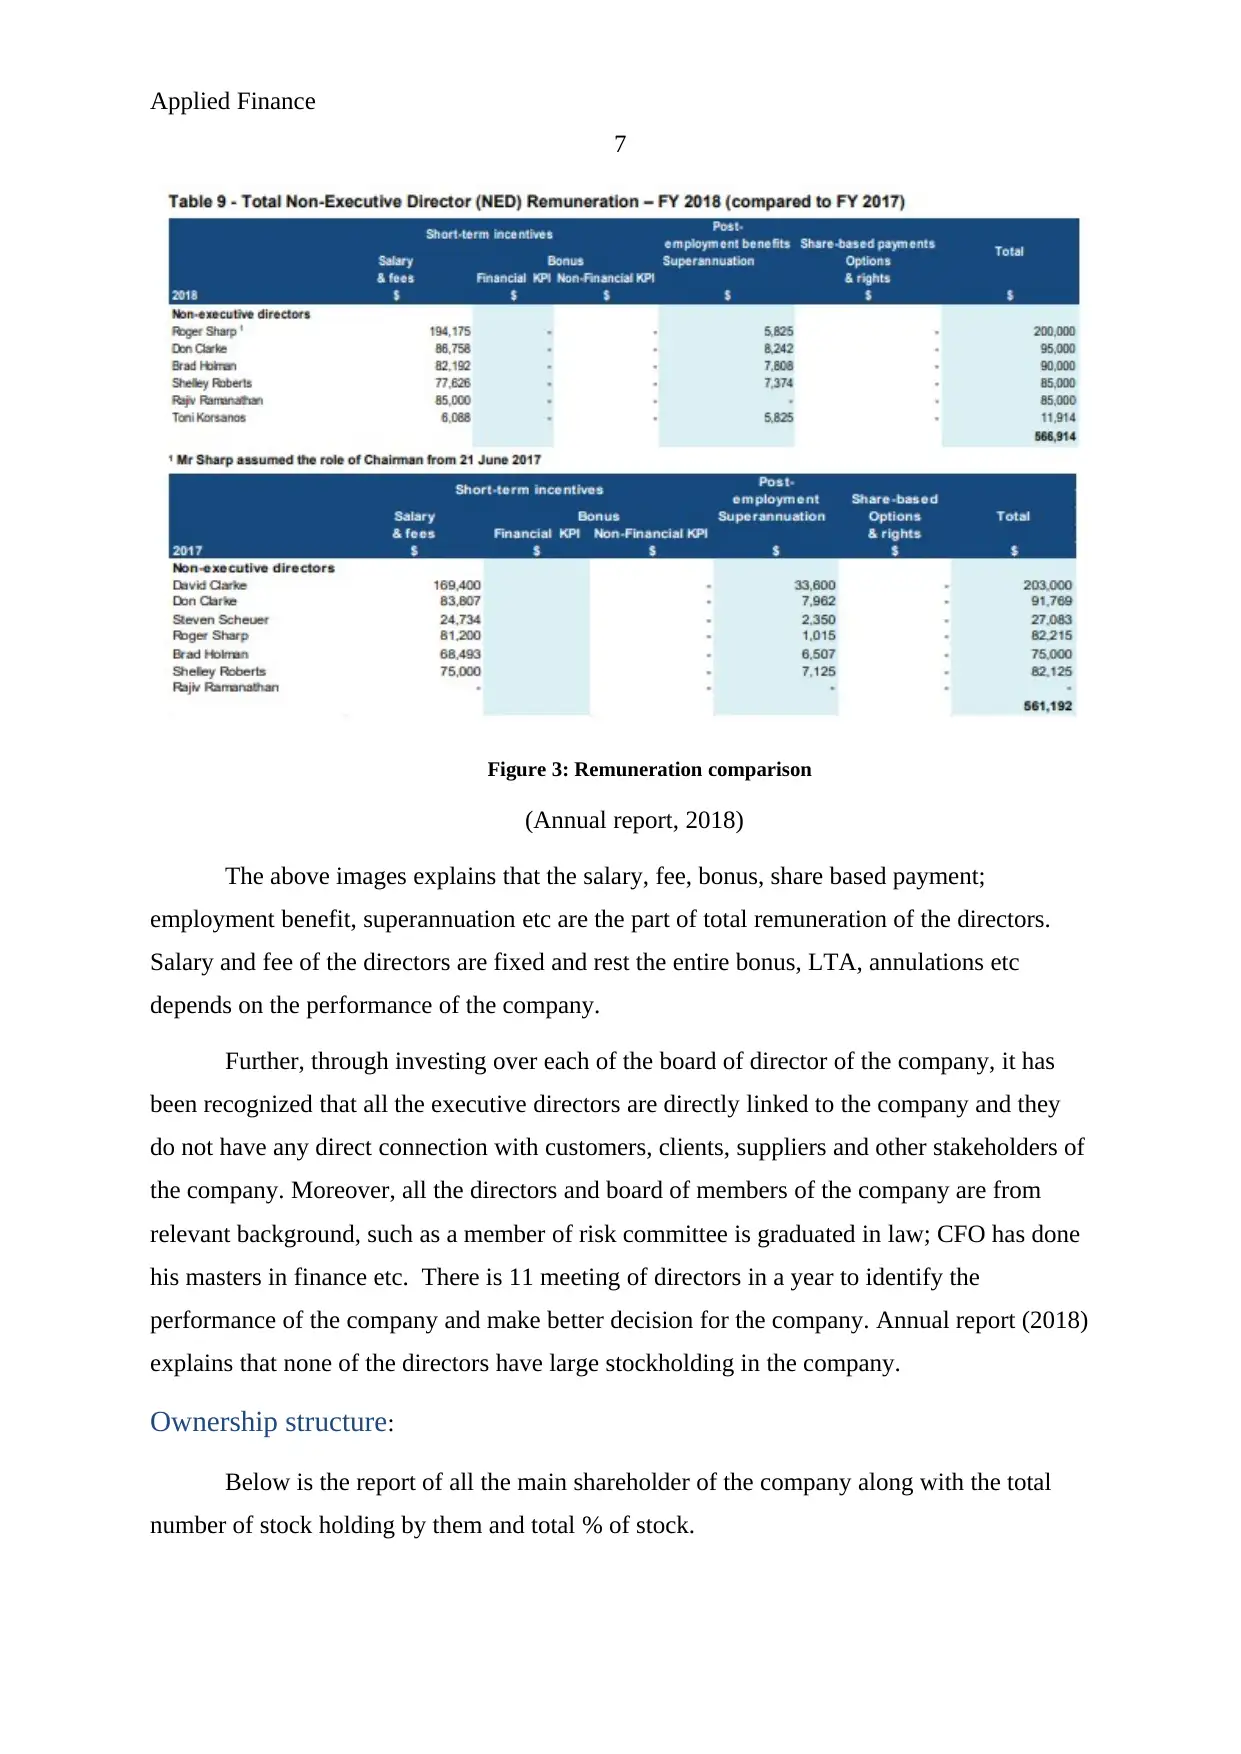
Figure 3: Remuneration comparison
(Annual report, 2018)
The above images explains that the salary, fee, bonus, share based payment;
employment benefit, superannuation etc are the part of total remuneration of the directors.
Salary and fee of the directors are fixed and rest the entire bonus, LTA, annulations etc
depends on the performance of the company.
Further, through investing over each of the board of director of the company, it has
been recognized that all the executive directors are directly linked to the company and they
do not have any direct connection with customers, clients, suppliers and other stakeholders of
the company. Moreover, all the directors and board of members of the company are from
relevant background, such as a member of risk committee is graduated in law; CFO has done
his masters in finance etc. There is 11 meeting of directors in a year to identify the
performance of the company and make better decision for the company. Annual report (2018)
explains that none of the directors have large stockholding in the company.
Ownership structure:
Below is the report of all the main shareholder of the company along with the total
number of stock holding by them and total % of stock.
7
Figure 3: Remuneration comparison
(Annual report, 2018)
The above images explains that the salary, fee, bonus, share based payment;
employment benefit, superannuation etc are the part of total remuneration of the directors.
Salary and fee of the directors are fixed and rest the entire bonus, LTA, annulations etc
depends on the performance of the company.
Further, through investing over each of the board of director of the company, it has
been recognized that all the executive directors are directly linked to the company and they
do not have any direct connection with customers, clients, suppliers and other stakeholders of
the company. Moreover, all the directors and board of members of the company are from
relevant background, such as a member of risk committee is graduated in law; CFO has done
his masters in finance etc. There is 11 meeting of directors in a year to identify the
performance of the company and make better decision for the company. Annual report (2018)
explains that none of the directors have large stockholding in the company.
Ownership structure:
Below is the report of all the main shareholder of the company along with the total
number of stock holding by them and total % of stock.
Paraphrase This Document
Need a fresh take? Get an instant paraphrase of this document with our AI Paraphraser
Applied Finance
8
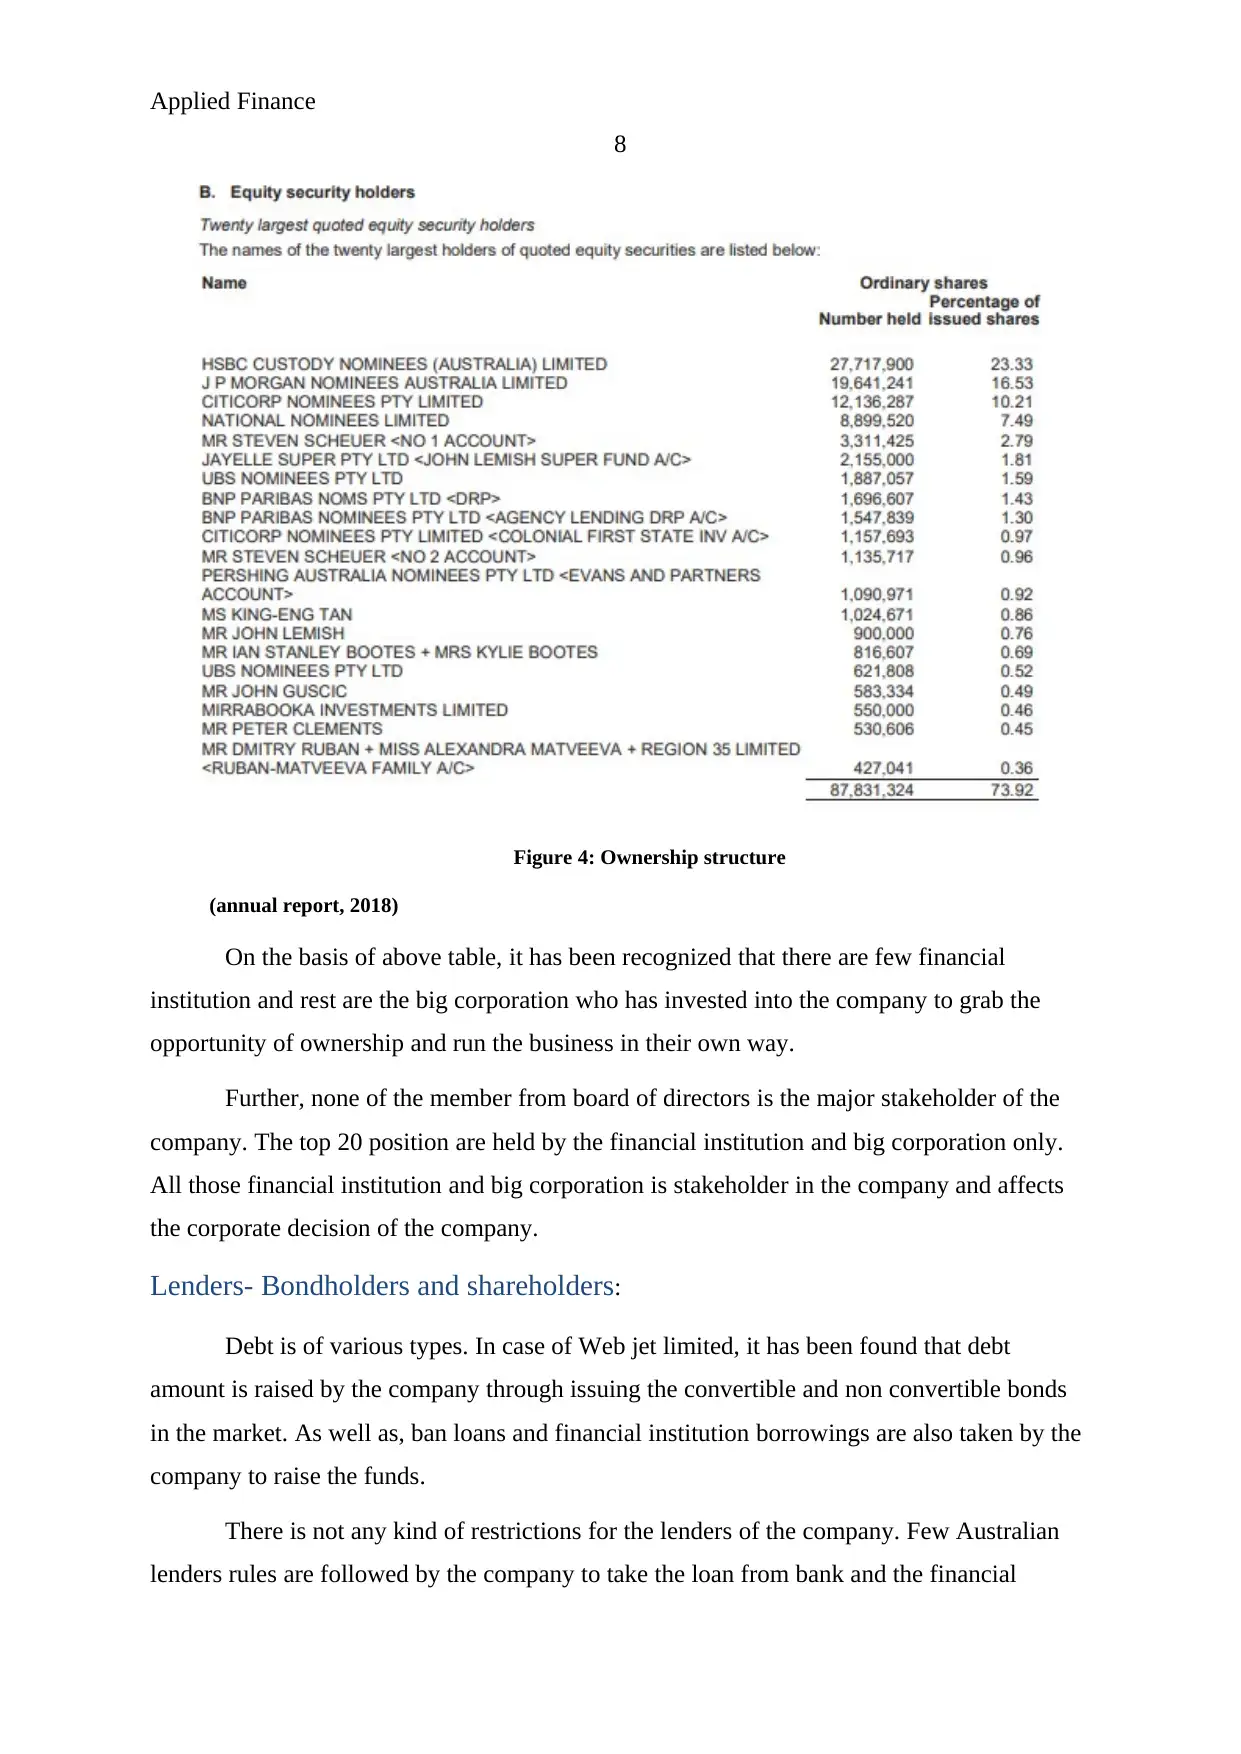
Figure 4: Ownership structure
(annual report, 2018)
On the basis of above table, it has been recognized that there are few financial
institution and rest are the big corporation who has invested into the company to grab the
opportunity of ownership and run the business in their own way.
Further, none of the member from board of directors is the major stakeholder of the
company. The top 20 position are held by the financial institution and big corporation only.
All those financial institution and big corporation is stakeholder in the company and affects
the corporate decision of the company.
Lenders- Bondholders and shareholders:
Debt is of various types. In case of Web jet limited, it has been found that debt
amount is raised by the company through issuing the convertible and non convertible bonds
in the market. As well as, ban loans and financial institution borrowings are also taken by the
company to raise the funds.
There is not any kind of restrictions for the lenders of the company. Few Australian
lenders rules are followed by the company to take the loan from bank and the financial
8
Figure 4: Ownership structure
(annual report, 2018)
On the basis of above table, it has been recognized that there are few financial
institution and rest are the big corporation who has invested into the company to grab the
opportunity of ownership and run the business in their own way.
Further, none of the member from board of directors is the major stakeholder of the
company. The top 20 position are held by the financial institution and big corporation only.
All those financial institution and big corporation is stakeholder in the company and affects
the corporate decision of the company.
Lenders- Bondholders and shareholders:
Debt is of various types. In case of Web jet limited, it has been found that debt
amount is raised by the company through issuing the convertible and non convertible bonds
in the market. As well as, ban loans and financial institution borrowings are also taken by the
company to raise the funds.
There is not any kind of restrictions for the lenders of the company. Few Australian
lenders rules are followed by the company to take the loan from bank and the financial
Applied Finance
9
institutes. Moody has rated the company B grade in order to manage the cost o debt and
earnings of the company (Mandell & Hanson, 2009). This rating is quite better as the debt of
the company is less riskier as well as proper payment of funds would be done by the
company to financial institutions.
Financial market consideration:
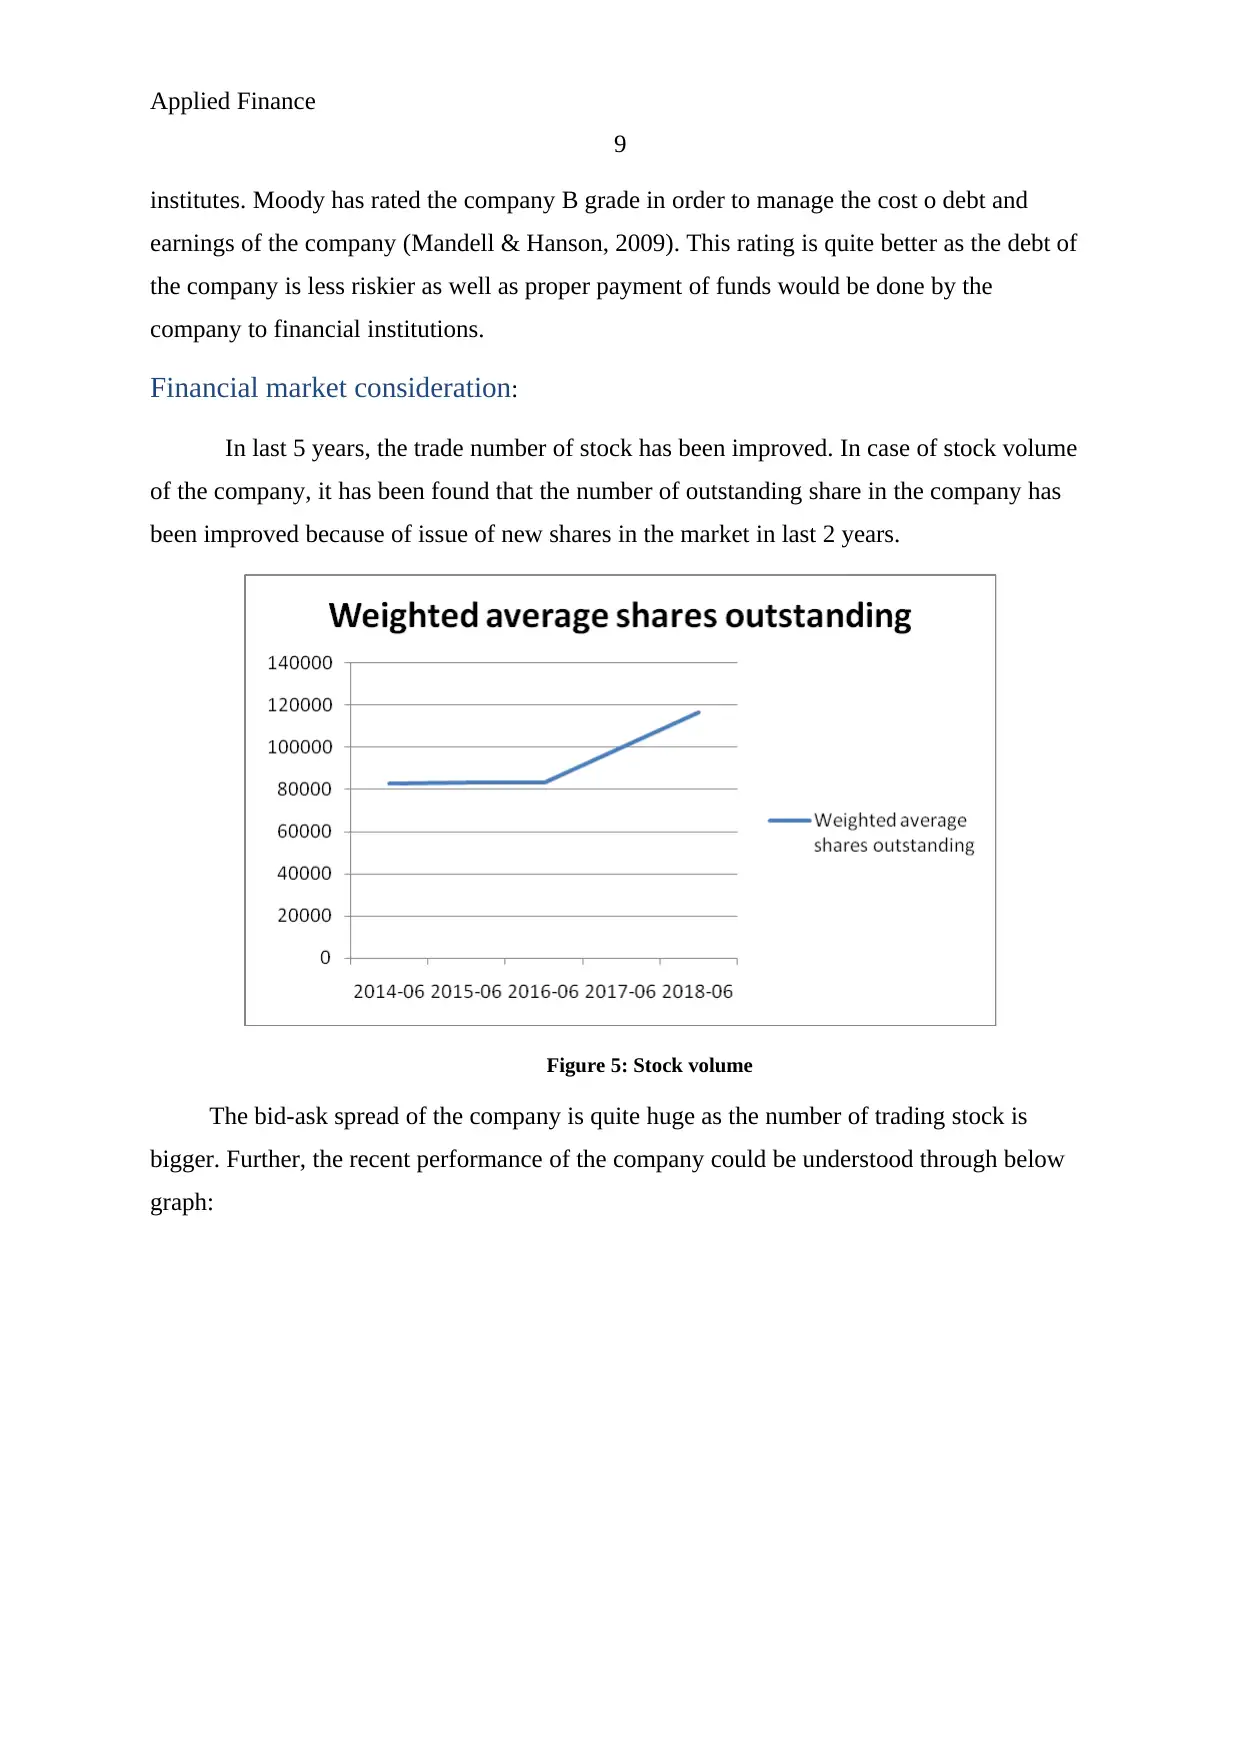
In last 5 years, the trade number of stock has been improved. In case of stock volume
of the company, it has been found that the number of outstanding share in the company has
been improved because of issue of new shares in the market in last 2 years.
Figure 5: Stock volume
The bid-ask spread of the company is quite huge as the number of trading stock is
bigger. Further, the recent performance of the company could be understood through below
graph:
9
institutes. Moody has rated the company B grade in order to manage the cost o debt and
earnings of the company (Mandell & Hanson, 2009). This rating is quite better as the debt of
the company is less riskier as well as proper payment of funds would be done by the
company to financial institutions.
Financial market consideration:
In last 5 years, the trade number of stock has been improved. In case of stock volume
of the company, it has been found that the number of outstanding share in the company has
been improved because of issue of new shares in the market in last 2 years.
Figure 5: Stock volume
The bid-ask spread of the company is quite huge as the number of trading stock is
bigger. Further, the recent performance of the company could be understood through below
graph:
⊘ This is a preview!⊘
Do you want full access?
Subscribe today to unlock all pages.
Trusted by 1+ million students worldwide
Applied Finance
10
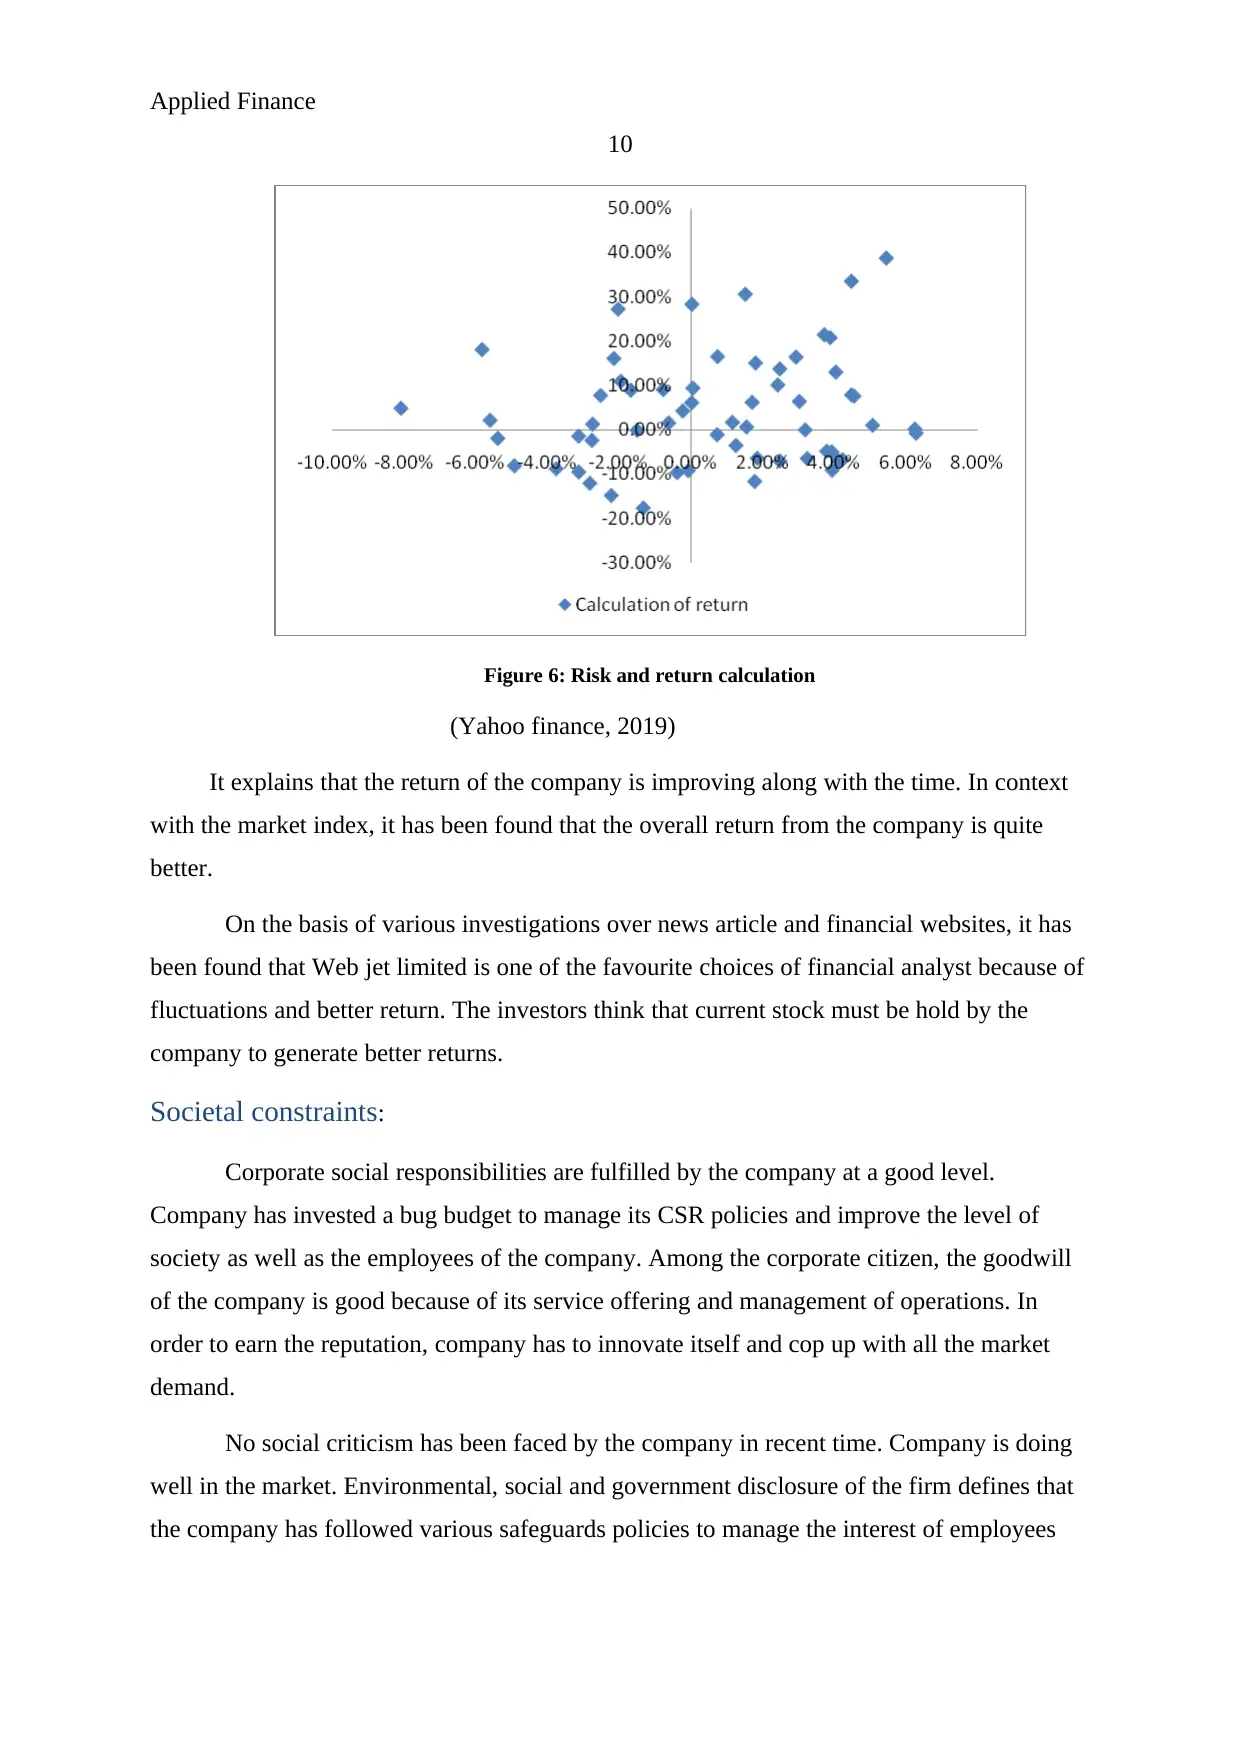
Figure 6: Risk and return calculation
(Yahoo finance, 2019)
It explains that the return of the company is improving along with the time. In context
with the market index, it has been found that the overall return from the company is quite
better.
On the basis of various investigations over news article and financial websites, it has
been found that Web jet limited is one of the favourite choices of financial analyst because of
fluctuations and better return. The investors think that current stock must be hold by the
company to generate better returns.
Societal constraints:
Corporate social responsibilities are fulfilled by the company at a good level.
Company has invested a bug budget to manage its CSR policies and improve the level of
society as well as the employees of the company. Among the corporate citizen, the goodwill
of the company is good because of its service offering and management of operations. In
order to earn the reputation, company has to innovate itself and cop up with all the market
demand.
No social criticism has been faced by the company in recent time. Company is doing
well in the market. Environmental, social and government disclosure of the firm defines that
the company has followed various safeguards policies to manage the interest of employees
10
Figure 6: Risk and return calculation
(Yahoo finance, 2019)
It explains that the return of the company is improving along with the time. In context
with the market index, it has been found that the overall return from the company is quite
better.
On the basis of various investigations over news article and financial websites, it has
been found that Web jet limited is one of the favourite choices of financial analyst because of
fluctuations and better return. The investors think that current stock must be hold by the
company to generate better returns.
Societal constraints:
Corporate social responsibilities are fulfilled by the company at a good level.
Company has invested a bug budget to manage its CSR policies and improve the level of
society as well as the employees of the company. Among the corporate citizen, the goodwill
of the company is good because of its service offering and management of operations. In
order to earn the reputation, company has to innovate itself and cop up with all the market
demand.
No social criticism has been faced by the company in recent time. Company is doing
well in the market. Environmental, social and government disclosure of the firm defines that
the company has followed various safeguards policies to manage the interest of employees
Paraphrase This Document
Need a fresh take? Get an instant paraphrase of this document with our AI Paraphraser
Applied Finance
11
(Annual report, 2018). Further, the company makes balanced and timely disclosure for the
society to get benefits; it explains that the CSR policies of the company are quite improved.
Risk and return:
Estimating historical risk parameters:
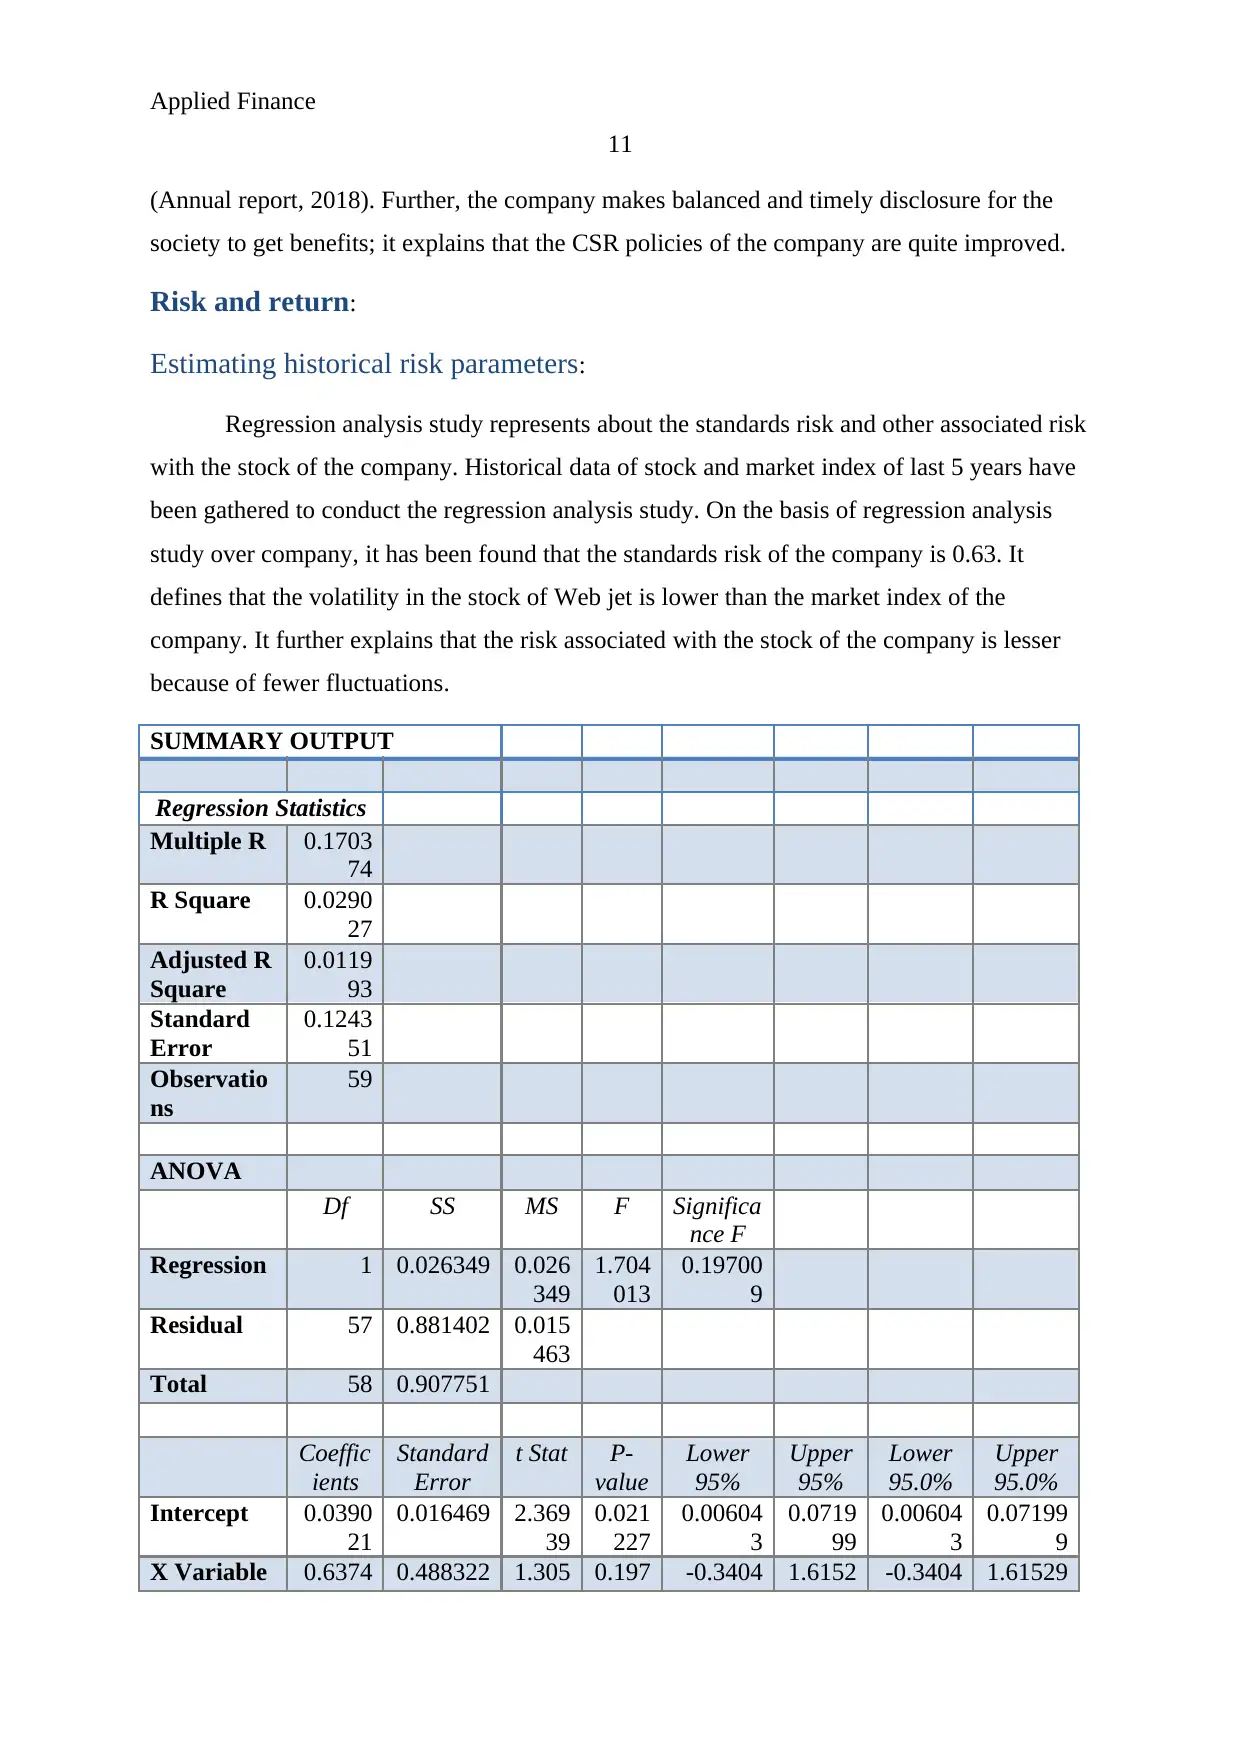
Regression analysis study represents about the standards risk and other associated risk
with the stock of the company. Historical data of stock and market index of last 5 years have
been gathered to conduct the regression analysis study. On the basis of regression analysis
study over company, it has been found that the standards risk of the company is 0.63. It
defines that the volatility in the stock of Web jet is lower than the market index of the
company. It further explains that the risk associated with the stock of the company is lesser
because of fewer fluctuations.
SUMMARY OUTPUT
Regression Statistics
Multiple R 0.1703
74
R Square 0.0290
27
Adjusted R
Square
0.0119
93
Standard
Error
0.1243
51
Observatio
ns
59
ANOVA
Df SS MS F Significa
nce F
Regression 1 0.026349 0.026
349
1.704
013
0.19700
9
Residual 57 0.881402 0.015
463
Total 58 0.907751
Coeffic
ients
Standard
Error
t Stat P-
value
Lower
95%
Upper
95%
Lower
95.0%
Upper
95.0%
Intercept 0.0390
21
0.016469 2.369
39
0.021
227
0.00604
3
0.0719
99
0.00604
3
0.07199
9
X Variable 0.6374 0.488322 1.305 0.197 -0.3404 1.6152 -0.3404 1.61529
11
(Annual report, 2018). Further, the company makes balanced and timely disclosure for the
society to get benefits; it explains that the CSR policies of the company are quite improved.
Risk and return:
Estimating historical risk parameters:
Regression analysis study represents about the standards risk and other associated risk
with the stock of the company. Historical data of stock and market index of last 5 years have
been gathered to conduct the regression analysis study. On the basis of regression analysis
study over company, it has been found that the standards risk of the company is 0.63. It
defines that the volatility in the stock of Web jet is lower than the market index of the
company. It further explains that the risk associated with the stock of the company is lesser
because of fewer fluctuations.
SUMMARY OUTPUT
Regression Statistics
Multiple R 0.1703
74
R Square 0.0290
27
Adjusted R
Square
0.0119
93
Standard
Error
0.1243
51
Observatio
ns
59
ANOVA
Df SS MS F Significa
nce F
Regression 1 0.026349 0.026
349
1.704
013
0.19700
9
Residual 57 0.881402 0.015
463
Total 58 0.907751
Coeffic
ients
Standard
Error
t Stat P-
value
Lower
95%
Upper
95%
Lower
95.0%
Upper
95.0%
Intercept 0.0390
21
0.016469 2.369
39
0.021
227
0.00604
3
0.0719
99
0.00604
3
0.07199
9
X Variable 0.6374 0.488322 1.305 0.197 -0.3404 1.6152 -0.3404 1.61529
Applied Finance
12
1 45 379 009 94 4
(Appendix)
Further, the slope of regression explains about lesser volatility than the market index.
It further explains that if the investment would be done in the stock of Web jet then the
performance of investment amount would be better. In case of regression, it has been found
that the risk level of the company is average.
Beta of a stock is measurement of its fluctuations. On the basis of study it has been
recognized that the beta of the company is lesser than 1. Hence, the risk associated with the
company is average and explains that the investment into the company will be average riskier
(Koropp, Kellermanns, Grichnik & Stanley, 2014).
The regression analysis study explains that 0.68 risk of the company is related to the
industry and 0.03 depends on the business factors of the company. It is important for the
investors to know about these risks before investment as it helps to prepare a better portfolio.
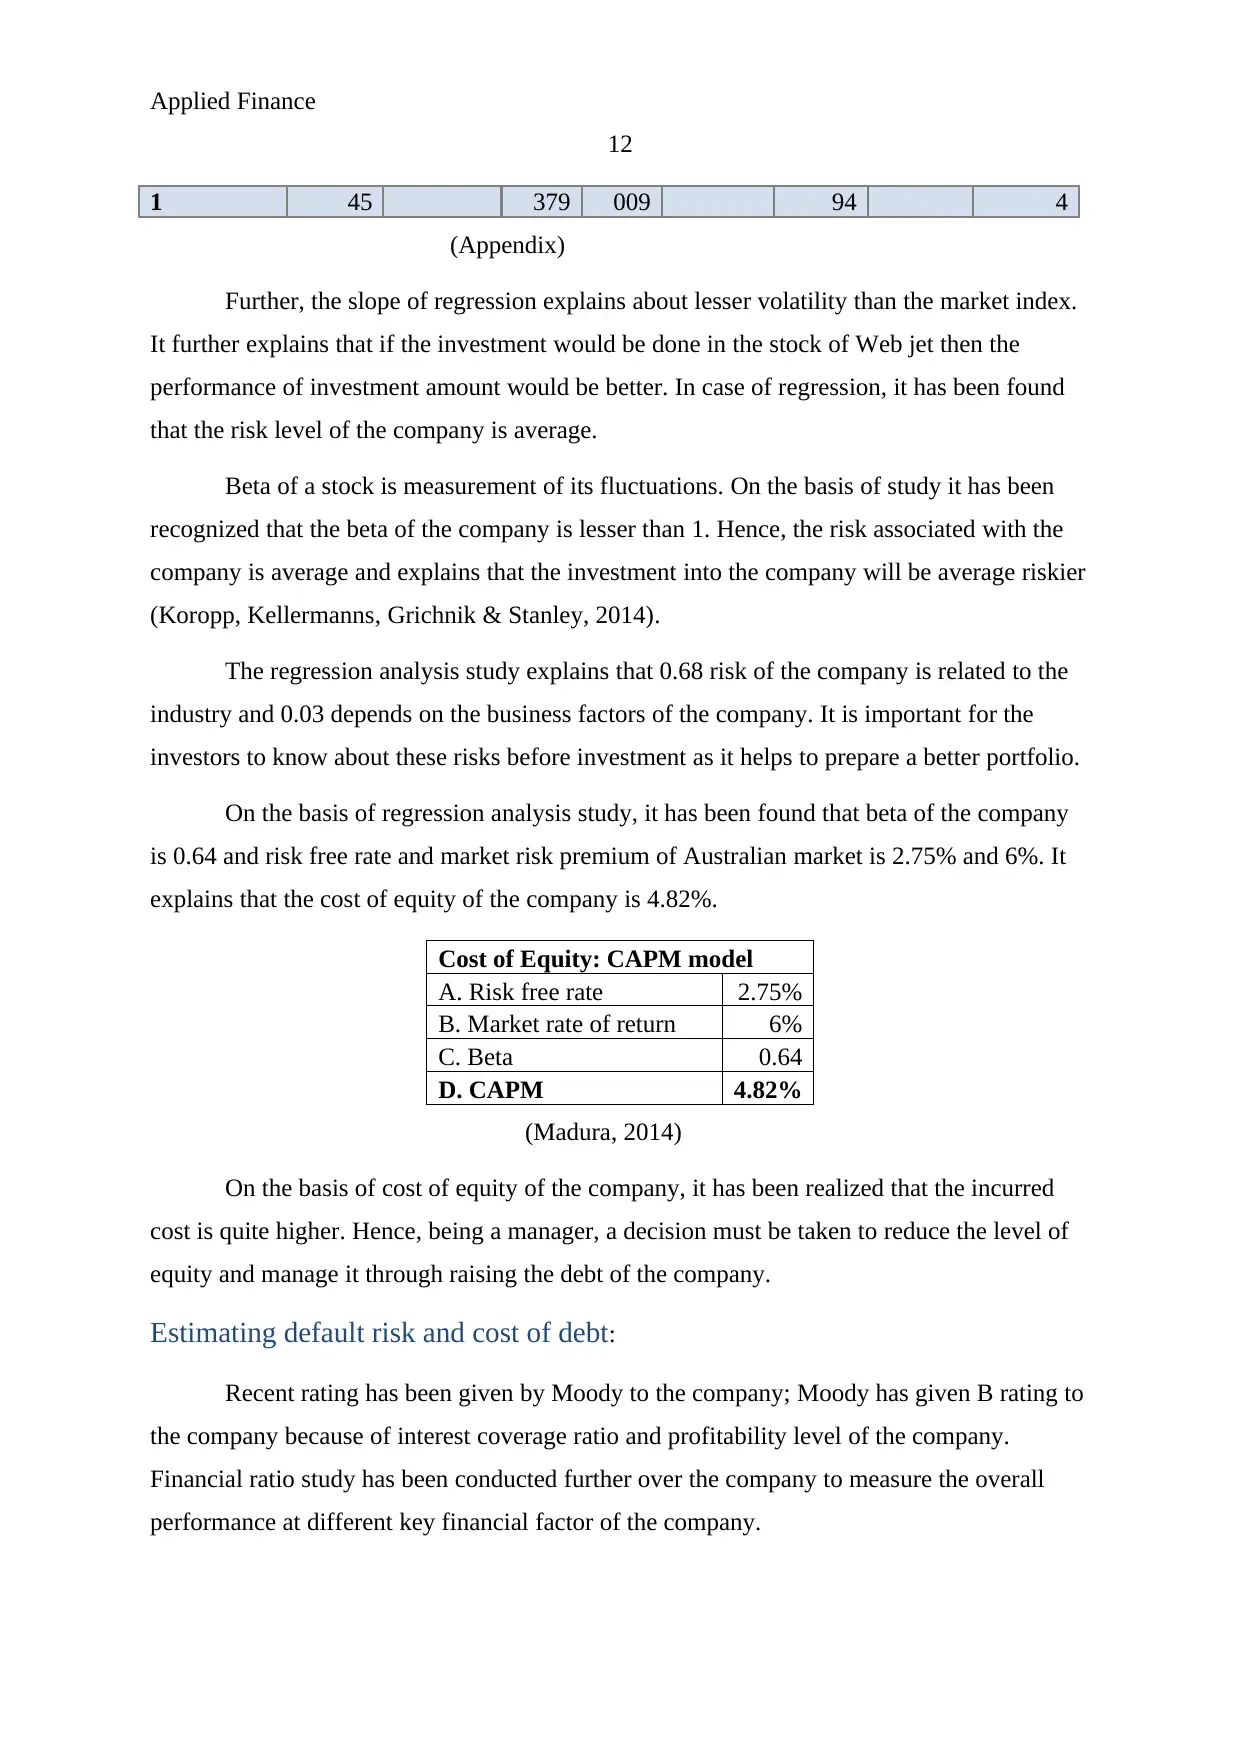
On the basis of regression analysis study, it has been found that beta of the company
is 0.64 and risk free rate and market risk premium of Australian market is 2.75% and 6%. It
explains that the cost of equity of the company is 4.82%.
Cost of Equity: CAPM model
A. Risk free rate 2.75%
B. Market rate of return 6%
C. Beta 0.64
D. CAPM 4.82%
(Madura, 2014)
On the basis of cost of equity of the company, it has been realized that the incurred
cost is quite higher. Hence, being a manager, a decision must be taken to reduce the level of
equity and manage it through raising the debt of the company.
Estimating default risk and cost of debt:
Recent rating has been given by Moody to the company; Moody has given B rating to
the company because of interest coverage ratio and profitability level of the company.
Financial ratio study has been conducted further over the company to measure the overall
performance at different key financial factor of the company.
12
1 45 379 009 94 4
(Appendix)
Further, the slope of regression explains about lesser volatility than the market index.
It further explains that if the investment would be done in the stock of Web jet then the
performance of investment amount would be better. In case of regression, it has been found
that the risk level of the company is average.
Beta of a stock is measurement of its fluctuations. On the basis of study it has been
recognized that the beta of the company is lesser than 1. Hence, the risk associated with the
company is average and explains that the investment into the company will be average riskier
(Koropp, Kellermanns, Grichnik & Stanley, 2014).
The regression analysis study explains that 0.68 risk of the company is related to the
industry and 0.03 depends on the business factors of the company. It is important for the
investors to know about these risks before investment as it helps to prepare a better portfolio.
On the basis of regression analysis study, it has been found that beta of the company
is 0.64 and risk free rate and market risk premium of Australian market is 2.75% and 6%. It
explains that the cost of equity of the company is 4.82%.
Cost of Equity: CAPM model
A. Risk free rate 2.75%
B. Market rate of return 6%
C. Beta 0.64
D. CAPM 4.82%
(Madura, 2014)
On the basis of cost of equity of the company, it has been realized that the incurred
cost is quite higher. Hence, being a manager, a decision must be taken to reduce the level of
equity and manage it through raising the debt of the company.
Estimating default risk and cost of debt:
Recent rating has been given by Moody to the company; Moody has given B rating to
the company because of interest coverage ratio and profitability level of the company.
Financial ratio study has been conducted further over the company to measure the overall
performance at different key financial factor of the company.
⊘ This is a preview!⊘
Do you want full access?
Subscribe today to unlock all pages.
Trusted by 1+ million students worldwide
1 out of 31
Related Documents


Your All-in-One AI-Powered Toolkit for Academic Success.
+13062052269
info@desklib.com
Available 24*7 on WhatsApp / Email
![[object Object]](/_next/static/media/star-bottom.7253800d.svg)
Unlock your academic potential
Copyright © 2020–2026 A2Z Services. All Rights Reserved. Developed and managed by ZUCOL.