Webjet Ltd: In-depth Financial Accounting Report and Ratio Analysis
VerifiedAdded on 2023/06/07
|23
|6053
|384
Report
AI Summary
This report provides a comprehensive financial analysis of Webjet Ltd, a digital travel services provider, focusing on profitability, liquidity, and solvency ratios over a five-year period. It includes a comparative analysis with Flight Centre Travel Group Ltd to benchmark Webjet's performance against a key competitor. The analysis incorporates key financial ratios, growth rates, and visual aids such as tables and graphs to illustrate the financial health and trends of both companies. The report assesses net profit margins, return on equity, return on assets, and return on invested capital to evaluate the companies' financial performance and identify areas for improvement. The findings offer insights into the financial standing of Webjet Ltd and its competitive positioning within the travel industry.
Running head: ACCOUNTING REPORT ANALYSIS
Accounting Report Analysis
Name of the Student:
Name of the University:
Author’s Note
Accounting Report Analysis
Name of the Student:
Name of the University:
Author’s Note
Paraphrase This Document
Need a fresh take? Get an instant paraphrase of this document with our AI Paraphraser
1
ACCOUNTING REPORT ANALYSIS
Executive Summary
The main purpose of this assessment is to analyze the financial performance of Webjet ltd which
is engaged in providing digital travel services to the customers. The assessment considers the
profitability, liquidity and solvency ratios of the business for the purpose of analyzing the growth
and development of the business on the basis of the above mention criteria. The report also
includes comparative analysis of the performance of the business in relation to one of the close
competitors of Webjet ltd. The company which is taken is Flight Center Travel ltd. The analysis
will be comparative in nature in order to understand the performance of the Webjet in terms of
industry and competitors. The assessment also includes graphs and tables which are
appropriately shown and analyzed in the assessment.
2
ACCOUNTING REPORT ANALYSIS
Table of Contents
Introduction......................................................................................................................................3
Profitability Analysis.......................................................................................................................4
Liquidity Ratio...............................................................................................................................10
Solvency Analysis.........................................................................................................................15
Conclusion.....................................................................................................................................19
Reference.......................................................................................................................................20
⊘ This is a preview!⊘
Do you want full access?
Subscribe today to unlock all pages.
Trusted by 1+ million students worldwide
3
ACCOUNTING REPORT ANALYSIS
Introduction
The main purpose of this assessment is to analyze the financial statements of Webjet
limited in order understand the performance of the business in the industry. The report will be
considering the financial report of the company for a period of five years in order to estimate the
growth in the business of Webjet ltd. The assessment shows computation of key financial ratios
and the same are to be analyzed in order to identify growth in areas which are related to
profitability, solvency and liquidity of the business. The report also considers a close competitor
of Webjet ltd on the basis of which comparative analysis is to be conducted in order to compare
performance of both businesses. The company which is selected for the assessment is Flight
Center Travel Group Ltd.
Webjet ltd is engaged in the business of digital business which provides travel services to
the customers. The company is known to be a leading company which provides online travel
services, both domestic and foreign travel services for the customers of the business. In addition
to this, the company also provide hotel accommodation bookings. Deals, cruise car (Annual
Reports - Webjet Limited., 2018). The company has its headquarters in Australia and also has
operations in other countries like New Zealand, North America and other countries.
On the other hand, Flight Center Travel Group Ltd is considered to be one of the largest
retail travel service outlets which has operations predominately in Australia. The specialty of the
company is the swift and smooth services which it provides to the customers. The company was
founded in 1982 and the company has its headquarters in Australia (Annual Reports - Flight
Centre Travel Group., 2018). The company has a turnover of 20 billion and also employs a
significant force in employee all around the area of operations of the business.
The report shows comparative analysis between the two companies which includes
computation of key financial ratios and the report will also be containing graphs and tables
showing the computation of ratios which can be used for the identifying how well the company
has performed over the last five years.
Paraphrase This Document
Need a fresh take? Get an instant paraphrase of this document with our AI Paraphraser
4
ACCOUNTING REPORT ANALYSIS
Profitability Analysis
The profitability of Webjet limited is carried out considering the financial information
which are available from the annual reports of the company for the past five years. The
profitability analysis determines the ability of the company to generate profits for the business.
The profitability analysis of the business is carried by computing significant ratios which are
associated with profitability of the business (Delen, Kuzey & Uyar, 2013). The analysis will be
showing profitability ratio analysis for Webjet ltd and Flight Center Travel limited separately
and then a comparative analysis for the same.
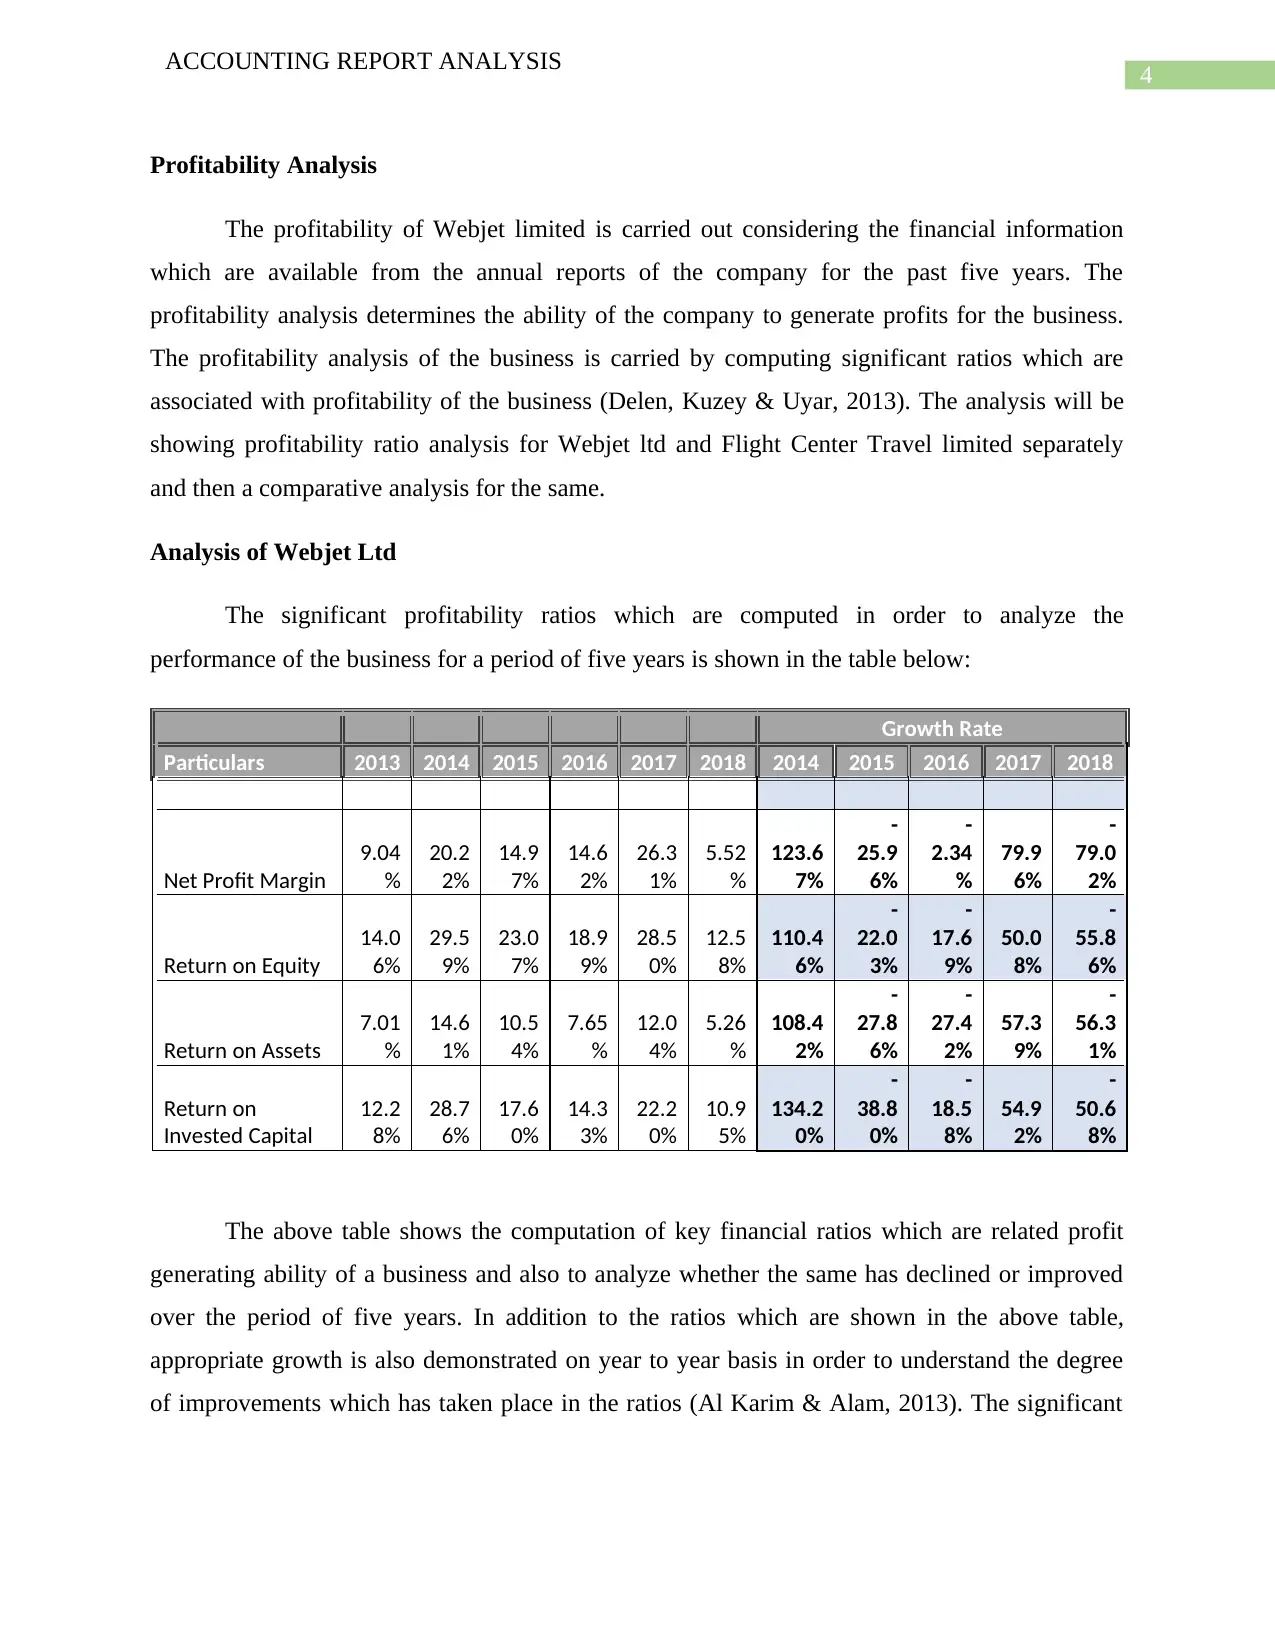
Analysis of Webjet Ltd
The significant profitability ratios which are computed in order to analyze the
performance of the business for a period of five years is shown in the table below:
Growth Rate
Particulars 2013 2014 2015 2016 2017 2018 2014 2015 2016 2017 2018
Net Profit Margin
9.04
%
20.2
2%
14.9
7%
14.6
2%
26.3
1%
5.52
%
123.6
7%
-
25.9
6%
-
2.34
%
79.9
6%
-
79.0
2%
Return on Equity
14.0
6%
29.5
9%
23.0
7%
18.9
9%
28.5
0%
12.5
8%
110.4
6%
-
22.0
3%
-
17.6
9%
50.0
8%
-
55.8
6%
Return on Assets
7.01
%
14.6
1%
10.5
4%
7.65
%
12.0
4%
5.26
%
108.4
2%
-
27.8
6%
-
27.4
2%
57.3
9%
-
56.3
1%
Return on
Invested Capital
12.2
8%
28.7
6%
17.6
0%
14.3
3%
22.2
0%
10.9
5%
134.2
0%
-
38.8
0%
-
18.5
8%
54.9
2%
-
50.6
8%
The above table shows the computation of key financial ratios which are related profit
generating ability of a business and also to analyze whether the same has declined or improved
over the period of five years. In addition to the ratios which are shown in the above table,
appropriate growth is also demonstrated on year to year basis in order to understand the degree
of improvements which has taken place in the ratios (Al Karim & Alam, 2013). The significant
ACCOUNTING REPORT ANALYSIS
Profitability Analysis
The profitability of Webjet limited is carried out considering the financial information
which are available from the annual reports of the company for the past five years. The
profitability analysis determines the ability of the company to generate profits for the business.
The profitability analysis of the business is carried by computing significant ratios which are
associated with profitability of the business (Delen, Kuzey & Uyar, 2013). The analysis will be
showing profitability ratio analysis for Webjet ltd and Flight Center Travel limited separately
and then a comparative analysis for the same.
Analysis of Webjet Ltd
The significant profitability ratios which are computed in order to analyze the
performance of the business for a period of five years is shown in the table below:
Growth Rate
Particulars 2013 2014 2015 2016 2017 2018 2014 2015 2016 2017 2018
Net Profit Margin
9.04
%
20.2
2%
14.9
7%
14.6
2%
26.3
1%
5.52
%
123.6
7%
-
25.9
6%
-
2.34
%
79.9
6%
-
79.0
2%
Return on Equity
14.0
6%
29.5
9%
23.0
7%
18.9
9%
28.5
0%
12.5
8%
110.4
6%
-
22.0
3%
-
17.6
9%
50.0
8%
-
55.8
6%
Return on Assets
7.01
%
14.6
1%
10.5
4%
7.65
%
12.0
4%
5.26
%
108.4
2%
-
27.8
6%
-
27.4
2%
57.3
9%
-
56.3
1%
Return on
Invested Capital
12.2
8%
28.7
6%
17.6
0%
14.3
3%
22.2
0%
10.9
5%
134.2
0%
-
38.8
0%
-
18.5
8%
54.9
2%
-
50.6
8%
The above table shows the computation of key financial ratios which are related profit
generating ability of a business and also to analyze whether the same has declined or improved
over the period of five years. In addition to the ratios which are shown in the above table,
appropriate growth is also demonstrated on year to year basis in order to understand the degree
of improvements which has taken place in the ratios (Al Karim & Alam, 2013). The significant
5
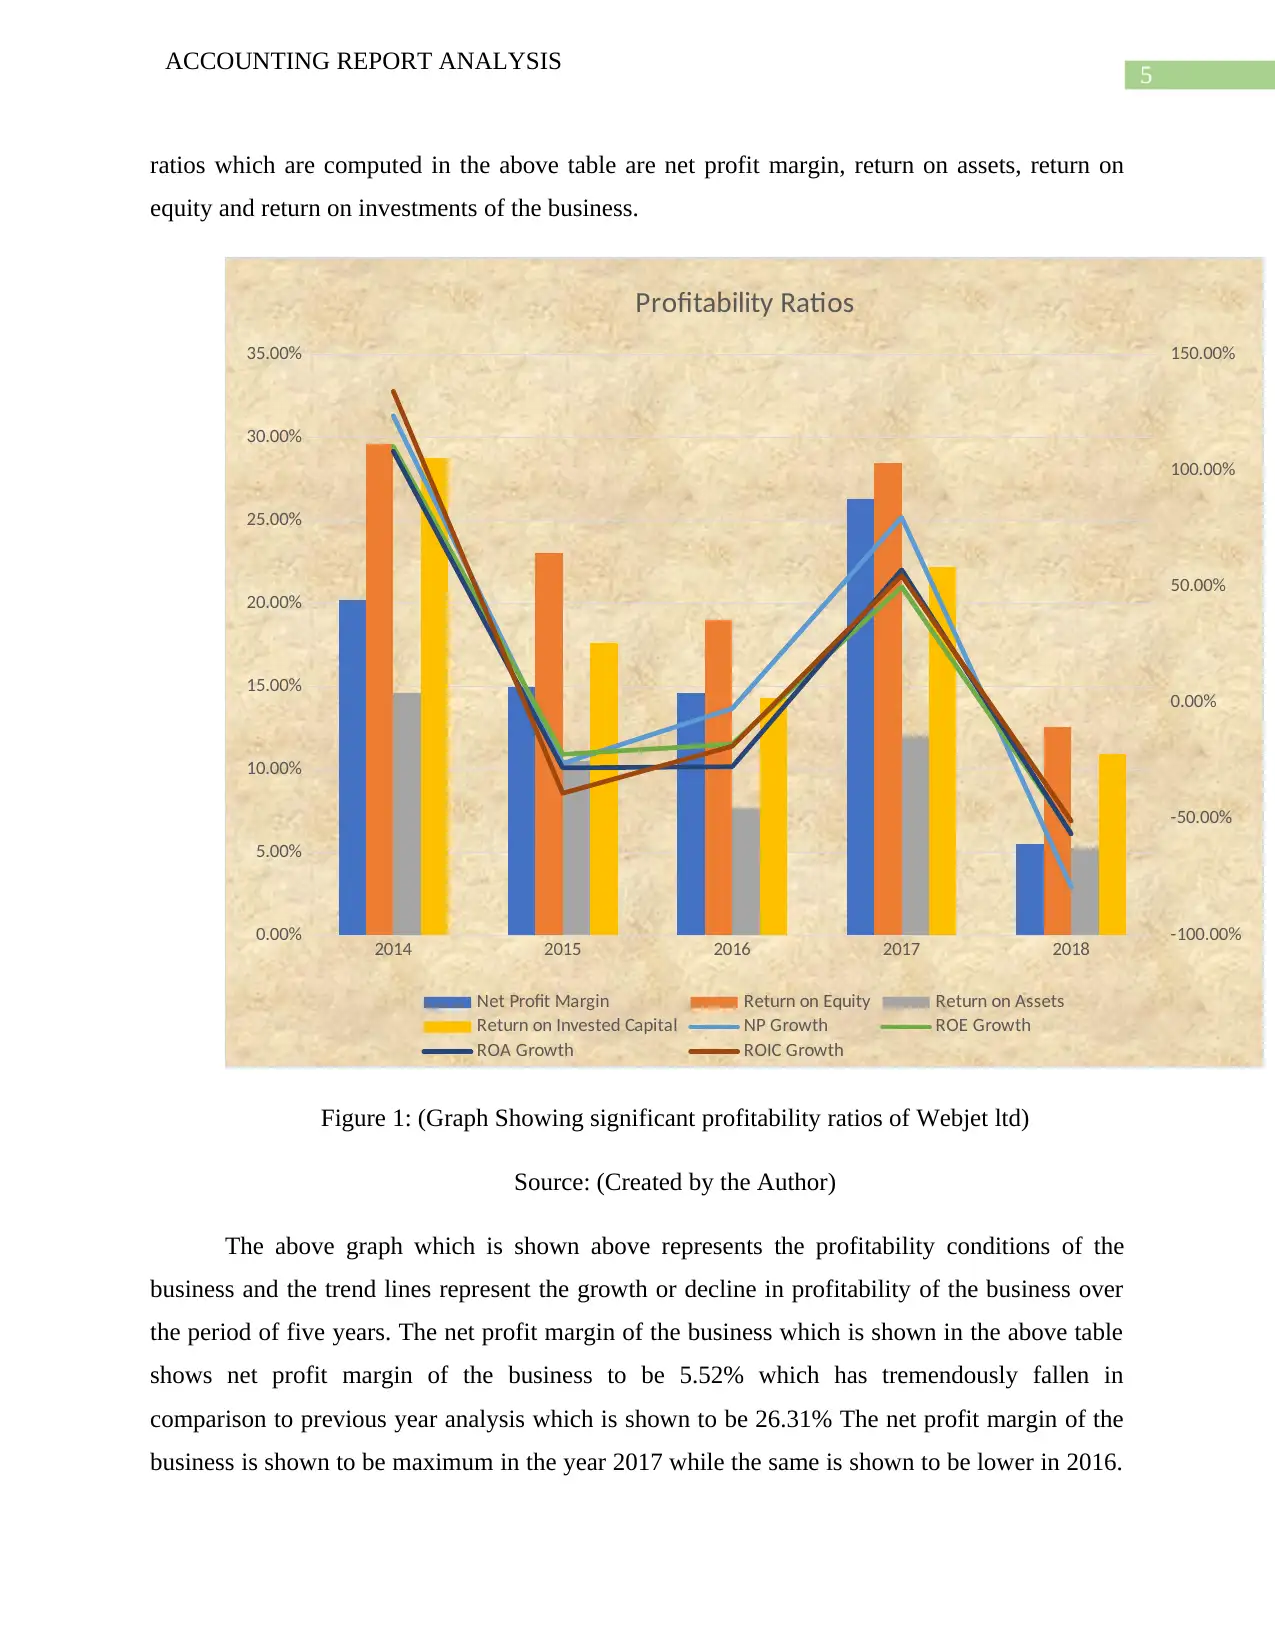
ACCOUNTING REPORT ANALYSIS
ratios which are computed in the above table are net profit margin, return on assets, return on
equity and return on investments of the business.
2014 2015 2016 2017 2018
0.00%
5.00%
10.00%
15.00%
20.00%
25.00%
30.00%
35.00%
-100.00%
-50.00%
0.00%
50.00%
100.00%
150.00%
Profitability Ratios
Net Profit Margin Return on Equity Return on Assets
Return on Invested Capital NP Growth ROE Growth
ROA Growth ROIC Growth
Figure 1: (Graph Showing significant profitability ratios of Webjet ltd)
Source: (Created by the Author)
The above graph which is shown above represents the profitability conditions of the
business and the trend lines represent the growth or decline in profitability of the business over
the period of five years. The net profit margin of the business which is shown in the above table
shows net profit margin of the business to be 5.52% which has tremendously fallen in
comparison to previous year analysis which is shown to be 26.31% The net profit margin of the
business is shown to be maximum in the year 2017 while the same is shown to be lower in 2016.
⊘ This is a preview!⊘
Do you want full access?
Subscribe today to unlock all pages.
Trusted by 1+ million students worldwide
6
ACCOUNTING REPORT ANALYSIS
The analysis of 2018 results suggest that the management of the company needs to formulate a
strategy in order to improve the net profit margin of the business. The strategy of the business
can be to either go for sales maximization policy or cost reduction policy both of which have
direct impact on the profitability of the company. The return on equity and return on assets
which are shown in the table above are considered to financial indicators for a success of a
business. The return on equity represent the amount which the business can generate from the
use of equity capital in the business and similarly the return which the business can generate with
the application of the assets of the business (Heikal et al., 2014). The return on equity of the
business as per the table above is shown to be 12.58% which is much lower than the return on
equity which the business had generated in previous year. The return on equity of the business
needs to be improved in order to live up to the expectations of the shareholders of the company.
The return on assets if the business is shown to be 5.56% which was around 12% in 2017 which
is also not a positive sign for the business. The return on investments for the business is shown in
the table above which is also one of the financial indicators which is shown to have reduced
during the year. The overall analysis shows that the profitability of the business shows that in
2018 all the profitability indexes have fallen which signifies that the business is having difficult
in increasing the overall profitability of the business.
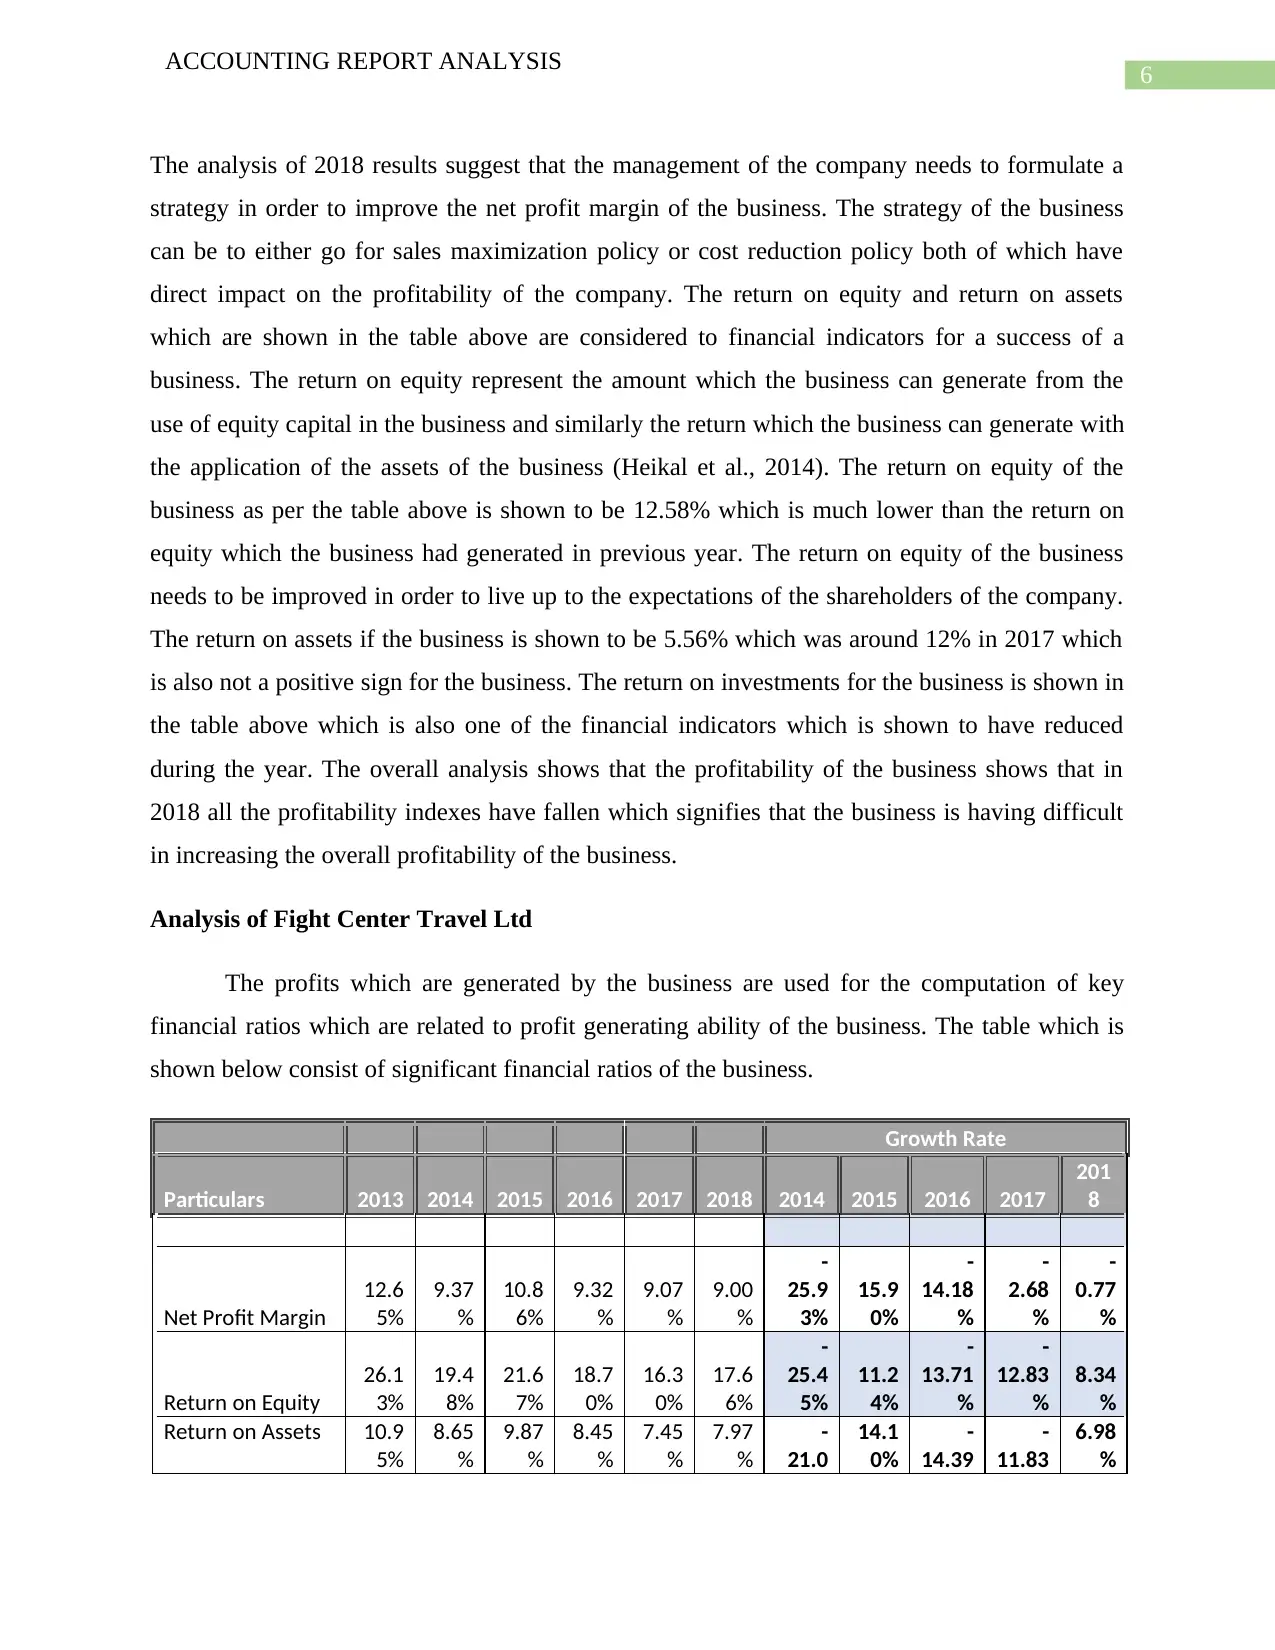
Analysis of Fight Center Travel Ltd
The profits which are generated by the business are used for the computation of key
financial ratios which are related to profit generating ability of the business. The table which is
shown below consist of significant financial ratios of the business.
Growth Rate
Particulars 2013 2014 2015 2016 2017 2018 2014 2015 2016 2017
201
8
Net Profit Margin
12.6
5%
9.37
%
10.8
6%
9.32
%
9.07
%
9.00
%
-
25.9
3%
15.9
0%
-
14.18
%
-
2.68
%
-
0.77
%
Return on Equity
26.1
3%
19.4
8%
21.6
7%
18.7
0%
16.3
0%
17.6
6%
-
25.4
5%
11.2
4%
-
13.71
%
-
12.83
%
8.34
%
Return on Assets 10.9
5%
8.65
%
9.87
%
8.45
%
7.45
%
7.97
%
-
21.0
14.1
0%
-
14.39
-
11.83
6.98
%
ACCOUNTING REPORT ANALYSIS
The analysis of 2018 results suggest that the management of the company needs to formulate a
strategy in order to improve the net profit margin of the business. The strategy of the business
can be to either go for sales maximization policy or cost reduction policy both of which have
direct impact on the profitability of the company. The return on equity and return on assets
which are shown in the table above are considered to financial indicators for a success of a
business. The return on equity represent the amount which the business can generate from the
use of equity capital in the business and similarly the return which the business can generate with
the application of the assets of the business (Heikal et al., 2014). The return on equity of the
business as per the table above is shown to be 12.58% which is much lower than the return on
equity which the business had generated in previous year. The return on equity of the business
needs to be improved in order to live up to the expectations of the shareholders of the company.
The return on assets if the business is shown to be 5.56% which was around 12% in 2017 which
is also not a positive sign for the business. The return on investments for the business is shown in
the table above which is also one of the financial indicators which is shown to have reduced
during the year. The overall analysis shows that the profitability of the business shows that in
2018 all the profitability indexes have fallen which signifies that the business is having difficult
in increasing the overall profitability of the business.
Analysis of Fight Center Travel Ltd
The profits which are generated by the business are used for the computation of key
financial ratios which are related to profit generating ability of the business. The table which is
shown below consist of significant financial ratios of the business.
Growth Rate
Particulars 2013 2014 2015 2016 2017 2018 2014 2015 2016 2017
201
8
Net Profit Margin
12.6
5%
9.37
%
10.8
6%
9.32
%
9.07
%
9.00
%
-
25.9
3%
15.9
0%
-
14.18
%
-
2.68
%
-
0.77
%
Return on Equity
26.1
3%
19.4
8%
21.6
7%
18.7
0%
16.3
0%
17.6
6%
-
25.4
5%
11.2
4%
-
13.71
%
-
12.83
%
8.34
%
Return on Assets 10.9
5%
8.65
%
9.87
%
8.45
%
7.45
%
7.97
%
-
21.0
14.1
0%
-
14.39
-
11.83
6.98
%
Paraphrase This Document
Need a fresh take? Get an instant paraphrase of this document with our AI Paraphraser
7
ACCOUNTING REPORT ANALYSIS
0% % %
Return on
Invested Capital
23.9
0%
18.7
3%
20.8
0%
18.0
9%
15.9
6%
17.1
4%
-
21.6
3%
11.0
5%
-
13.03
%
-
11.77
%
7.39
%
2014 2015 2016 2017 2018
0.00%
5.00%
10.00%
15.00%
20.00%
25.00%
-30.00%
-25.00%
-20.00%
-15.00%
-10.00%
-5.00%
0.00%
5.00%
10.00%
15.00%
20.00%
Profitability Ratios
Net Profit Margin Return on Equity Return on Assets Return on Invested Capital
NP Growth ROE Growth ROA Growth ROIC Growth
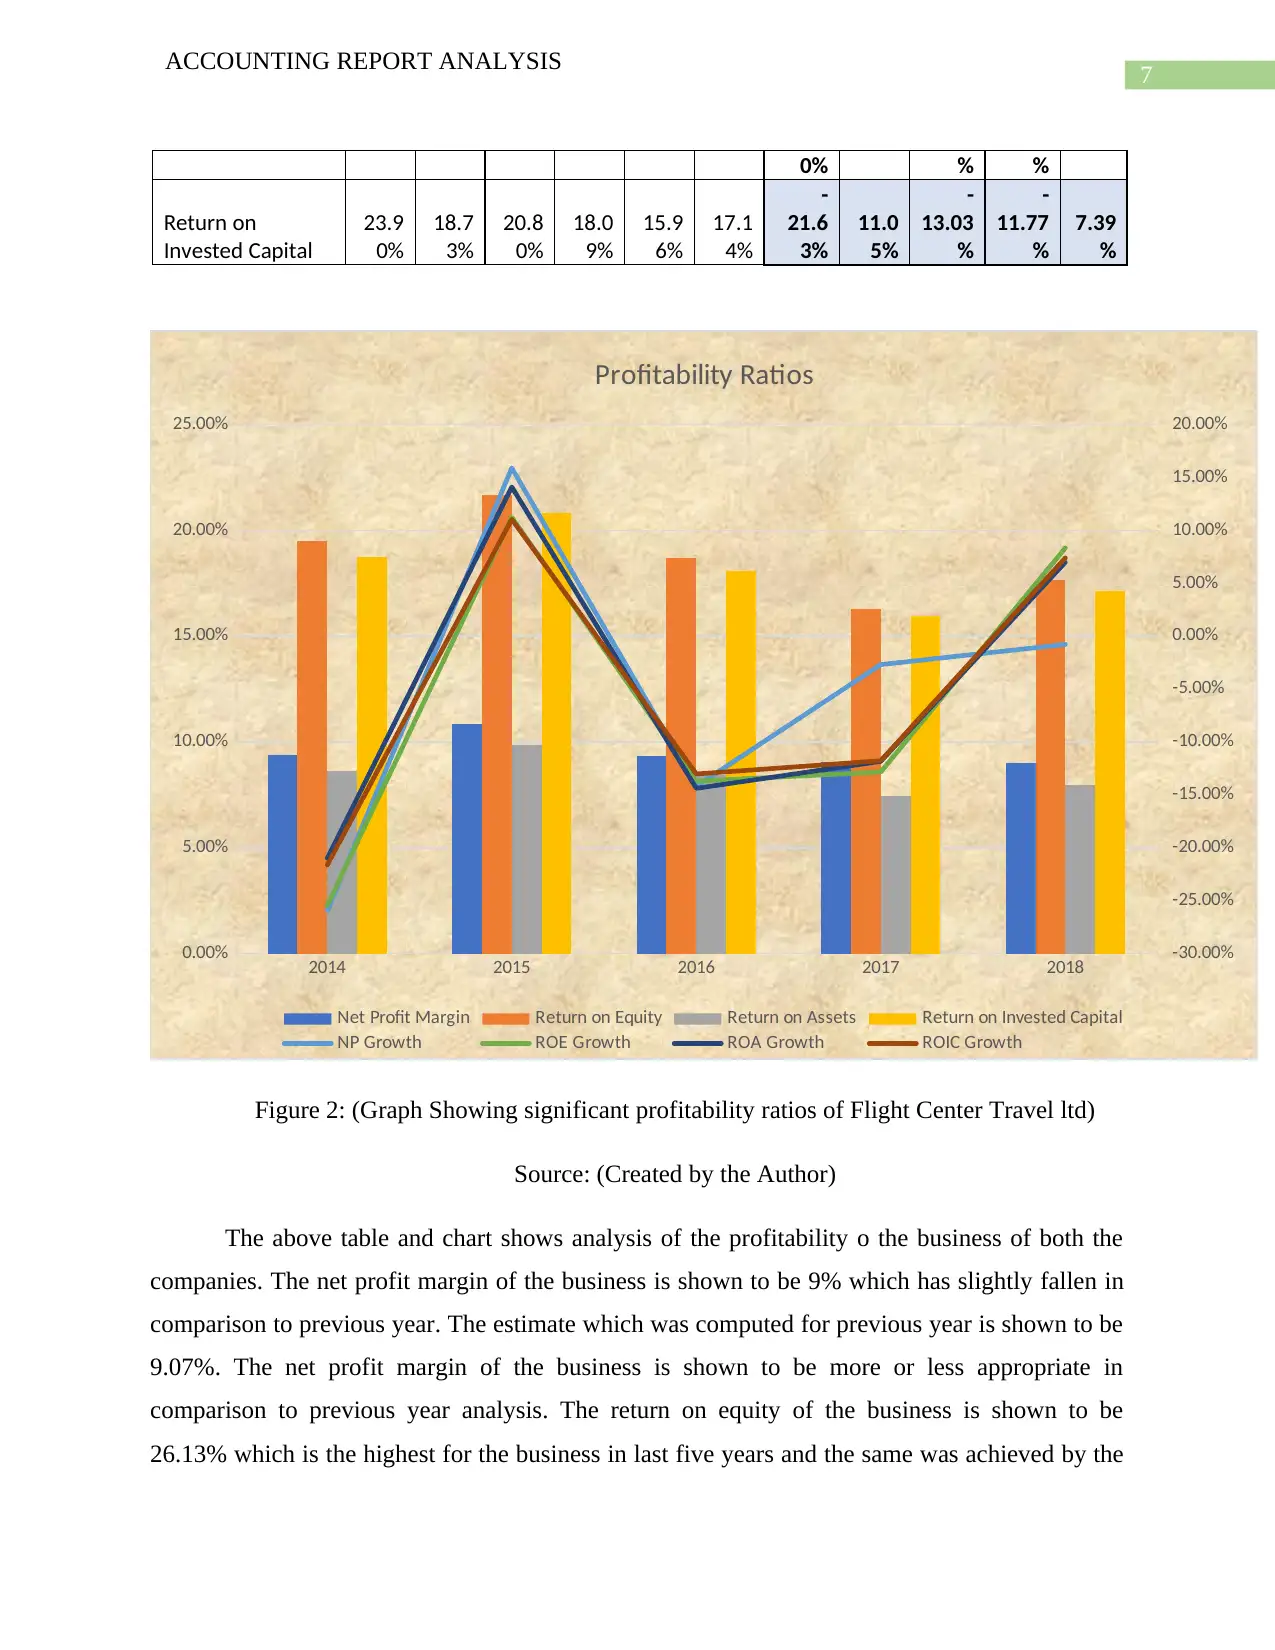
Figure 2: (Graph Showing significant profitability ratios of Flight Center Travel ltd)
Source: (Created by the Author)
The above table and chart shows analysis of the profitability o the business of both the
companies. The net profit margin of the business is shown to be 9% which has slightly fallen in
comparison to previous year. The estimate which was computed for previous year is shown to be
9.07%. The net profit margin of the business is shown to be more or less appropriate in
comparison to previous year analysis. The return on equity of the business is shown to be
26.13% which is the highest for the business in last five years and the same was achieved by the
ACCOUNTING REPORT ANALYSIS
0% % %
Return on
Invested Capital
23.9
0%
18.7
3%
20.8
0%
18.0
9%
15.9
6%
17.1
4%
-
21.6
3%
11.0
5%
-
13.03
%
-
11.77
%
7.39
%
2014 2015 2016 2017 2018
0.00%
5.00%
10.00%
15.00%
20.00%
25.00%
-30.00%
-25.00%
-20.00%
-15.00%
-10.00%
-5.00%
0.00%
5.00%
10.00%
15.00%
20.00%
Profitability Ratios
Net Profit Margin Return on Equity Return on Assets Return on Invested Capital
NP Growth ROE Growth ROA Growth ROIC Growth
Figure 2: (Graph Showing significant profitability ratios of Flight Center Travel ltd)
Source: (Created by the Author)
The above table and chart shows analysis of the profitability o the business of both the
companies. The net profit margin of the business is shown to be 9% which has slightly fallen in
comparison to previous year. The estimate which was computed for previous year is shown to be
9.07%. The net profit margin of the business is shown to be more or less appropriate in
comparison to previous year analysis. The return on equity of the business is shown to be
26.13% which is the highest for the business in last five years and the same was achieved by the
8
ACCOUNTING REPORT ANALYSIS
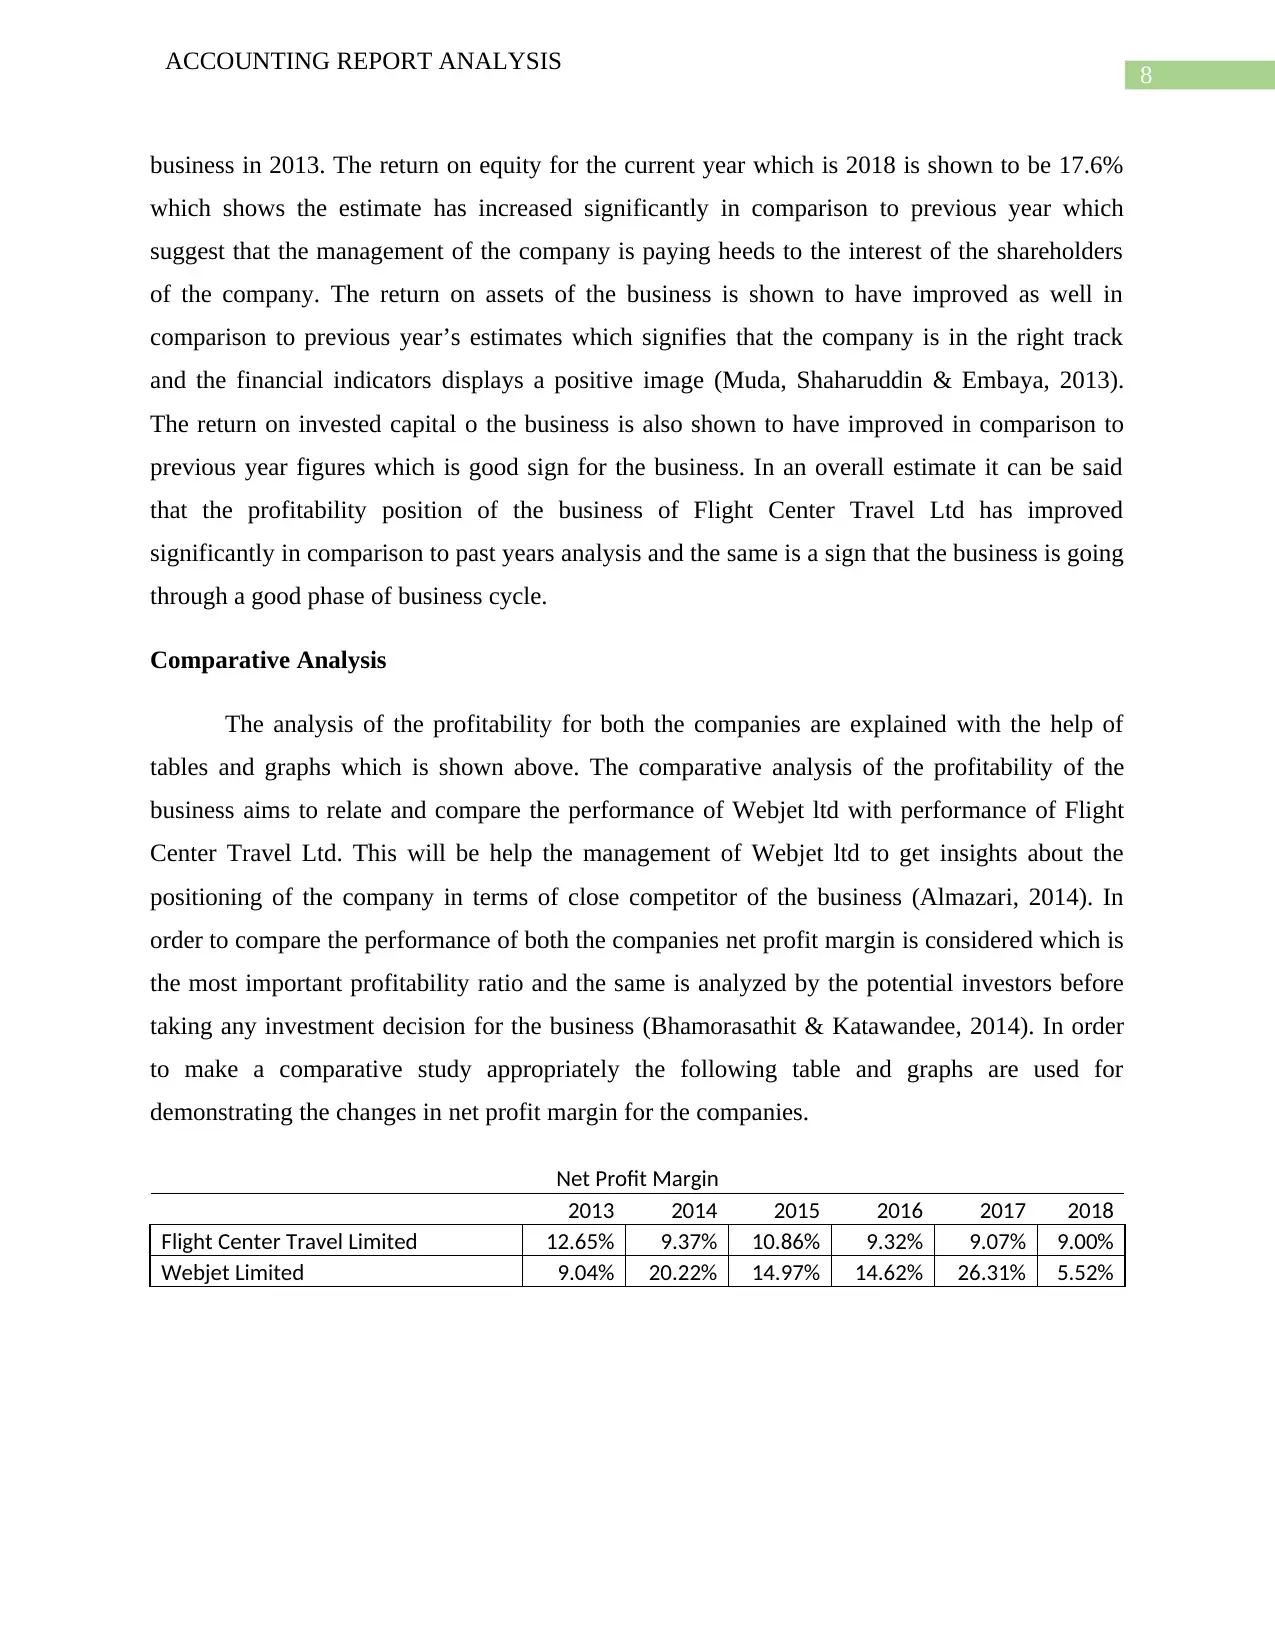
business in 2013. The return on equity for the current year which is 2018 is shown to be 17.6%
which shows the estimate has increased significantly in comparison to previous year which
suggest that the management of the company is paying heeds to the interest of the shareholders
of the company. The return on assets of the business is shown to have improved as well in
comparison to previous year’s estimates which signifies that the company is in the right track
and the financial indicators displays a positive image (Muda, Shaharuddin & Embaya, 2013).
The return on invested capital o the business is also shown to have improved in comparison to
previous year figures which is good sign for the business. In an overall estimate it can be said
that the profitability position of the business of Flight Center Travel Ltd has improved
significantly in comparison to past years analysis and the same is a sign that the business is going
through a good phase of business cycle.
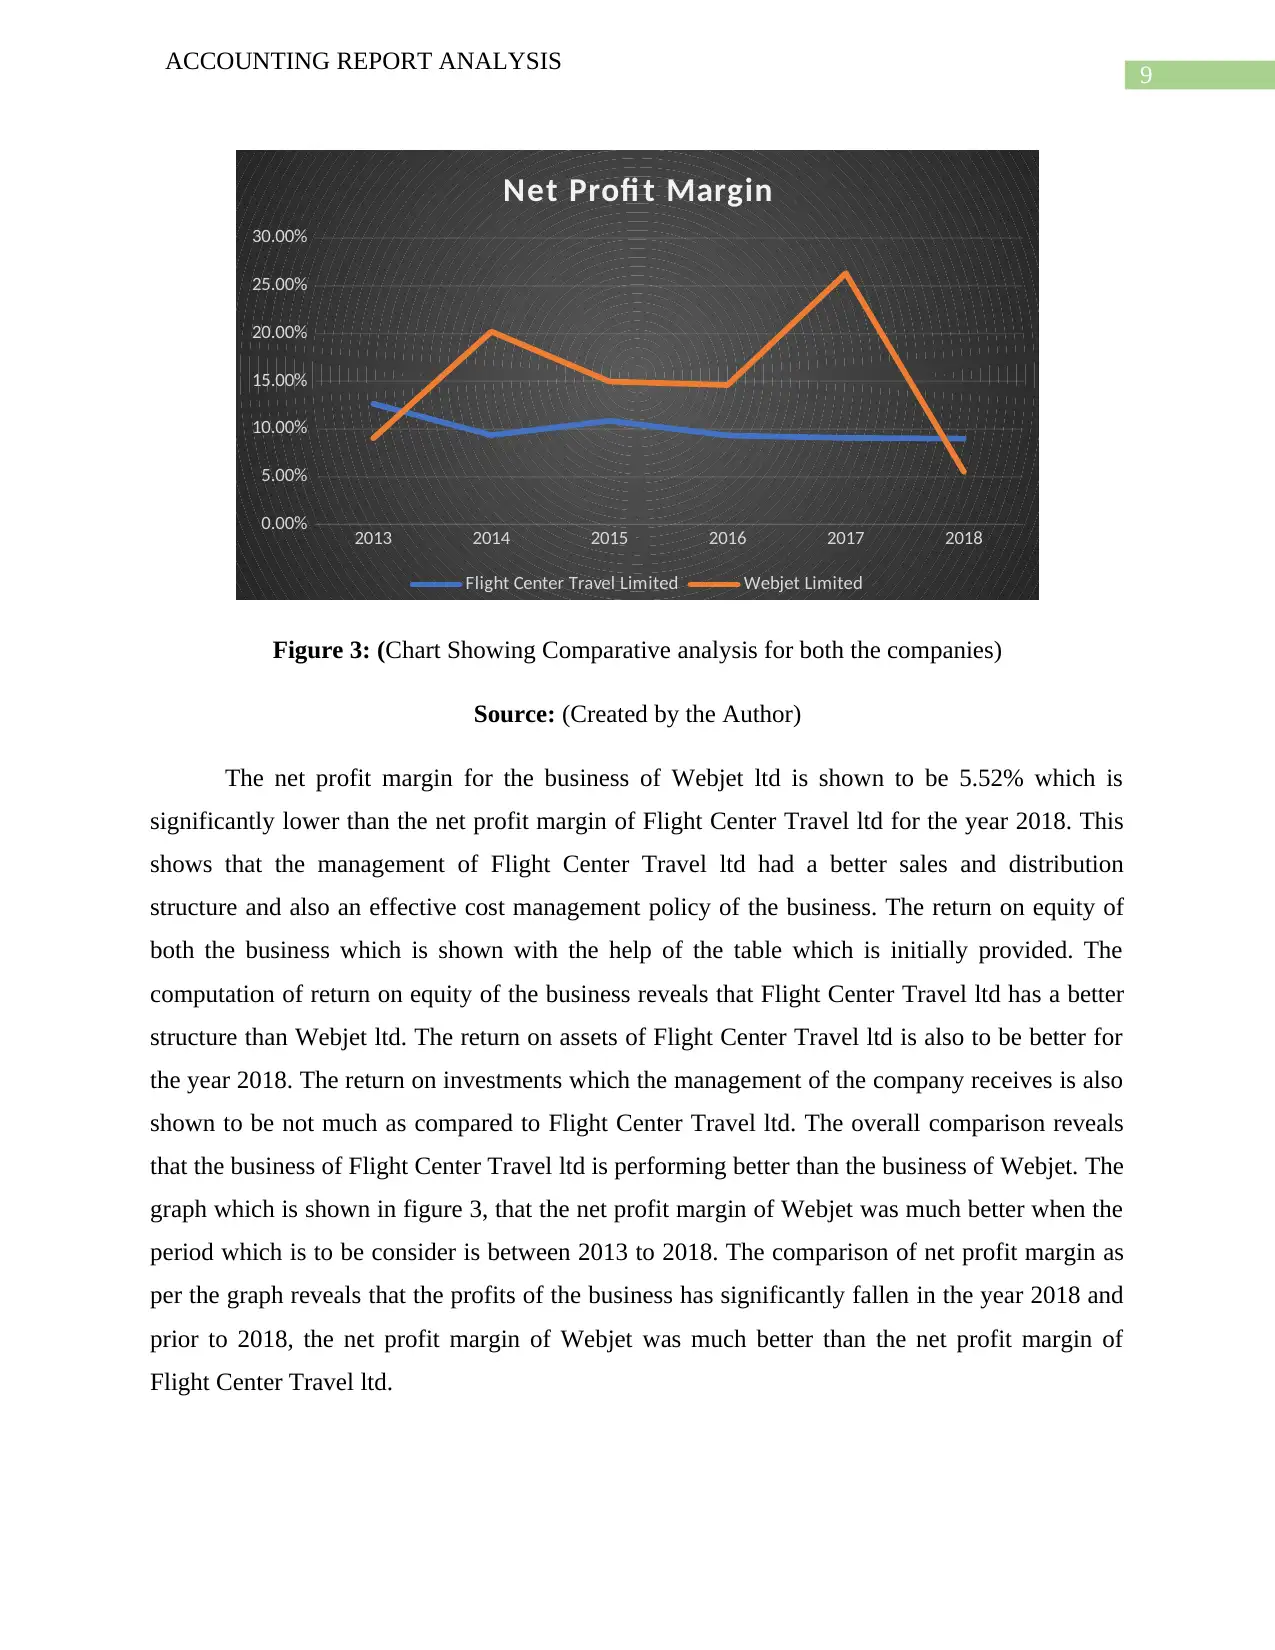
Comparative Analysis
The analysis of the profitability for both the companies are explained with the help of
tables and graphs which is shown above. The comparative analysis of the profitability of the
business aims to relate and compare the performance of Webjet ltd with performance of Flight
Center Travel Ltd. This will be help the management of Webjet ltd to get insights about the
positioning of the company in terms of close competitor of the business (Almazari, 2014). In
order to compare the performance of both the companies net profit margin is considered which is
the most important profitability ratio and the same is analyzed by the potential investors before
taking any investment decision for the business (Bhamorasathit & Katawandee, 2014). In order
to make a comparative study appropriately the following table and graphs are used for
demonstrating the changes in net profit margin for the companies.
Net Profit Margin
2013 2014 2015 2016 2017 2018
Flight Center Travel Limited 12.65% 9.37% 10.86% 9.32% 9.07% 9.00%
Webjet Limited 9.04% 20.22% 14.97% 14.62% 26.31% 5.52%
ACCOUNTING REPORT ANALYSIS
business in 2013. The return on equity for the current year which is 2018 is shown to be 17.6%
which shows the estimate has increased significantly in comparison to previous year which
suggest that the management of the company is paying heeds to the interest of the shareholders
of the company. The return on assets of the business is shown to have improved as well in
comparison to previous year’s estimates which signifies that the company is in the right track
and the financial indicators displays a positive image (Muda, Shaharuddin & Embaya, 2013).
The return on invested capital o the business is also shown to have improved in comparison to
previous year figures which is good sign for the business. In an overall estimate it can be said
that the profitability position of the business of Flight Center Travel Ltd has improved
significantly in comparison to past years analysis and the same is a sign that the business is going
through a good phase of business cycle.
Comparative Analysis
The analysis of the profitability for both the companies are explained with the help of
tables and graphs which is shown above. The comparative analysis of the profitability of the
business aims to relate and compare the performance of Webjet ltd with performance of Flight
Center Travel Ltd. This will be help the management of Webjet ltd to get insights about the
positioning of the company in terms of close competitor of the business (Almazari, 2014). In
order to compare the performance of both the companies net profit margin is considered which is
the most important profitability ratio and the same is analyzed by the potential investors before
taking any investment decision for the business (Bhamorasathit & Katawandee, 2014). In order
to make a comparative study appropriately the following table and graphs are used for
demonstrating the changes in net profit margin for the companies.
Net Profit Margin
2013 2014 2015 2016 2017 2018
Flight Center Travel Limited 12.65% 9.37% 10.86% 9.32% 9.07% 9.00%
Webjet Limited 9.04% 20.22% 14.97% 14.62% 26.31% 5.52%
⊘ This is a preview!⊘
Do you want full access?
Subscribe today to unlock all pages.
Trusted by 1+ million students worldwide
9
ACCOUNTING REPORT ANALYSIS
2013 2014 2015 2016 2017 2018
0.00%
5.00%
10.00%
15.00%
20.00%
25.00%
30.00%
Net Profi t Margin
Flight Center Travel Limited Webjet Limited
Figure 3: (Chart Showing Comparative analysis for both the companies)
Source: (Created by the Author)
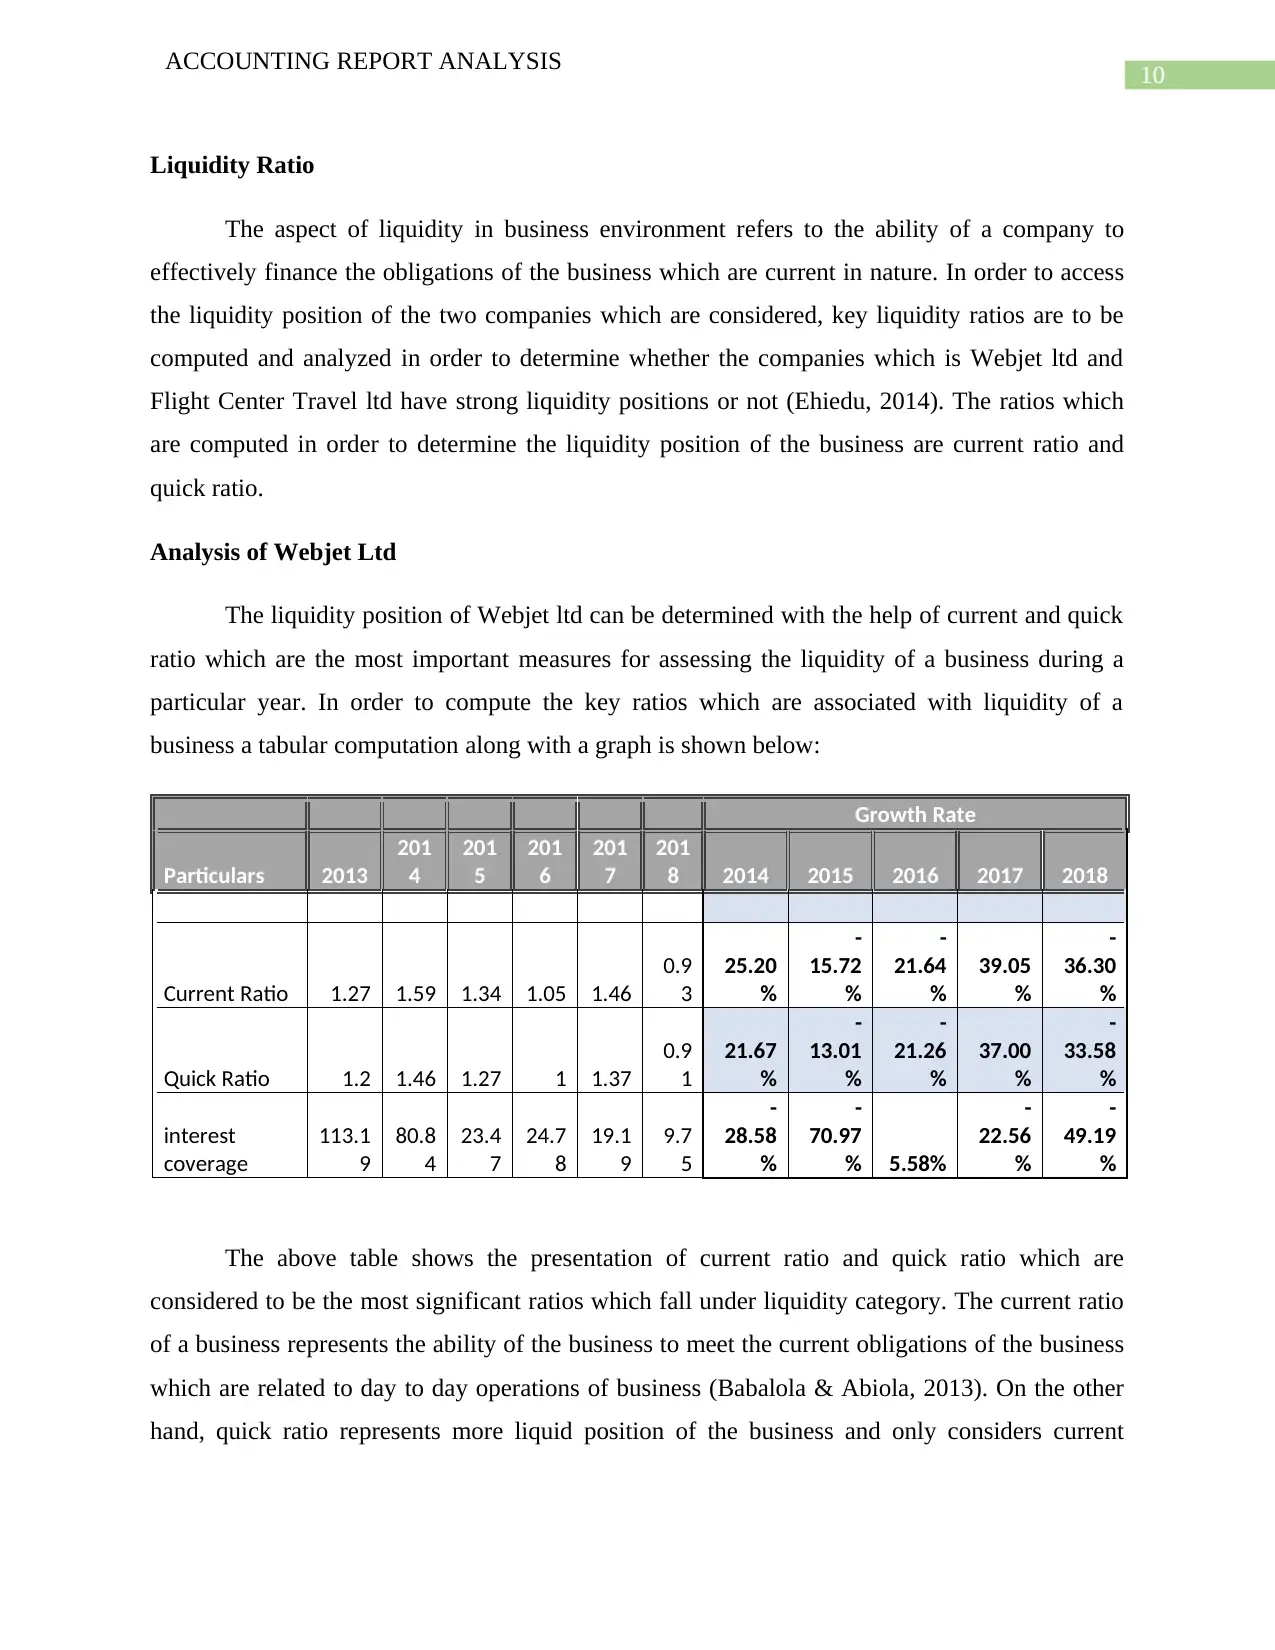
The net profit margin for the business of Webjet ltd is shown to be 5.52% which is
significantly lower than the net profit margin of Flight Center Travel ltd for the year 2018. This
shows that the management of Flight Center Travel ltd had a better sales and distribution
structure and also an effective cost management policy of the business. The return on equity of
both the business which is shown with the help of the table which is initially provided. The
computation of return on equity of the business reveals that Flight Center Travel ltd has a better
structure than Webjet ltd. The return on assets of Flight Center Travel ltd is also to be better for
the year 2018. The return on investments which the management of the company receives is also
shown to be not much as compared to Flight Center Travel ltd. The overall comparison reveals
that the business of Flight Center Travel ltd is performing better than the business of Webjet. The
graph which is shown in figure 3, that the net profit margin of Webjet was much better when the
period which is to be consider is between 2013 to 2018. The comparison of net profit margin as
per the graph reveals that the profits of the business has significantly fallen in the year 2018 and
prior to 2018, the net profit margin of Webjet was much better than the net profit margin of
Flight Center Travel ltd.
ACCOUNTING REPORT ANALYSIS
2013 2014 2015 2016 2017 2018
0.00%
5.00%
10.00%
15.00%
20.00%
25.00%
30.00%
Net Profi t Margin
Flight Center Travel Limited Webjet Limited
Figure 3: (Chart Showing Comparative analysis for both the companies)
Source: (Created by the Author)
The net profit margin for the business of Webjet ltd is shown to be 5.52% which is
significantly lower than the net profit margin of Flight Center Travel ltd for the year 2018. This
shows that the management of Flight Center Travel ltd had a better sales and distribution
structure and also an effective cost management policy of the business. The return on equity of
both the business which is shown with the help of the table which is initially provided. The
computation of return on equity of the business reveals that Flight Center Travel ltd has a better
structure than Webjet ltd. The return on assets of Flight Center Travel ltd is also to be better for
the year 2018. The return on investments which the management of the company receives is also
shown to be not much as compared to Flight Center Travel ltd. The overall comparison reveals
that the business of Flight Center Travel ltd is performing better than the business of Webjet. The
graph which is shown in figure 3, that the net profit margin of Webjet was much better when the
period which is to be consider is between 2013 to 2018. The comparison of net profit margin as
per the graph reveals that the profits of the business has significantly fallen in the year 2018 and
prior to 2018, the net profit margin of Webjet was much better than the net profit margin of
Flight Center Travel ltd.
Paraphrase This Document
Need a fresh take? Get an instant paraphrase of this document with our AI Paraphraser
10
ACCOUNTING REPORT ANALYSIS
Liquidity Ratio
The aspect of liquidity in business environment refers to the ability of a company to
effectively finance the obligations of the business which are current in nature. In order to access
the liquidity position of the two companies which are considered, key liquidity ratios are to be
computed and analyzed in order to determine whether the companies which is Webjet ltd and
Flight Center Travel ltd have strong liquidity positions or not (Ehiedu, 2014). The ratios which
are computed in order to determine the liquidity position of the business are current ratio and
quick ratio.
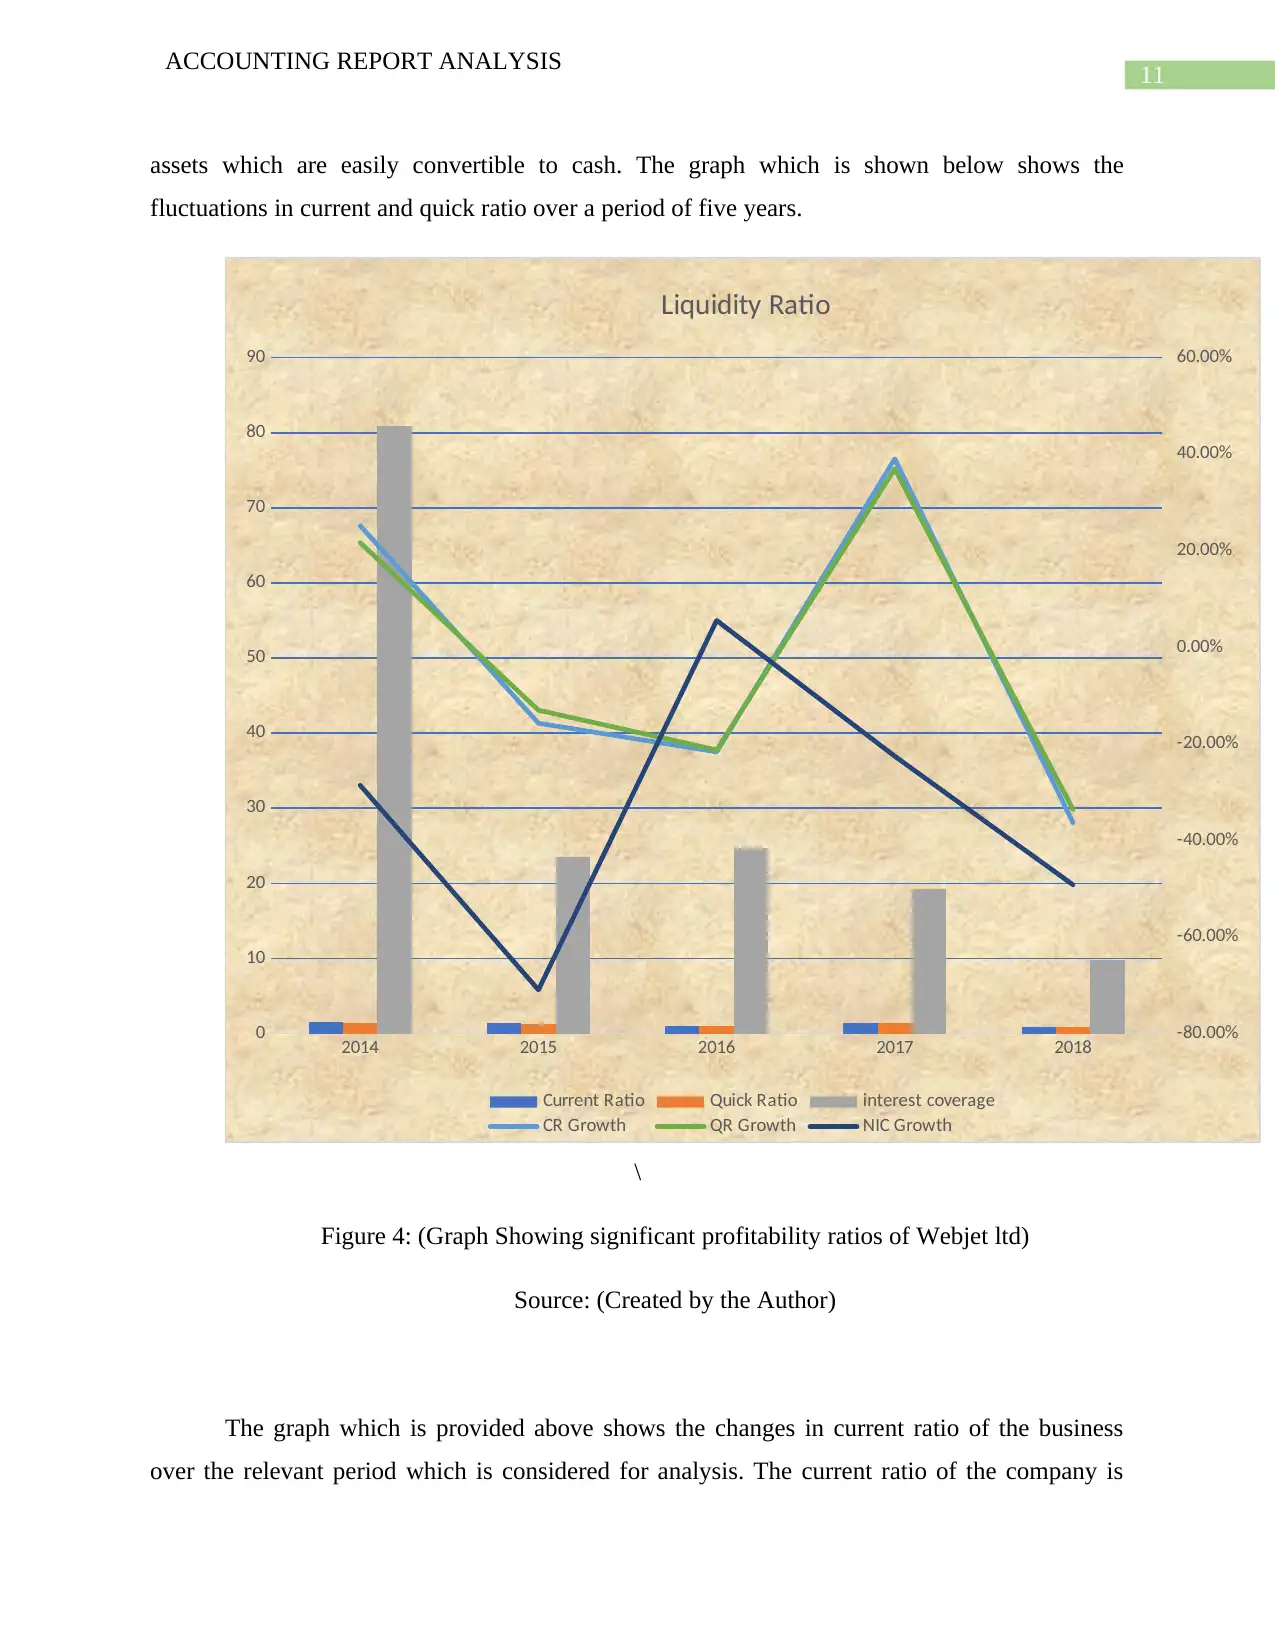
Analysis of Webjet Ltd
The liquidity position of Webjet ltd can be determined with the help of current and quick
ratio which are the most important measures for assessing the liquidity of a business during a
particular year. In order to compute the key ratios which are associated with liquidity of a
business a tabular computation along with a graph is shown below:
Growth Rate
Particulars 2013
201
4
201
5
201
6
201
7
201
8 2014 2015 2016 2017 2018
Current Ratio 1.27 1.59 1.34 1.05 1.46
0.9
3
25.20
%
-
15.72
%
-
21.64
%
39.05
%
-
36.30
%
Quick Ratio 1.2 1.46 1.27 1 1.37
0.9
1
21.67
%
-
13.01
%
-
21.26
%
37.00
%
-
33.58
%
interest
coverage
113.1
9
80.8
4
23.4
7
24.7
8
19.1
9
9.7
5
-
28.58
%
-
70.97
% 5.58%
-
22.56
%
-
49.19
%
The above table shows the presentation of current ratio and quick ratio which are
considered to be the most significant ratios which fall under liquidity category. The current ratio
of a business represents the ability of the business to meet the current obligations of the business
which are related to day to day operations of business (Babalola & Abiola, 2013). On the other
hand, quick ratio represents more liquid position of the business and only considers current
ACCOUNTING REPORT ANALYSIS
Liquidity Ratio
The aspect of liquidity in business environment refers to the ability of a company to
effectively finance the obligations of the business which are current in nature. In order to access
the liquidity position of the two companies which are considered, key liquidity ratios are to be
computed and analyzed in order to determine whether the companies which is Webjet ltd and
Flight Center Travel ltd have strong liquidity positions or not (Ehiedu, 2014). The ratios which
are computed in order to determine the liquidity position of the business are current ratio and
quick ratio.
Analysis of Webjet Ltd
The liquidity position of Webjet ltd can be determined with the help of current and quick
ratio which are the most important measures for assessing the liquidity of a business during a
particular year. In order to compute the key ratios which are associated with liquidity of a
business a tabular computation along with a graph is shown below:
Growth Rate
Particulars 2013
201
4
201
5
201
6
201
7
201
8 2014 2015 2016 2017 2018
Current Ratio 1.27 1.59 1.34 1.05 1.46
0.9
3
25.20
%
-
15.72
%
-
21.64
%
39.05
%
-
36.30
%
Quick Ratio 1.2 1.46 1.27 1 1.37
0.9
1
21.67
%
-
13.01
%
-
21.26
%
37.00
%
-
33.58
%
interest
coverage
113.1
9
80.8
4
23.4
7
24.7
8
19.1
9
9.7
5
-
28.58
%
-
70.97
% 5.58%
-
22.56
%
-
49.19
%
The above table shows the presentation of current ratio and quick ratio which are
considered to be the most significant ratios which fall under liquidity category. The current ratio
of a business represents the ability of the business to meet the current obligations of the business
which are related to day to day operations of business (Babalola & Abiola, 2013). On the other
hand, quick ratio represents more liquid position of the business and only considers current
11
ACCOUNTING REPORT ANALYSIS
assets which are easily convertible to cash. The graph which is shown below shows the
fluctuations in current and quick ratio over a period of five years.
2014 2015 2016 2017 2018
0
10
20
30
40
50
60
70
80
90
-80.00%
-60.00%
-40.00%
-20.00%
0.00%
20.00%
40.00%
60.00%
Liquidity Ratio
Current Ratio Quick Ratio interest coverage
CR Growth QR Growth NIC Growth
\
Figure 4: (Graph Showing significant profitability ratios of Webjet ltd)
Source: (Created by the Author)
The graph which is provided above shows the changes in current ratio of the business
over the relevant period which is considered for analysis. The current ratio of the company is
⊘ This is a preview!⊘
Do you want full access?
Subscribe today to unlock all pages.
Trusted by 1+ million students worldwide
1 out of 23
Related Documents


Your All-in-One AI-Powered Toolkit for Academic Success.
+13062052269
info@desklib.com
Available 24*7 on WhatsApp / Email
![[object Object]](/_next/static/media/star-bottom.7253800d.svg)
Unlock your academic potential
Copyright © 2020–2026 A2Z Services. All Rights Reserved. Developed and managed by ZUCOL.