BUSM4613 Project Management: Target Australia Website Development Plan
VerifiedAdded on 2022/08/16
|23
|3045
|12
Project
AI Summary
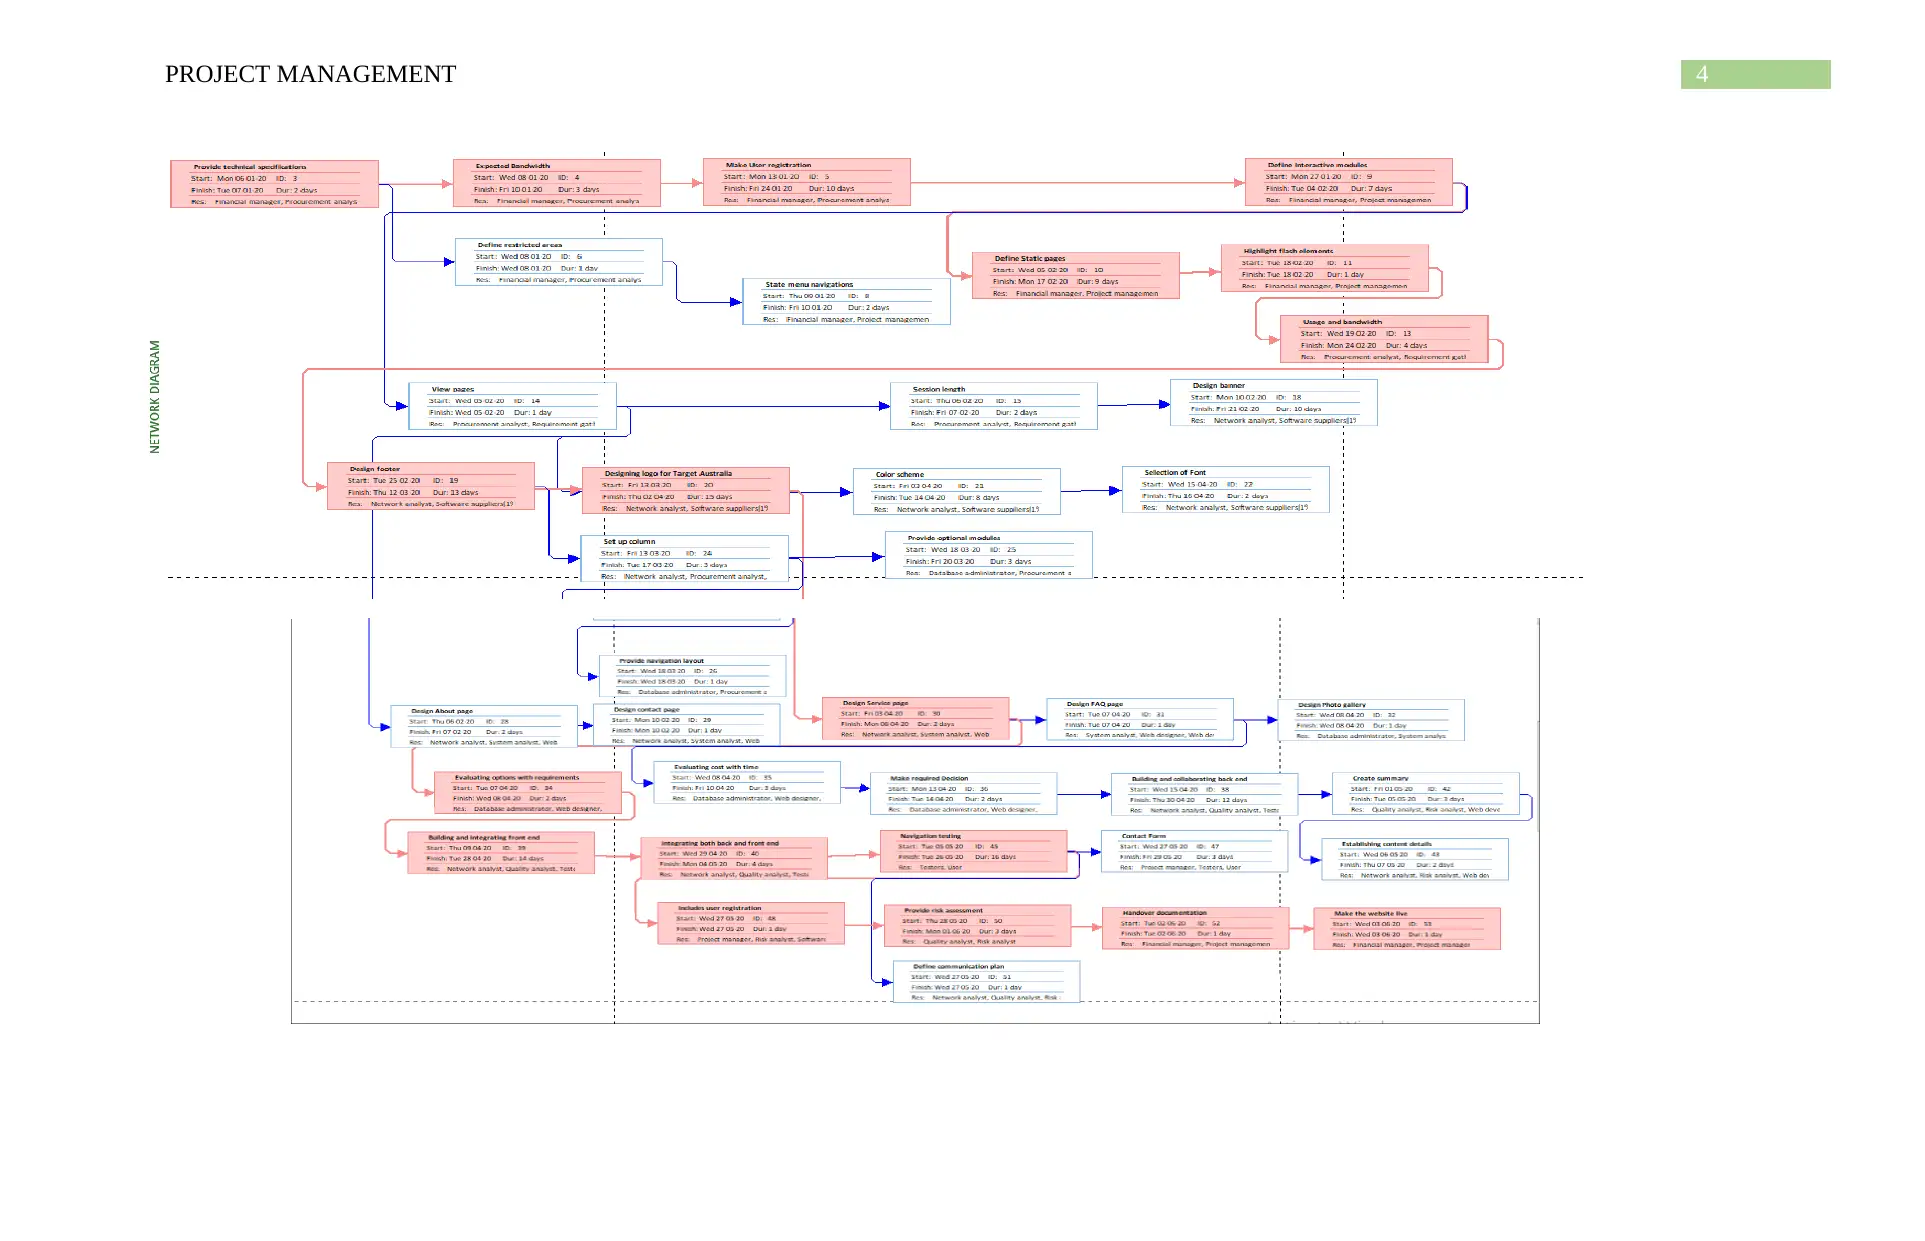
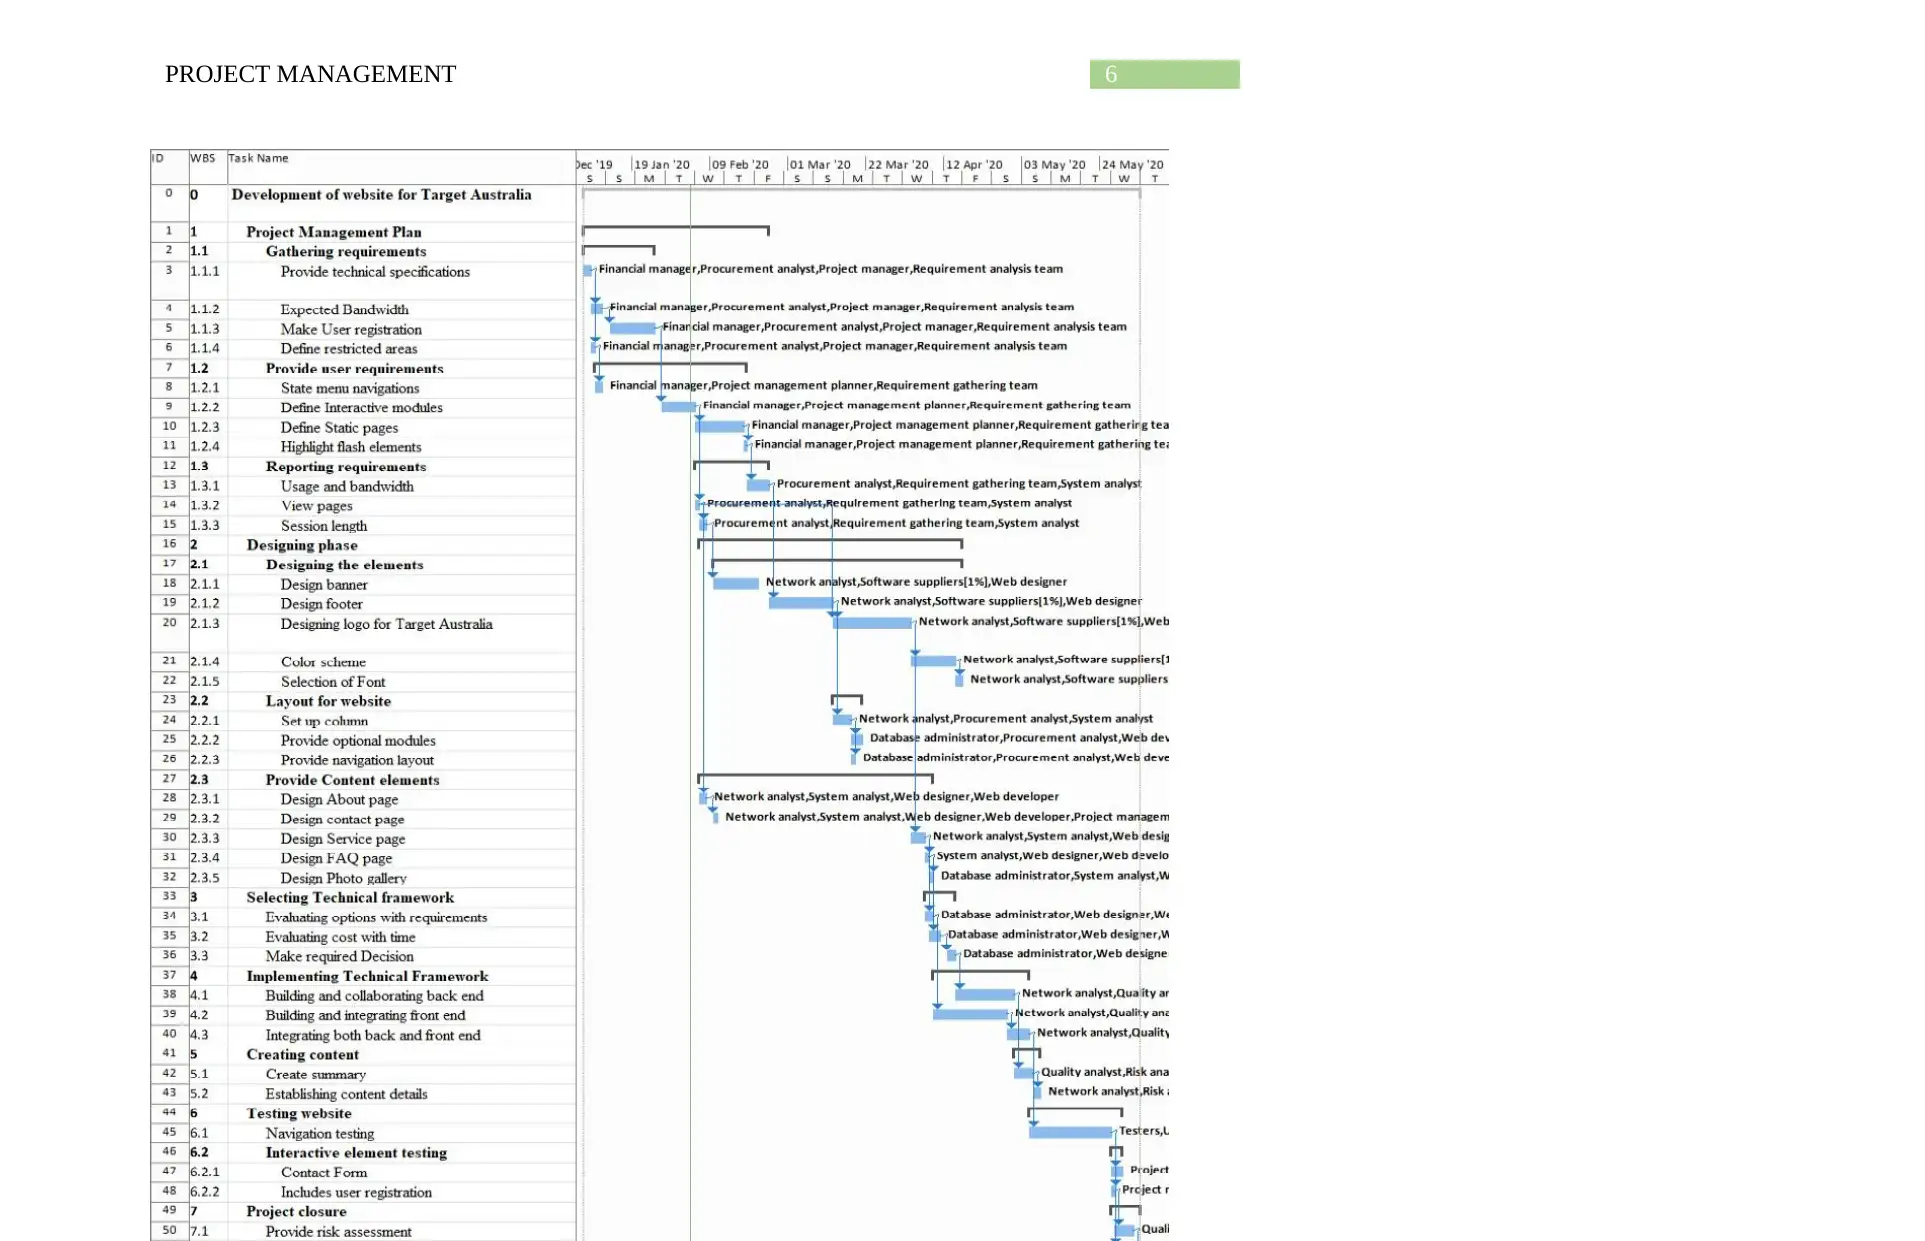
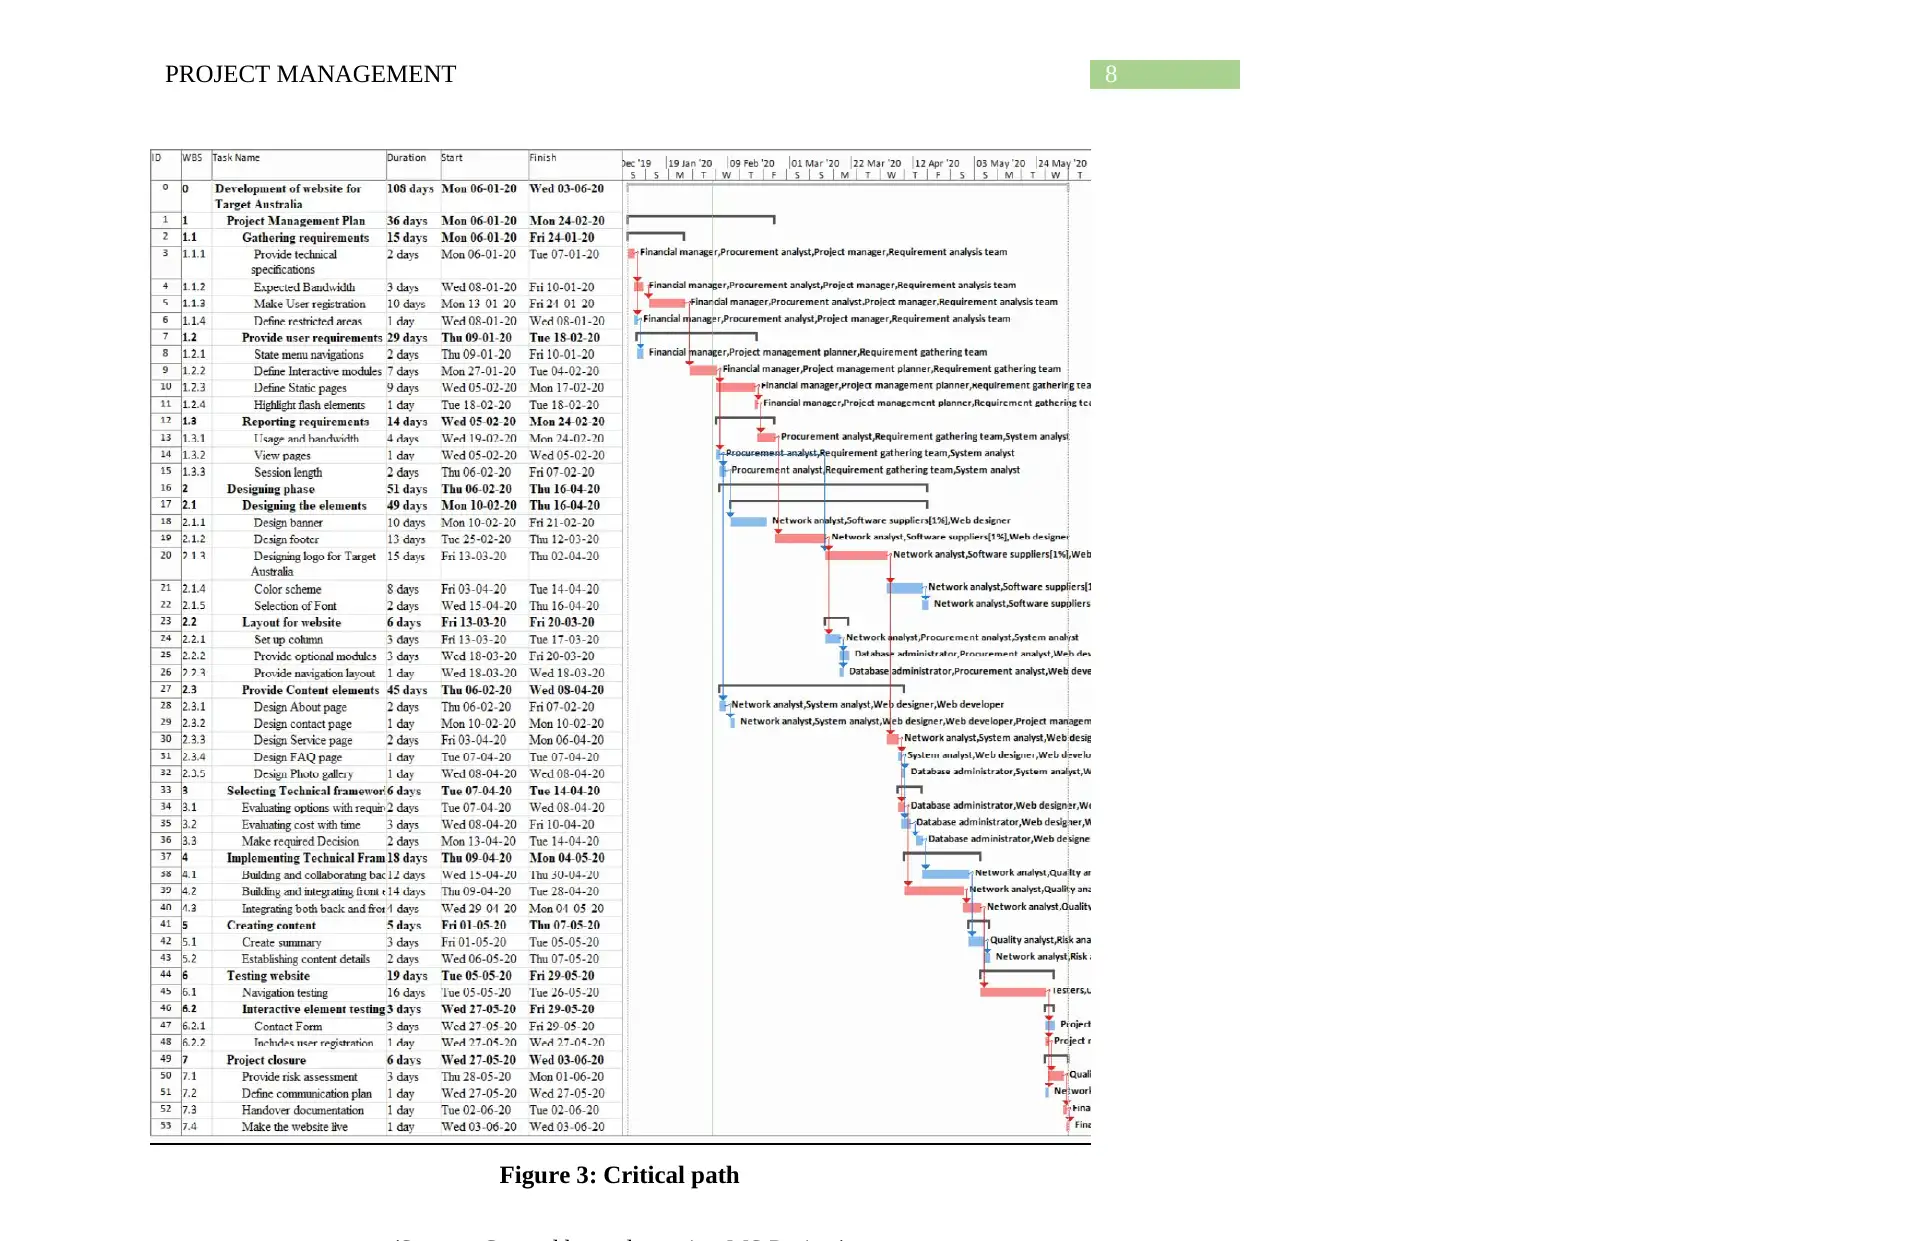
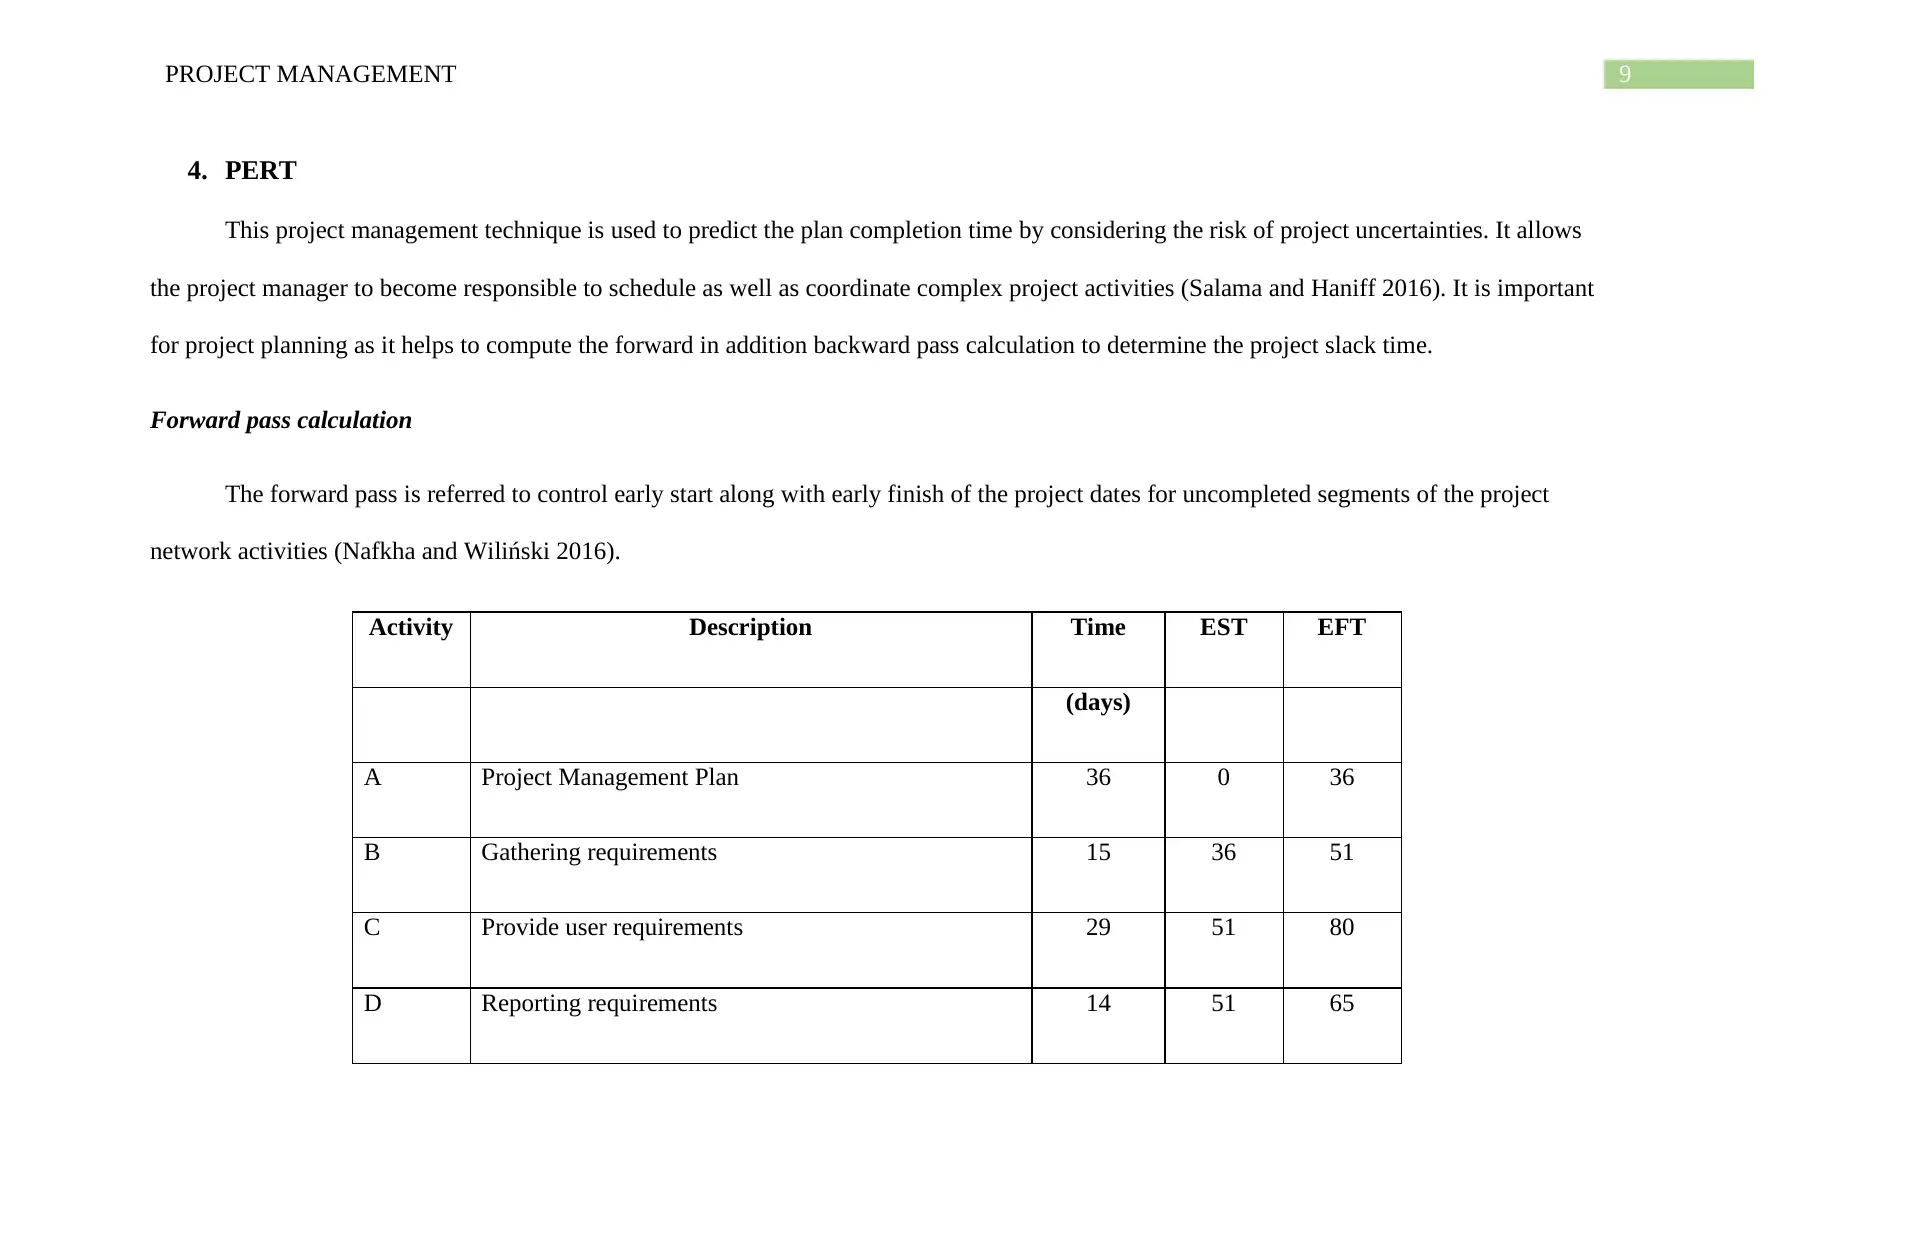
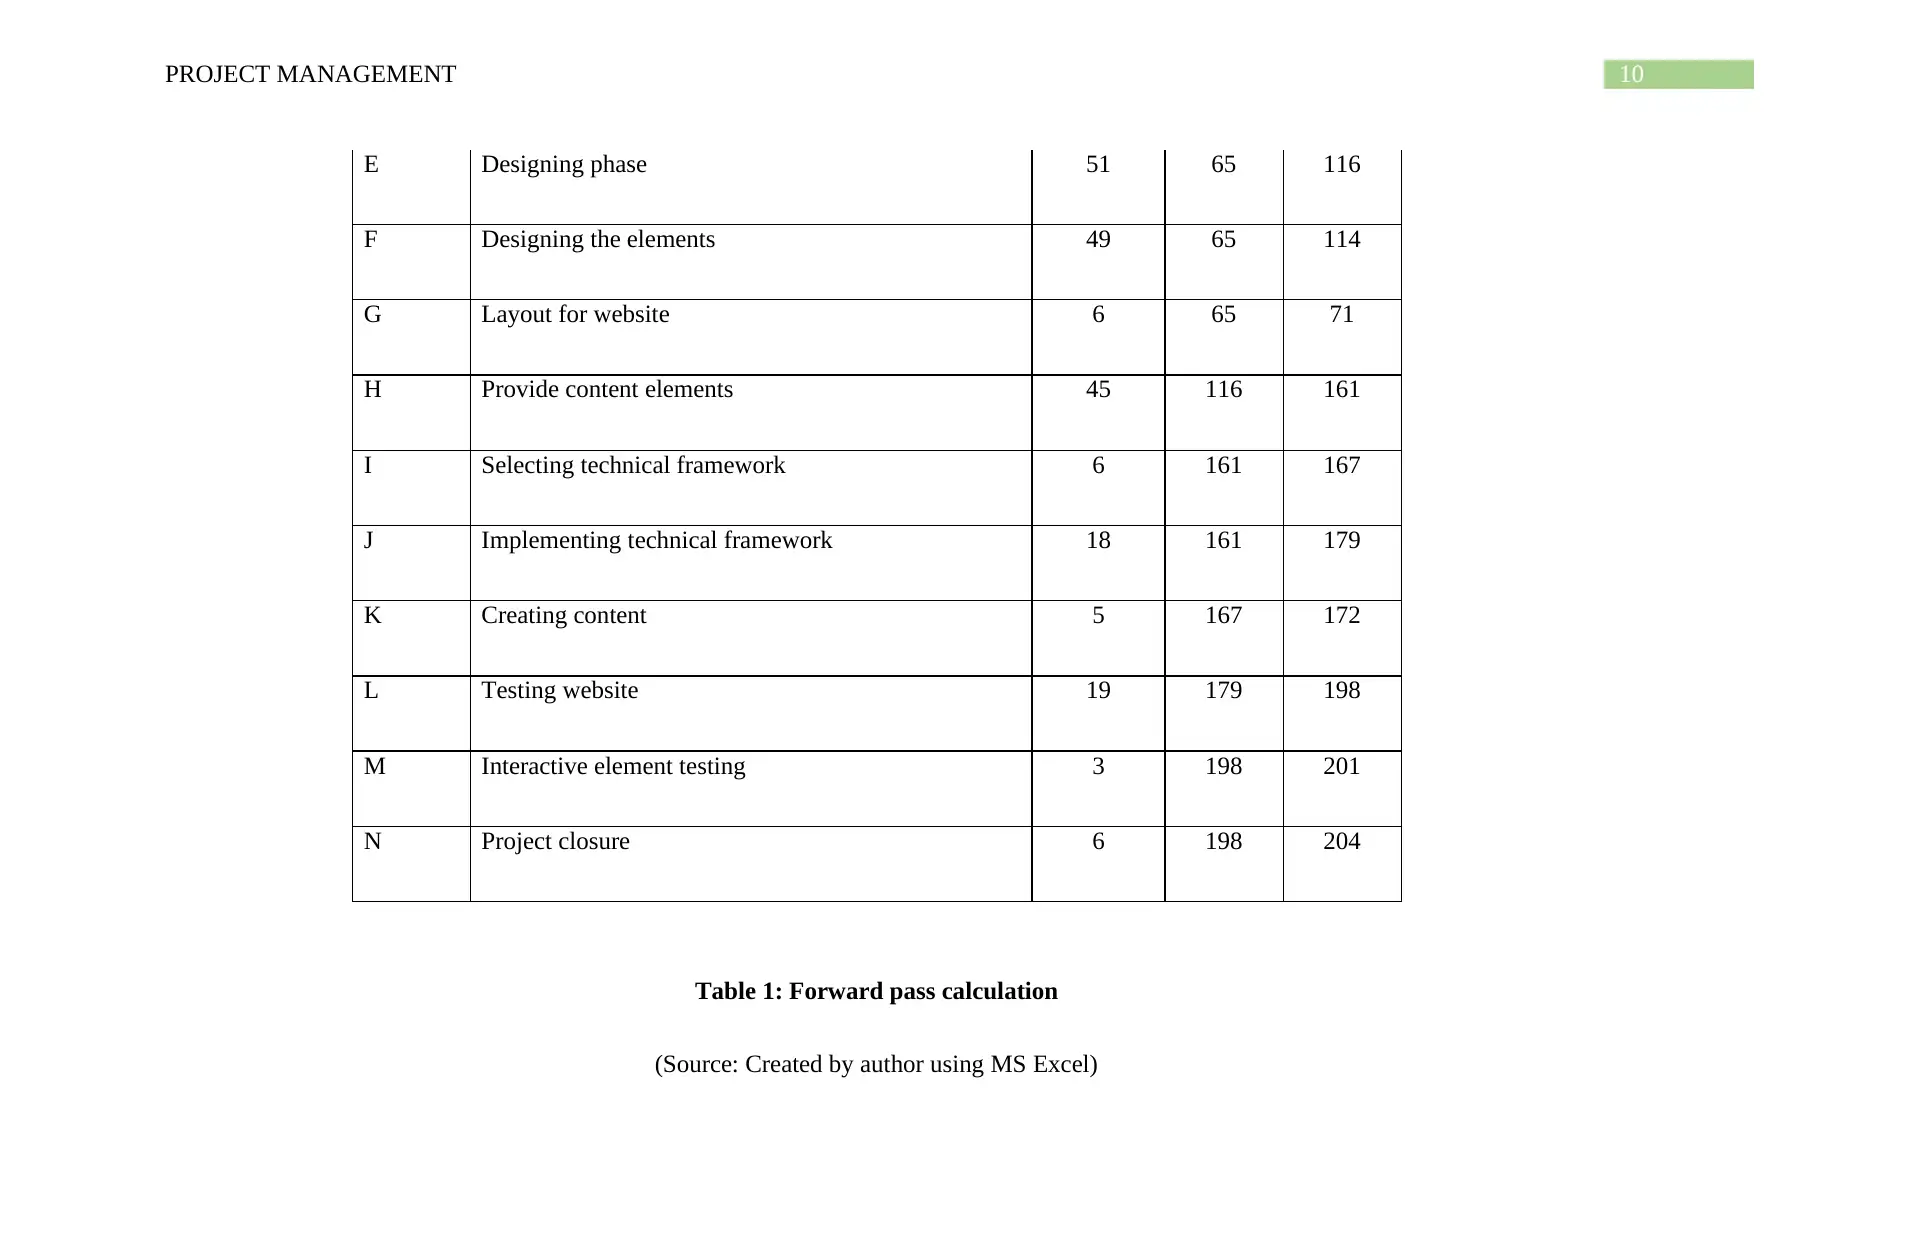
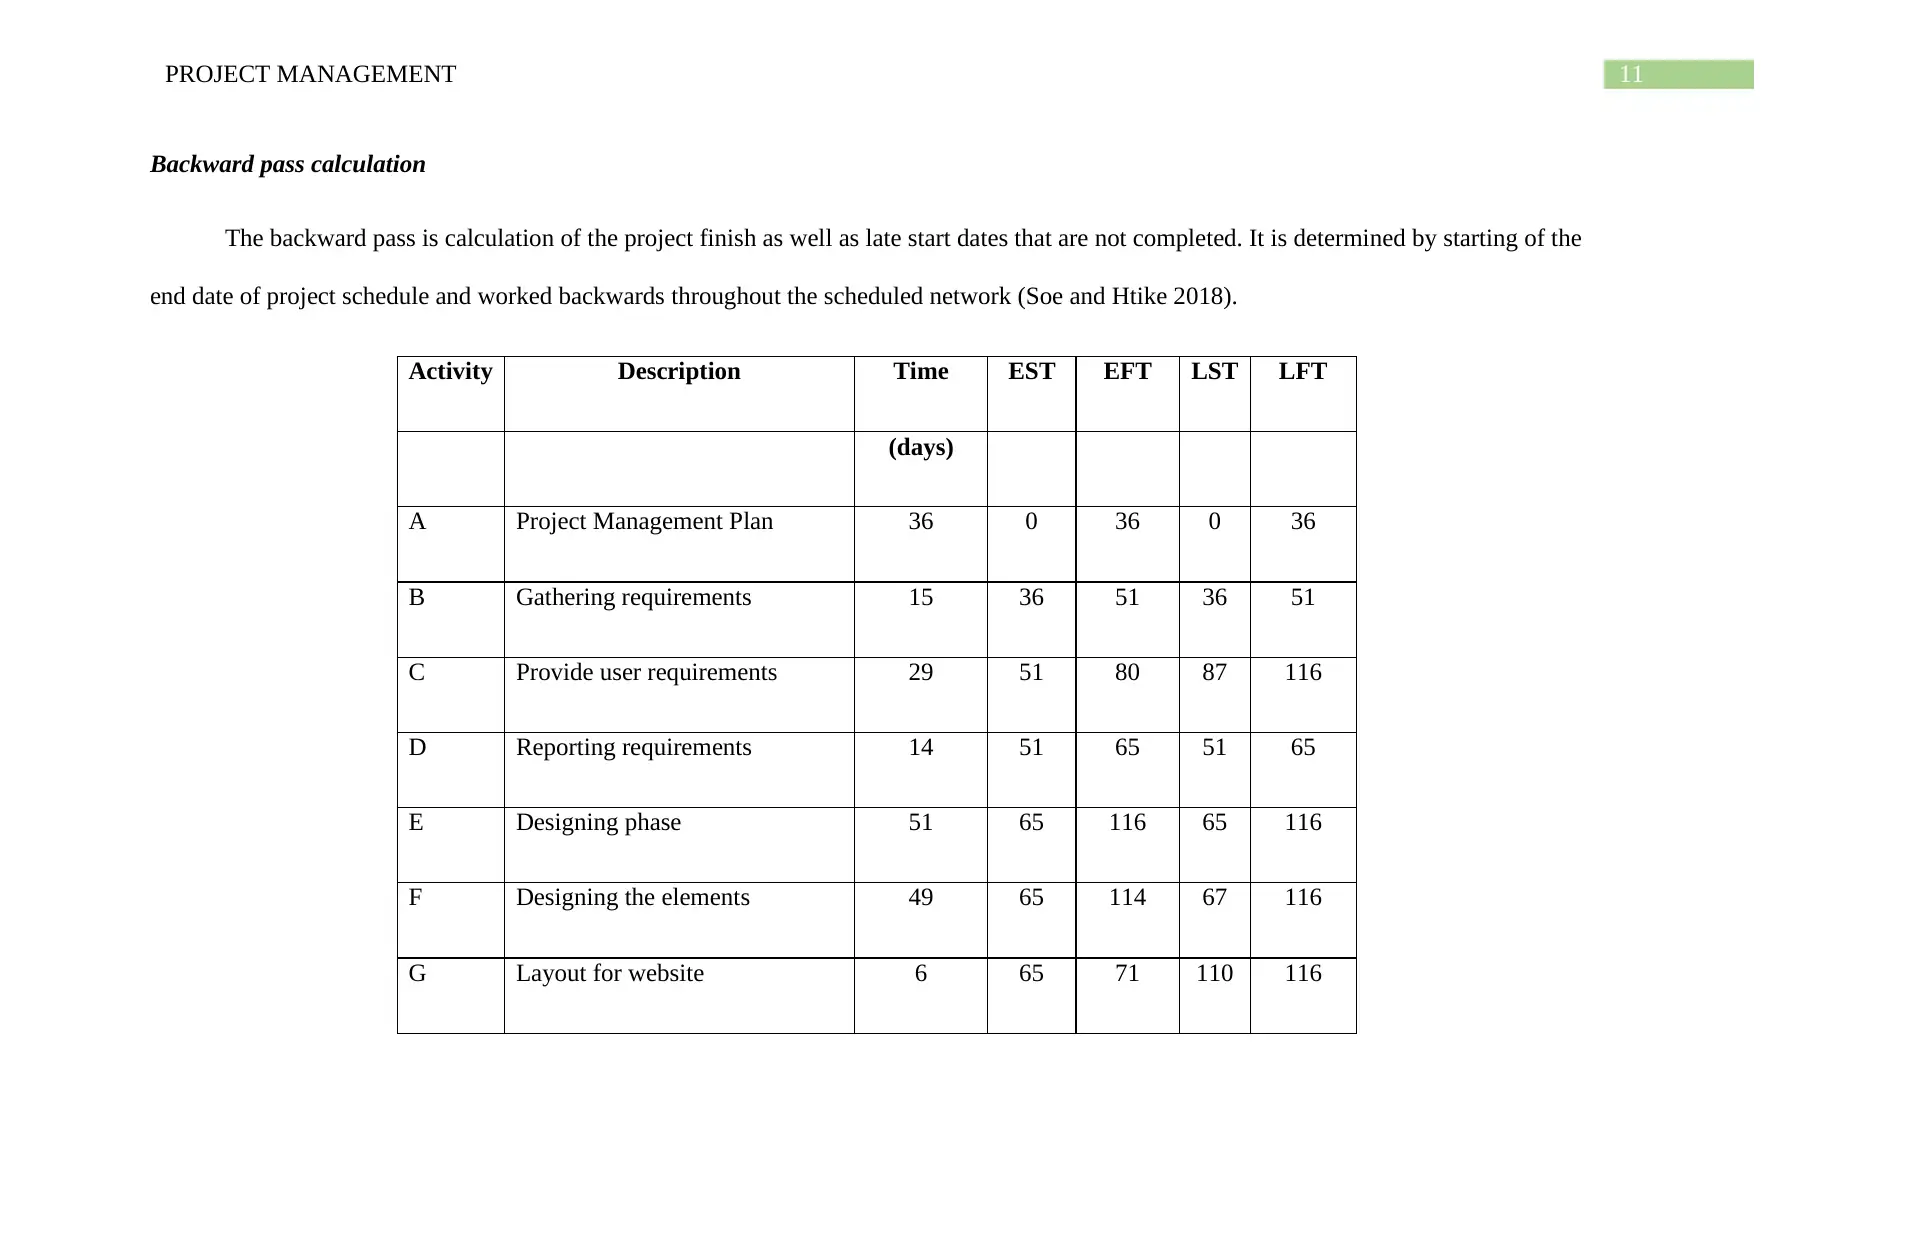
This project plan details the website development for Target Australia, employing agile project management methodology. The project, spanning 108 days from January 6, 2020, to June 3, 2020, aims to create a user-friendly website to facilitate online product purchases and improve company processes. The plan incorporates several project management techniques, including network diagrams, bar charts, critical path analysis, PERT, and cash flow management. The project's scope focuses on identifying critical activities, managing dependencies, and monitoring costs. The report includes forward and backward pass calculations for PERT, a cash flow analysis to track financial health, and a work breakdown structure (WBS) to manage tasks. The estimated budget is $142,320.00. The project includes project management, design, technical framework selection and implementation, content creation, and website testing phases. The plan emphasizes critical path identification and cost management.
Contribute Materials
Your contribution can guide someone’s learning journey. Share your
documents today.

Running head: PROJECT MANAGEMENT
Stage 2: Development of website for Target Australia
Name of the Student:
Name of the University:
Stage 2: Development of website for Target Australia
Name of the Student:
Name of the University:
Secure Best Marks with AI Grader
Need help grading? Try our AI Grader for instant feedback on your assignments.

1PROJECT MANAGEMENT
Executive Summary
The report is reflected on analyzing the project management techniques would help Target
Australia to develop their company’s website. The entire project duration for the project plan
is 108 days and the project activities are dependent on each other, therefore there are chances
of project lag and ahead of schedule. In this paper, five project management techniques are
mentioned such as network diagram, PERT, bar chart, critical path analysis and cash flow
management. All the techniques are useful to complete project work on scheduled timeline and
forecasted cost. The scope of this project is determining the critical activities of project affect
the project completion. There is also measuring of inflow and outflow cost for the project for
successful finish of website development project plan.

2PROJECT MANAGEMENT
Table of Contents
Introduction ................................................................................................................................ 3
Project Management Techniques...............................................................................................3
1. Project Network ..............................................................................................................3
2. Bar Chart.........................................................................................................................5
3. Critical path method (CPM)............................................................................................7
4. PERT ............................................................................................................................... 9
5. Cash flow management.................................................................................................14
Conclusion ............................................................................................................................... 19
References ................................................................................................................................ 20
Bibliography ............................................................................................................................ 21
Appendix .................................................................................................................................. 22
1. Network and bar chart...................................................................................................22
2. PERT diagram...............................................................................................................22
3. Cash flow management.................................................................................................22

3PROJECT MANAGEMENT
Introduction
The project plan report is reflected on development of website for Target Australia. By
means of agile project management methodology, the project plan is carried out. The expected
duration of this project is 108 days with start date as 6 th January 2020 and end date is 3rd June
2020. The scope of this project is to develop website for the company to help the customers
buy online products and serve the company in better process. The client should satisfy with the
project timeline and also satisfy with the project scope. The estimated budget for the plan is
$142,320 required to finish work on scheduled timeline.
Project Management Techniques
1. Project Network
The project network is graphical way to view the project tasks and dependencies as well
as critical path of the project plan. The main purpose to establish the network diagram is
mapping the project schedule as well as sequencing project work for project planning. It helps
to track project progress through each project stages (Lock 2017). The project network also
illustrates possibility of the project. The scope of this project is to improve a user friendly
website for Target Australia with right system users. The developed website is easier to find
for the users to order their products from the Target Audience. In the website development
plan, the following diagram of project network is used to demonstrate interdependencies of
Secure Best Marks with AI Grader
Need help grading? Try our AI Grader for instant feedback on your assignments.

4PROJECT MANAGEMENT

5PROJECT MANAGEMENT
Figure 1: Project Network Diagram
(Source: Created by author using MS Project)
2. Bar Chart
Bar chart is also termed as Gantt chart, used for representing the development activities.
The length of the project schedule is proportional to time required to conclude the project tasks.
It is an effective project management tool to manage project work. The bar chart is graphic
opinion of the project tasks arranged over time. It helps to view start as well as conclusion date
of project plan in simple opinion (Harrison and Lock 2017). The bar chart is helpful to prepare
the project manager with information they need to supervise while managing the website
development plan. In case of complex project, the task dependencies are critical to manage,
therefore bar chart is a better tool to identify project progress. The bar chart helps to understand
severity of the project time delays while management of project work. The bar chart also
determines resources required and manages project task dependencies.
The below bar chart shows that the main activities in the project plan are project
management plan, designing phase, selecting technical framework, implementing technical
framework, creating content, testing website and project closure. Those are the main activities
required to complete the project work. The bar chart shows the task names and duration of each
activities. The horizontal line shows the duration of the project activities and vertical line shows

6PROJECT MANAGEMENT
Paraphrase This Document
Need a fresh take? Get an instant paraphrase of this document with our AI Paraphraser

7PROJECT MANAGEMENT
3. Critical path method (CPM)
Lock (2016) mentioned that the CPM is used in the website development plan for
managing in addition to analyzing the time of the project plan. It helps to recognize critical as
well as non-critical activities of the project plan from its starting to completion. The critical
path analysis aids to associate planned project schedule with actual position of the project work.
The critical path provides the manager with updated project related information, correct
completion time as well as flexibility to float project activities. The critical path is longest path
through entire network diagram of the project plan (Tonchia 2018). The activities on critical
path shows that the project may cause delays if not finished on scheduled timeframe. It helps
the project manager and project team members to determine expected finish time. It determines
shortest time required to complete project planning.
From the below figure, the identified critical activities are showing in red color small
boxes. The critical path activities are: activities under project management plan task (provide
technical specifications, expected bandwidth, make user registration, define interactive
module, define static pages, and highlight flash elements and usage and bandwidth). The
critical activities under designing phase (designer footer, designing logo for Target Australia
and designing service page). The critical activities under selecting technical framework
(evaluating options with requirements). The critical activities under implementing technical
framework (building and integrating frontend and integrating both back and front end). The

8PROJECT MANAGEMENT
Figure 3: Critical path

9PROJECT MANAGEMENT
4. PERT
This project management technique is used to predict the plan completion time by considering the risk of project uncertainties. It allows
the project manager to become responsible to schedule as well as coordinate complex project activities (Salama and Haniff 2016). It is important
for project planning as it helps to compute the forward in addition backward pass calculation to determine the project slack time.
Forward pass calculation
The forward pass is referred to control early start along with early finish of the project dates for uncompleted segments of the project
network activities (Nafkha and Wiliński 2016).
Activity Description Time EST EFT
(days)
A Project Management Plan 36 0 36
B Gathering requirements 15 36 51
C Provide user requirements 29 51 80
D Reporting requirements 14 51 65
Secure Best Marks with AI Grader
Need help grading? Try our AI Grader for instant feedback on your assignments.

10PROJECT MANAGEMENT
E Designing phase 51 65 116
F Designing the elements 49 65 114
G Layout for website 6 65 71
H Provide content elements 45 116 161
I Selecting technical framework 6 161 167
J Implementing technical framework 18 161 179
K Creating content 5 167 172
L Testing website 19 179 198
M Interactive element testing 3 198 201
N Project closure 6 198 204
Table 1: Forward pass calculation
(Source: Created by author using MS Excel)

11PROJECT MANAGEMENT
Backward pass calculation
The backward pass is calculation of the project finish as well as late start dates that are not completed. It is determined by starting of the
end date of project schedule and worked backwards throughout the scheduled network (Soe and Htike 2018).
Activity Description Time EST EFT LST LFT
(days)
A Project Management Plan 36 0 36 0 36
B Gathering requirements 15 36 51 36 51
C Provide user requirements 29 51 80 87 116
D Reporting requirements 14 51 65 51 65
E Designing phase 51 65 116 65 116
F Designing the elements 49 65 114 67 116
G Layout for website 6 65 71 110 116

12PROJECT MANAGEMENT
H Provide content elements 45 116 161 116 161
I Selecting technical framework 6 161 167 187 193
J
Implementing technical
framework 18 161 179 161 179
K Creating content 5 167 172 193 198
L Testing website 19 179 198 179 198
M Interactive element testing 3 198 201 198 201
N Project closure 6 198 204 198 204
Table 2: Backward pass calculation
(Source: Created by author using MS Excel)
Below figure shows the PERT diagram of the project activities and the calculation of forward and backward pass is calculated to determine
early start, early finish, latest start and latest finish.
Paraphrase This Document
Need a fresh take? Get an instant paraphrase of this document with our AI Paraphraser

13PROJECT MANAGEMENT
Figure 4: PERT Chart
(Source: Created by author using MS Visio)
Figure 4: PERT Chart
(Source: Created by author using MS Visio)

14PROJECT MANAGEMENT
5. Cash flow management
The cash flow is financial planning of the project work required to understand inflow as well as outflow of the cash that is being created in
the project (Shash and Qarra 2018). Net cash flow is required to measure financial health of the Target Australia business. In below table, at first
the complete percentage of each project activities are identified or evaluated, then the actual cost is calculated based on the completion percentage
of each project activities. Budgeted cost of work performed (BCWP) is calculated by means of actual percentage complete * task budget. After
calculating numerical values for AC, BCWP, total cost and % completion, it is seen that the cost is $142,320.00, actual cost is $95,400.80, BCWP
is $21,080.00 and percentage completion of work is 64%.
WBS Task Name Cost Actual Cost BCWP % Complete
0 Development of website for Target Australia $142,320.00 $95,400.80 $21,080.00 64%
1 Project Management Plan $34,760.00 $34,760.00 $21,080.00 100%
1.1 Gathering requirements $13,160.00 $13,160.00 $13,160.00 100%
1.1.1 Provide technical specifications $3,760.00 $3,760.00 $3,760.00 100%
1.1.2 Expected Bandwidth $5,640.00 $5,640.00 $5,640.00 100%
1.1.3 Make User registration $1,880.00 $1,880.00 $1,880.00 100%

15PROJECT MANAGEMENT
1.1.4 Define restricted areas $1,880.00 $1,880.00 $1,880.00 100%
1.2 Provide user requirements $13,200.00 $13,200.00 $7,920.00 100%
1.2.1 State menu navigations $2,640.00 $2,640.00 $2,640.00 100%
1.2.2 Define Interactive modules $5,280.00 $5,280.00 $5,280.00 100%
1.2.3 Define Static pages $3,960.00 $3,960.00 $0.00 100%
1.2.4 Highlight flash elements $1,320.00 $1,320.00 $0.00 100%
1.3 Reporting requirements $8,400.00 $8,400.00 $0.00 100%
1.3.1 Usage and bandwidth $4,800.00 $4,800.00 $0.00 100%
1.3.2 View pages $1,200.00 $1,200.00 $0.00 100%
1.3.3 Session length $2,400.00 $2,400.00 $0.00 100%
2 Designing phase $52,860.00 $51,706.40 $0.00 98%
2.1 Designing the elements $31,580.00 $30,596.00 $0.00 98%
2.1.1 Design banner $9,180.00 $8,262.00 $0.00 90%
2.1.2 Design footer $6,600.00 $6,534.00 $0.00 99%
Secure Best Marks with AI Grader
Need help grading? Try our AI Grader for instant feedback on your assignments.

16PROJECT MANAGEMENT
2.1.3 Designing logo for Target Australia $7,400.00 $7,400.00 $0.00 100%
2.1.4 Color scheme $4,840.00 $4,840.00 $0.00 100%
2.1.5 Selection of Font $3,560.00 $3,560.00 $0.00 100%
2.2 Layout for website $8,720.00 $8,604.80 $0.00 99%
2.2.1 Set up column $3,600.00 $3,600.00 $0.00 100%
2.2.2 Provide optional modules $3,840.00 $3,724.80 $0.00 97%
2.2.3 Provide navigation layout $1,280.00 $1,280.00 $0.00 100%
2.3 Provide Content elements $12,560.00 $12,505.60 $0.00 99%
2.3.1 Design About page $3,360.00 $3,360.00 $0.00 100%
2.3.2 Design contact page $2,080.00 $2,080.00 $0.00 100%
2.3.3 Design Service page $4,160.00 $4,118.40 $0.00 99%
2.3.4 Design FAQ page $1,280.00 $1,267.20 $0.00 99%
2.3.5 Design Photo gallery $1,680.00 $1,680.00 $0.00 100%
3 Selecting Technical framework $8,960.00 $8,934.40 $0.00 99%

17PROJECT MANAGEMENT
3.1 Evaluating options with requirements $2,560.00 $2,560.00 $0.00 100%
3.2 Evaluating cost with time $3,840.00 $3,840.00 $0.00 100%
3.3 Make required Decision $2,560.00 $2,534.40 $0.00 99%
4 Implementing Technical Framework $21,220.00 $0.00 $0.00 0%
4.1 Building and collaborating back end $7,840.00 $0.00 $0.00 0%
4.2 Building and integrating front end $8,900.00 $0.00 $0.00 0%
4.3 Integrating both back and front end $4,480.00 $0.00 $0.00 0%
5 Creating content $6,000.00 $0.00 $0.00 0%
5.1 Create summary $3,600.00 $0.00 $0.00 0%
5.2 Establishing content details $2,400.00 $0.00 $0.00 0%
6 Testing website $12,680.00 $0.00 $0.00 0%
6.1 Navigation testing $7,680.00 $0.00 $0.00 0%
6.2 Interactive element testing $5,000.00 $0.00 $0.00 0%
6.2.1 Contact Form $3,120.00 $0.00 $0.00 0%

18PROJECT MANAGEMENT
6.2.2 Includes user registration $1,880.00 $0.00 $0.00 0%
7 Project closure $5,840.00 $0.00 $0.00 0%
7.1 Provide risk assessment $2,160.00 $0.00 $0.00 0%
7.2 Define communication plan $1,120.00 $0.00 $0.00 0%
7.3 Handover documentation $1,480.00 $0.00 $0.00 0%
7.4 Make the website live $1,080.00 $0.00 $0.00 0%
Table 3: Cash flow management
(Source: Created by author using MS Project)
The cash flow diagram shows that the actual cost for the project is $95,400, baseline cost is $142,320.00, remaining cost required to
complete the project is $46,919.20.
Paraphrase This Document
Need a fresh take? Get an instant paraphrase of this document with our AI Paraphraser

19PROJECT MANAGEMENT
Figure 5: Cash Flow Management
(Source: Created by author)
Conclusion
It is concluded that the project management techniques are diverse and the project
manager is responsible to identify factors as well as limitations on project initiation to closure
phase. Changes into the project scope lead to slow down entire project progress while a good
leader can complete work in scheduled time and allocated resources. The project management
techniques are helpful to determine project progress, on time completion and control over scope
and cost. The techniques are useful in website development planning as it brings leadership as
well as directs the plan manager to motivate development team to do best work.

20PROJECT MANAGEMENT
References
Harrison, F. and Lock, D., 2017. Advanced project management: a structured approach.
Routledge.
Lock, D., 2016. Project Management in Construction. Routledge.
Lock, D., 2017. The essentials of project management. Routledge.
Nafkha, R. and Wiliński, A., 2016. The critical path method in estimating project
duration. Information Systems in Management, 5(1), pp.78-87.
Salama, M. and Haniff, A., 2016. 9 Project Scheduling. Project Management.
Shash, A.A. and Qarra, A.A., 2018. Cash flow management of construction projects in Saudi
Arabia. Project Management Journal, 49(5), pp.48-63.
Soe, P.H. and Htike, T.M., 2018. Critical path analysis programming method without network
diagram. In MATEC Web of Conferences (Vol. 192, p. 01027). EDP Sciences.
Tonchia, S., 2018. Project time management. In Industrial project management (pp. 117-129).
Springer, Berlin, Heidelberg.

21PROJECT MANAGEMENT
Bibliography
Nicholas, J.M. and Steyn, H., 2017. Project management for engineering, business and
technology. Routledge.
Young Illies, M. and Stachowski, A.A., 2019. Improving students’ teamwork experience:
Evaluating a project management application. Scholarship of Teaching and Learning in
Psychology.
Yu, M.C., Dang, V.L. and Yeh, H.C., 2017. Measuring cash flow and overdraft for fuzzy
project networks with overlapping activities. Journal of Civil Engineering and
Management, 23(4), pp.487-498.
Secure Best Marks with AI Grader
Need help grading? Try our AI Grader for instant feedback on your assignments.

22PROJECT MANAGEMENT
Appendix
1. Network and bar chart
2. PERT diagram
3. Cash flow management
Appendix
1. Network and bar chart
2. PERT diagram
3. Cash flow management
1 out of 23
Related Documents

Your All-in-One AI-Powered Toolkit for Academic Success.
+13062052269
info@desklib.com
Available 24*7 on WhatsApp / Email
Unlock your academic potential
© 2024 | Zucol Services PVT LTD | All rights reserved.