Weekly Stock Performance and Correlation Evaluation
VerifiedAdded on 2020/07/22
|18
|2372
|119
AI Summary
This report delves into the weekly performance of key stocks including Wesfarmers, Caltex Energy, Skycity Entertainment, and AirXpanders, providing detailed insights into each stock's weekly percentage change and influencing factors. Additionally, it presents a comprehensive correlation matrix illustrating relationships between various indices such as ASX, NZX, NYSE, currency pairs like NZD/AUD and USD/AUD, and specific stocks. This analysis aids in understanding market dynamics and refining investment strategies by highlighting significant correlations and trends. The data spans ten weeks, capturing the impact of diverse economic factors on stock prices and index movements.
FIN302
Paraphrase This Document
Need a fresh take? Get an instant paraphrase of this document with our AI Paraphraser
TABLE OF CONTENTS
INTRODUCTION...........................................................................................................................1
1.......................................................................................................................................................1
(a)Calculation of percentage change in equity in different weeks..............................................1
(b) Performance of portfolio relative to others portfolio.............................................................1
(2) ASX and stock performance......................................................................................................2
(3).....................................................................................................................................................3
(a) Foreign companies stocks and index......................................................................................3
(b) Correlation between foreign stocks........................................................................................4
©Foreign stocks and Australian market......................................................................................4
4 Relationship between Australia based MNC currency exposure and stock prices.......................5
5 Relationship between Foreign company stocks and currency to which they are exposed...........5
REFERENCES................................................................................................................................6
APPENDIX......................................................................................................................................7
Figure 1Stock exchange in Australian companies...........................................................................2
Figure 2Indexes and companies stocks performance......................................................................3
Figure 3Foreign companies stock performance...............................................................................4
Figure 4Foreign companies and ASX performance........................................................................4
INTRODUCTION
1
(a)Calculation of percentage change in equity in different weeks
Attached in appendix
(b) Performance of portfolio relative to others portfolio
Performance was high relative to other students portfolio. This is assumed because total
stock return geenrated by market is 4% and portfolio generate return of 2%. It can be said that
portfolio give moderate performance relative to market and due to this reason it is assumed that
on average basis portfolio perform better then same of other students. Market forces are the
major factor behind increase and decrease in return generated by relevant firms stocks. This is
because every week no company issue press release or no news comes in respect to its business
in the market (Hameed, Kang and Viswanathan, 2010). It can be observed that consistently there
was pressure in market and due to this reason market indies either generate low or negative
return on investment. All these things have direct inpact on companies stocks and when market
rise or decline companies stocks value increase or decrease in the market. It can be seen that
Wesfarmers in month of December decided to sale its mine which will lead to increase in its
revenue. This lead to increase in firm shares but then news of decline production lead to erosion
of share value in the market. Clatex energy in month of December declare that is going to
decleare infrastructure that is New port terminal which positively affect firm and due to this
reason its price increase. However, news of opposition of ACCC lead to decline in share price by
4%. In case of other two firms also less news comes in market during relevant time period and
due to this reason it is assumed that it is the market factor highly affect share price then company
factor.
1 | P a g e
⊘ This is a preview!⊘
Do you want full access?
Subscribe today to unlock all pages.
Trusted by 1+ million students worldwide
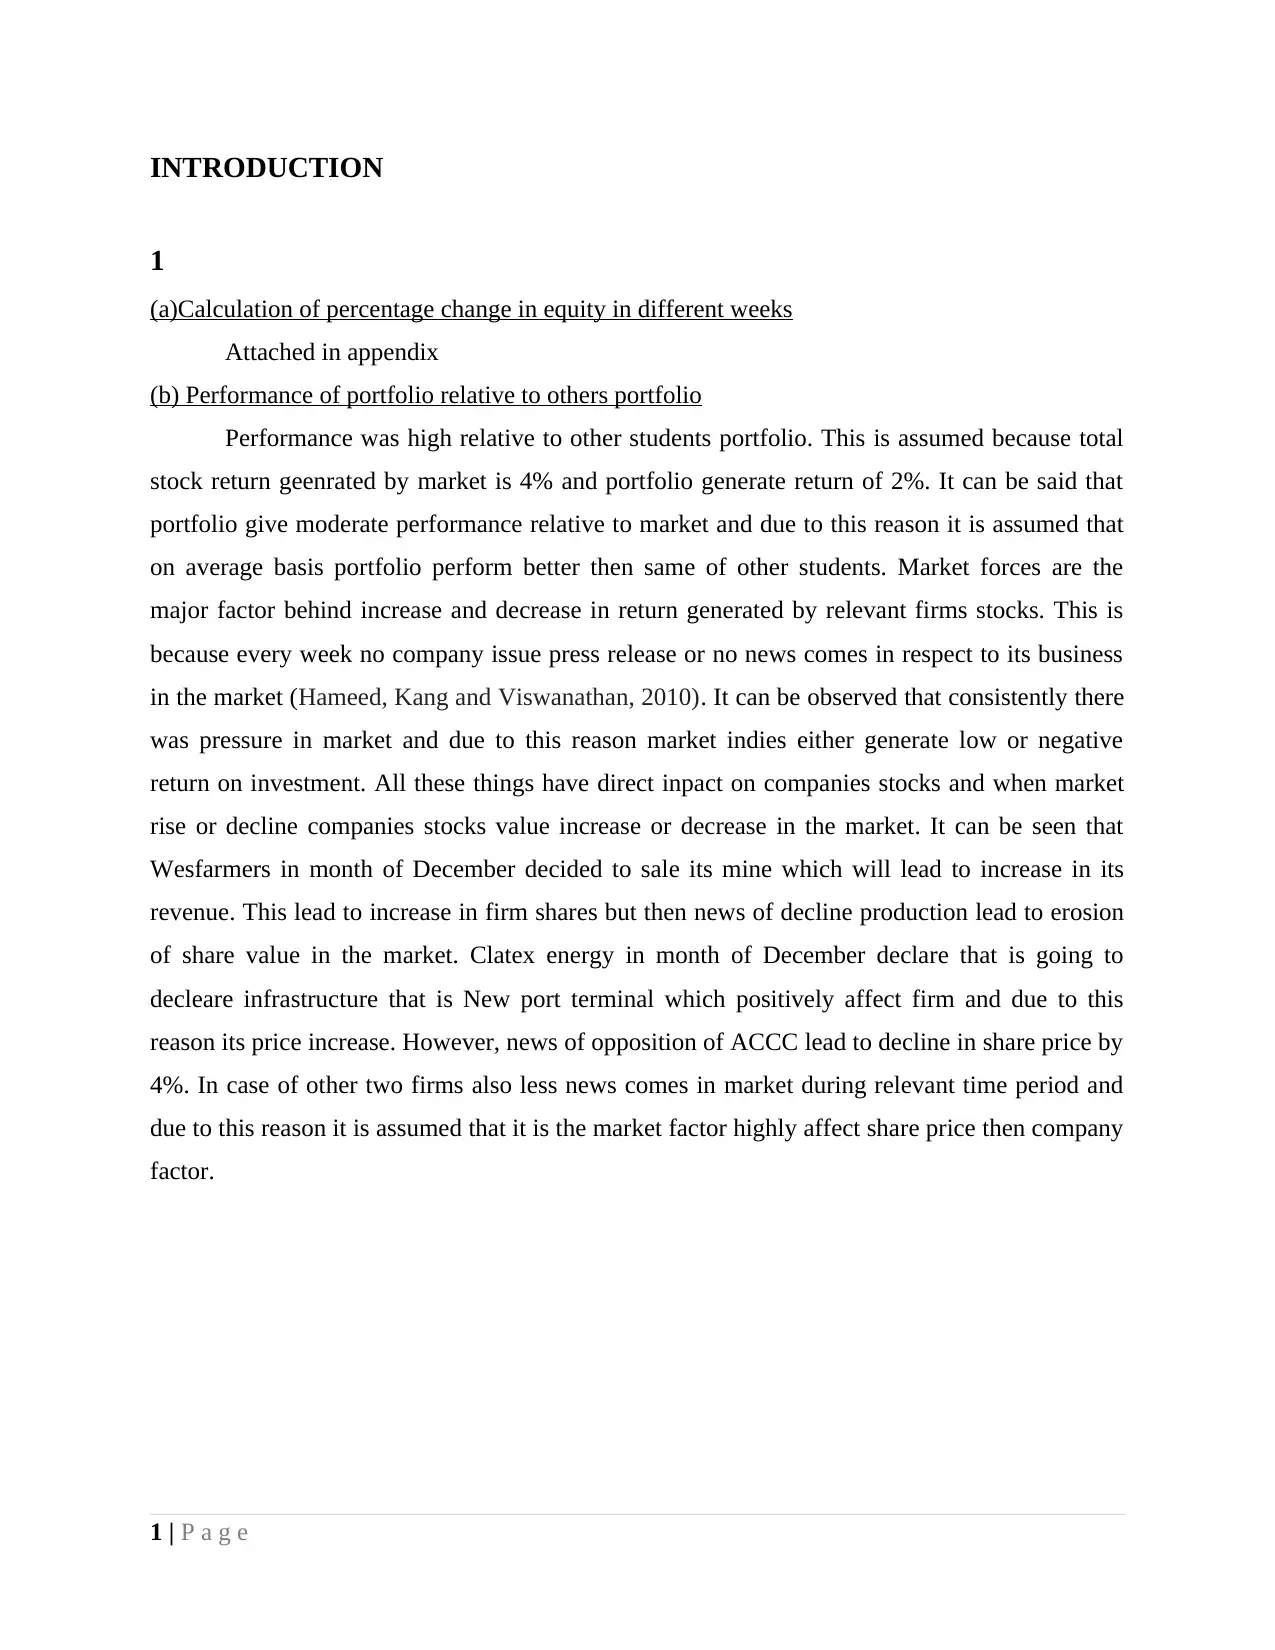
(2) ASX and stock performance
1 2 3 4 5 6 7 8 9 10 11 12 13 14 15 16 17 18 19 20 21 22 23 24 25 26 27 28 29 30 31 32 33 34 35 36 37 38 39 40 41 42 43
-4%
-3%
-2%
-1%
0%
1%
2%
3%
4%
5%
Chart Title
Wesfarmers Caltex energy ASX
Figure 1Stock exchange in Australian companies
Interpretation
It can be seen from chart that ASX and Wesfarmers are moving almost in same direction
and magnitude as well as intensity is different to some extent in case of market and mentioned
company. Correlation value is 0.73 which is reflecting that index and mentioned company are
highly coorelated to each other and moving in same direction. In case of Caltex energy changes
happened at rapid pace and are not inline to ASX. Coorleation value in case of Caltex energy and
ASX is 0.22 which is low and it can be said that index and stocks both are less coorelated to each
other. Hence, it can be said that ASX and both companies stock movements are related to each
other.
2 | P a g e
Paraphrase This Document
Need a fresh take? Get an instant paraphrase of this document with our AI Paraphraser
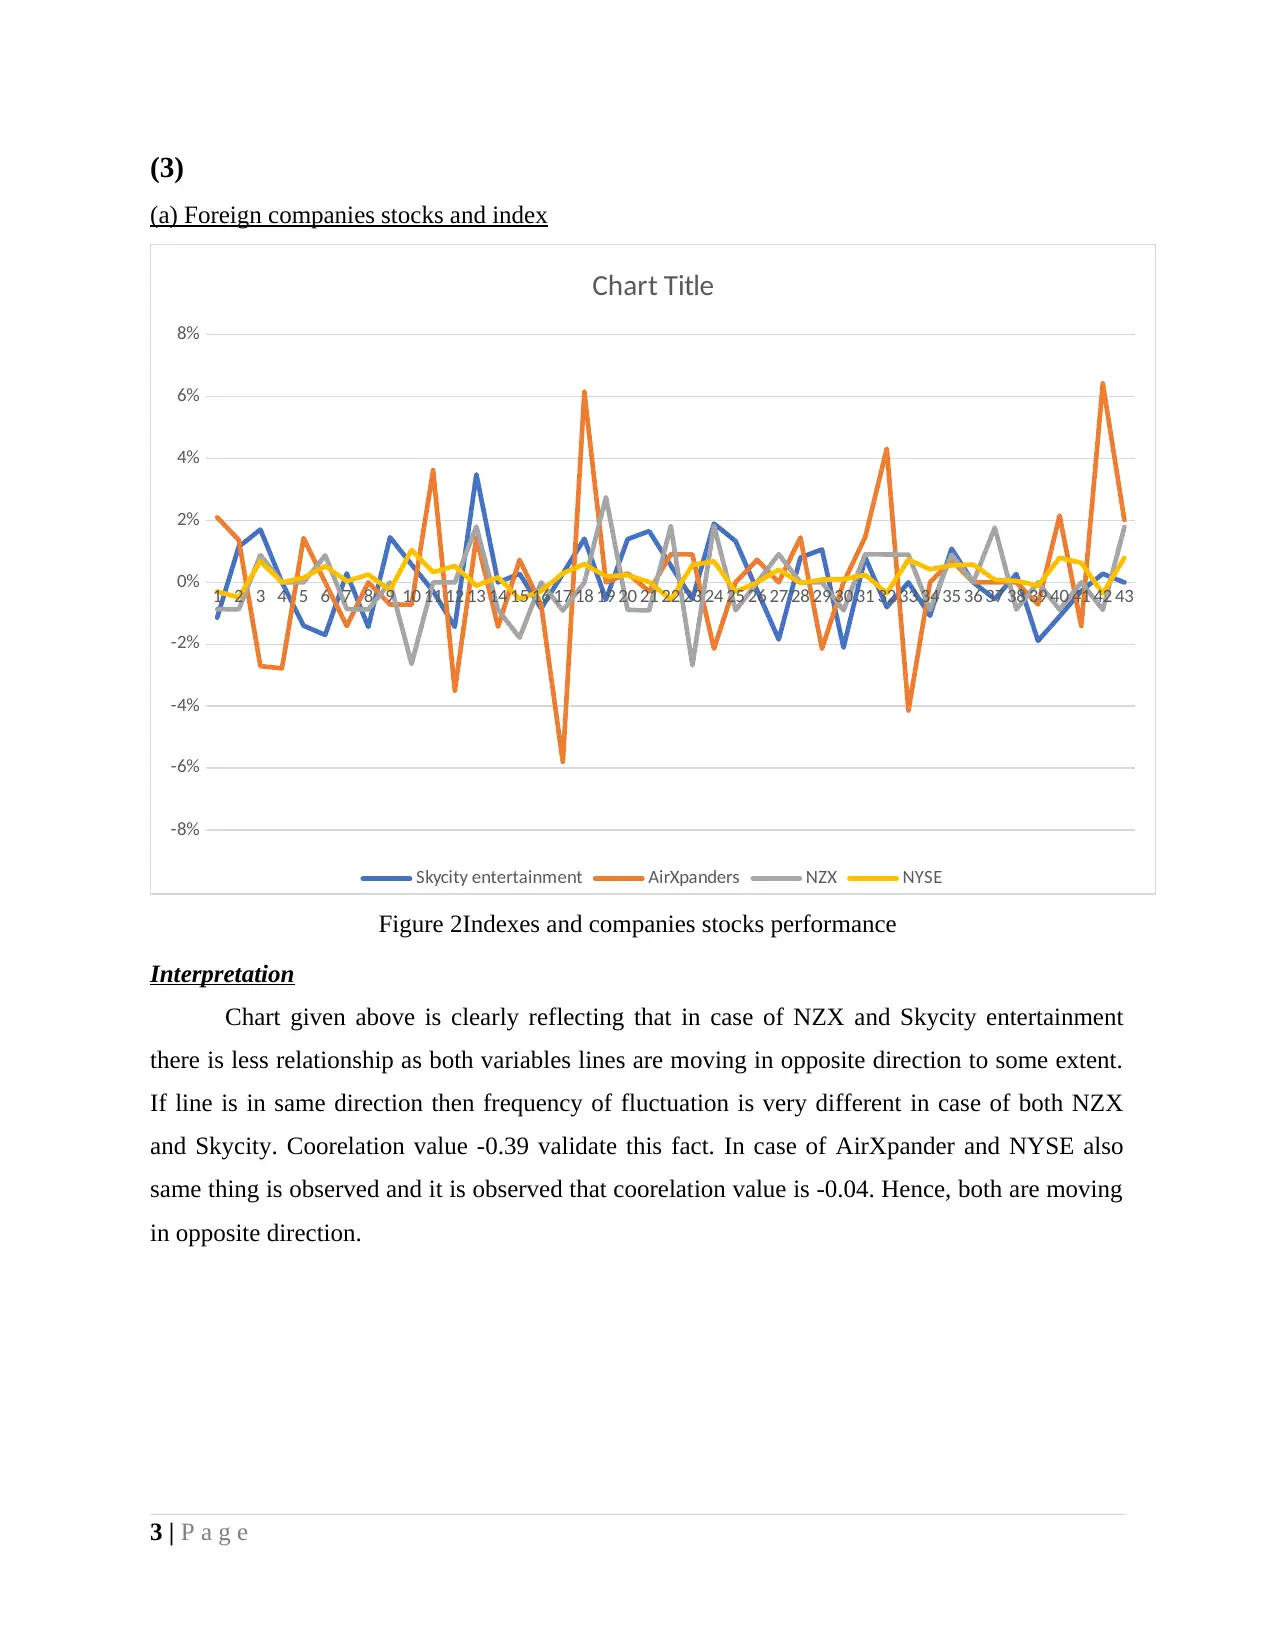
(3)
(a) Foreign companies stocks and index
1 2 3 4 5 6 7 8 9 10 11 12 13 14 15 16 17 18 19 20 21 22 23 24 25 26 27 28 29 30 31 32 33 34 35 36 37 38 39 40 41 42 43
-8%
-6%
-4%
-2%
0%
2%
4%
6%
8%
Chart Title
Skycity entertainment AirXpanders NZX NYSE
Figure 2Indexes and companies stocks performance
Interpretation
Chart given above is clearly reflecting that in case of NZX and Skycity entertainment
there is less relationship as both variables lines are moving in opposite direction to some extent.
If line is in same direction then frequency of fluctuation is very different in case of both NZX
and Skycity. Coorelation value -0.39 validate this fact. In case of AirXpander and NYSE also
same thing is observed and it is observed that coorelation value is -0.04. Hence, both are moving
in opposite direction.
3 | P a g e
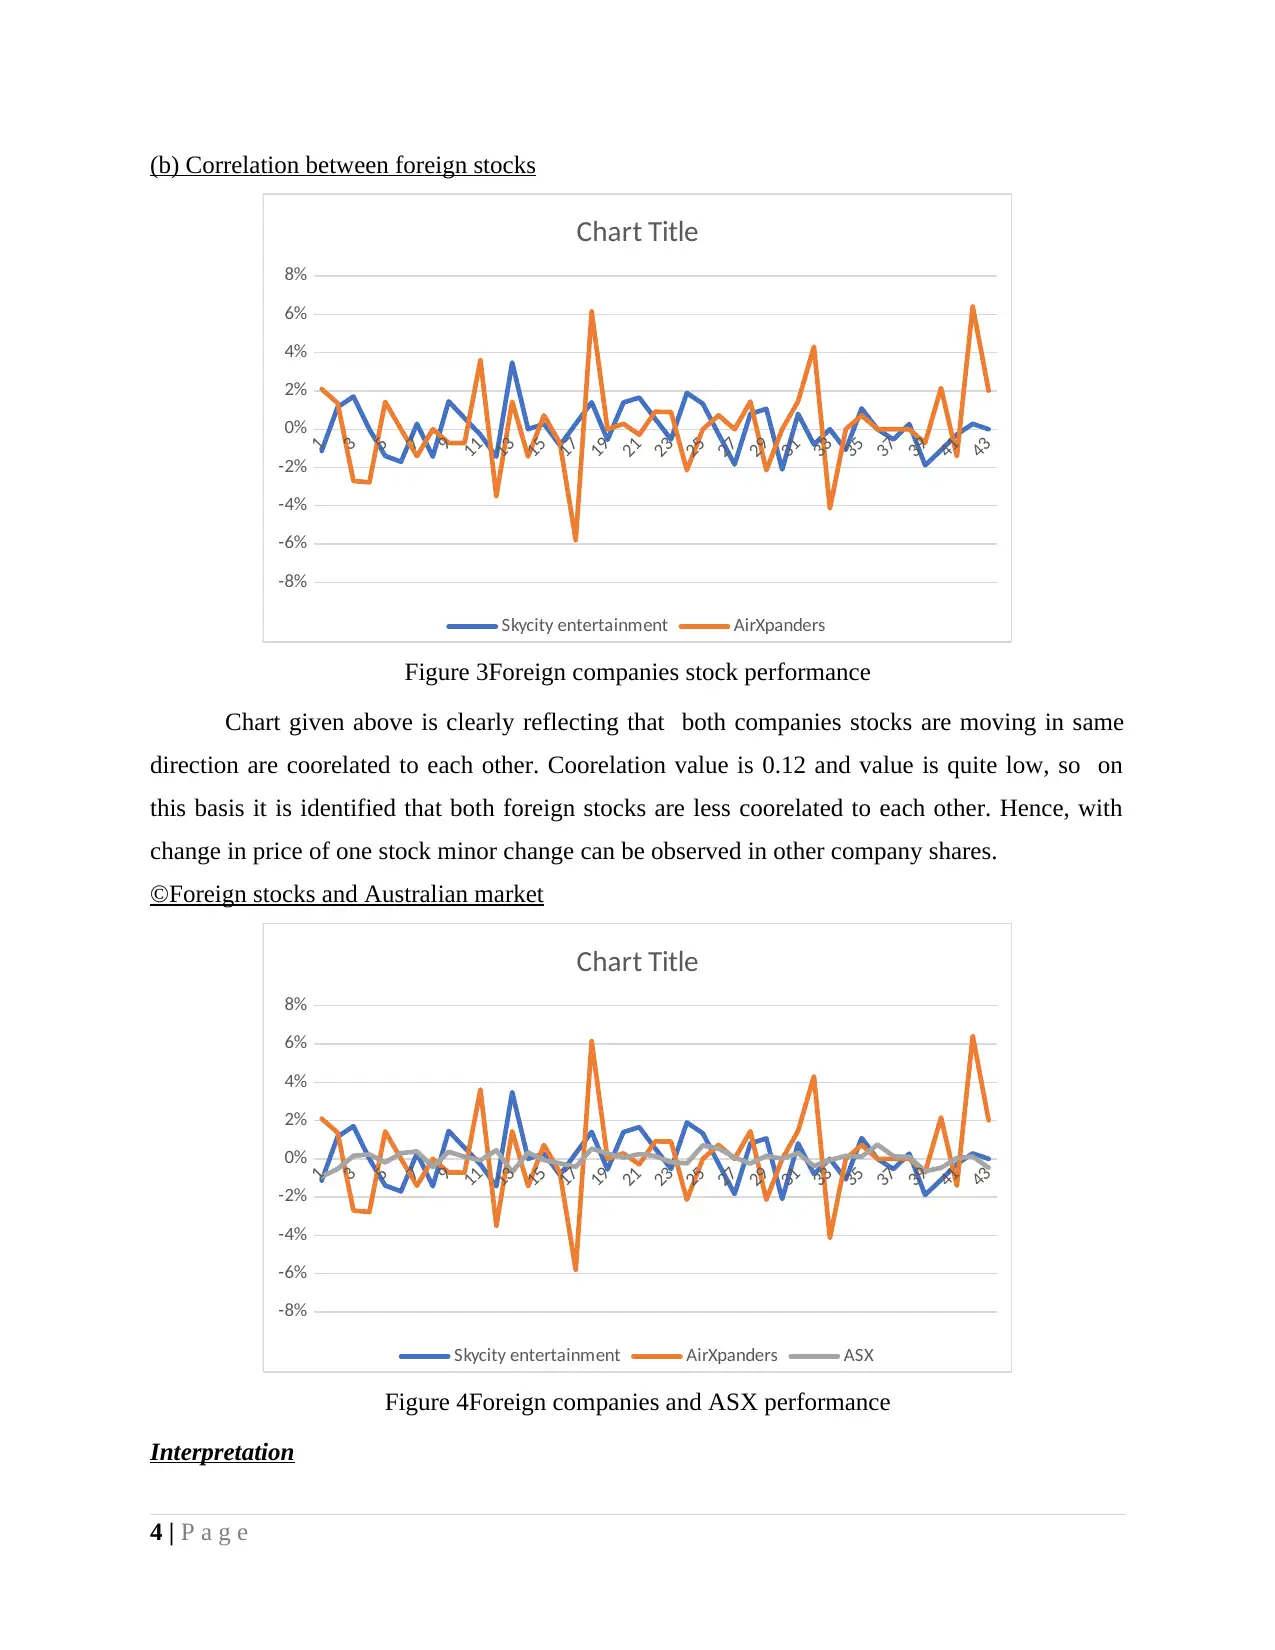
(b) Correlation between foreign stocks
1
3
5
7
9
11
13
15
17
19
21
23
25
27
29
31
33
35
37
39
41
43
-8%
-6%
-4%
-2%
0%
2%
4%
6%
8%
Chart Title
Skycity entertainment AirXpanders
Figure 3Foreign companies stock performance
Chart given above is clearly reflecting that both companies stocks are moving in same
direction are coorelated to each other. Coorelation value is 0.12 and value is quite low, so on
this basis it is identified that both foreign stocks are less coorelated to each other. Hence, with
change in price of one stock minor change can be observed in other company shares.
©Foreign stocks and Australian market
1
3
5
7
9
11
13
15
17
19
21
23
25
27
29
31
33
35
37
39
41
43
-8%
-6%
-4%
-2%
0%
2%
4%
6%
8%
Chart Title
Skycity entertainment AirXpanders ASX
Figure 4Foreign companies and ASX performance
Interpretation
4 | P a g e
1
3
5
7
9
11
13
15
17
19
21
23
25
27
29
31
33
35
37
39
41
43
-8%
-6%
-4%
-2%
0%
2%
4%
6%
8%
Chart Title
Skycity entertainment AirXpanders
Figure 3Foreign companies stock performance
Chart given above is clearly reflecting that both companies stocks are moving in same
direction are coorelated to each other. Coorelation value is 0.12 and value is quite low, so on
this basis it is identified that both foreign stocks are less coorelated to each other. Hence, with
change in price of one stock minor change can be observed in other company shares.
©Foreign stocks and Australian market
1
3
5
7
9
11
13
15
17
19
21
23
25
27
29
31
33
35
37
39
41
43
-8%
-6%
-4%
-2%
0%
2%
4%
6%
8%
Chart Title
Skycity entertainment AirXpanders ASX
Figure 4Foreign companies and ASX performance
Interpretation
4 | P a g e
⊘ This is a preview!⊘
Do you want full access?
Subscribe today to unlock all pages.
Trusted by 1+ million students worldwide

It can be seen from chart that Skycity and ASX are moving in same direction as
correlation value is 0.67. Hence, foreign company stock and ASX values are highly coorelated to
each other. On other hand, in case of AirXpander it can be observed that coorelation value is -
0.003 which means that almost there is no relationship between AirExpander and ASX
movement. It can be said that ASX have no impact on return that is generated by AirExpander
for its investors.
4 Relationship between Australia based MNC currency exposure and stock
prices
Correlation value of conversion data of NewZealand curency in Australia Dollar and
Wesfarmers is 0.62 and same in case of Caltex energy is 0.24 which is indicating that both firms
stocks and currency exchange rates are interrelated to each other. There is high degree of
relationship between Wesfarmers and currency exchange rate and it can be said that with small
flcutuation in currency exchange rate at least moderate change will come in Wesfarmer stock
price (Bollen, Mao and Zeng, 2011. In case of Caltex it can be seen that value of coorelation is
0.24 which reflect that there is less relationship between currency and stock price. Hence, with
change in currency value less change comes in price of Caltex.
5 Relationship between Foreign company stocks and currency to which they
are exposed
Correlation value is 0.59 in case of Sky entertainment and relevant currency pair which is
NZD/AUD and this reflect that both currency and company shares are moderately coorelated to
each other. On other hand, in case of AirXpander coorelation value is 0.15 which is reflecting
that both values are les correlated to each other and it can be said that change in curreny in
international market have a less impact on stock prices in respect to mentioned company (Van
Rooij, Lusardi and Alessie, 2011). So, investors who make investment in Sky entertainment need
to worry about currency exposure but investors of AirXpander does not need to think about all
these factors in their investment decisions.
5 | P a g e
Paraphrase This Document
Need a fresh take? Get an instant paraphrase of this document with our AI Paraphraser
REFERENCES
Books and Journals
Bollen, J., Mao, H. and Zeng, X., 2011. Twitter mood predicts the stock market. Journal of
computational science. 2(1). pp.1-8.
Hameed, A., Kang, W. and Viswanathan, S., 2010. Stock market declines and liquidity. The
Journal of Finance. 65(1). pp.257-293.
Van Rooij, M., Lusardi, A. and Alessie, R., 2011. Financial literacy and stock market
participation. Journal of Financial Economics. 101(2). pp.449-472.
6 | P a g e
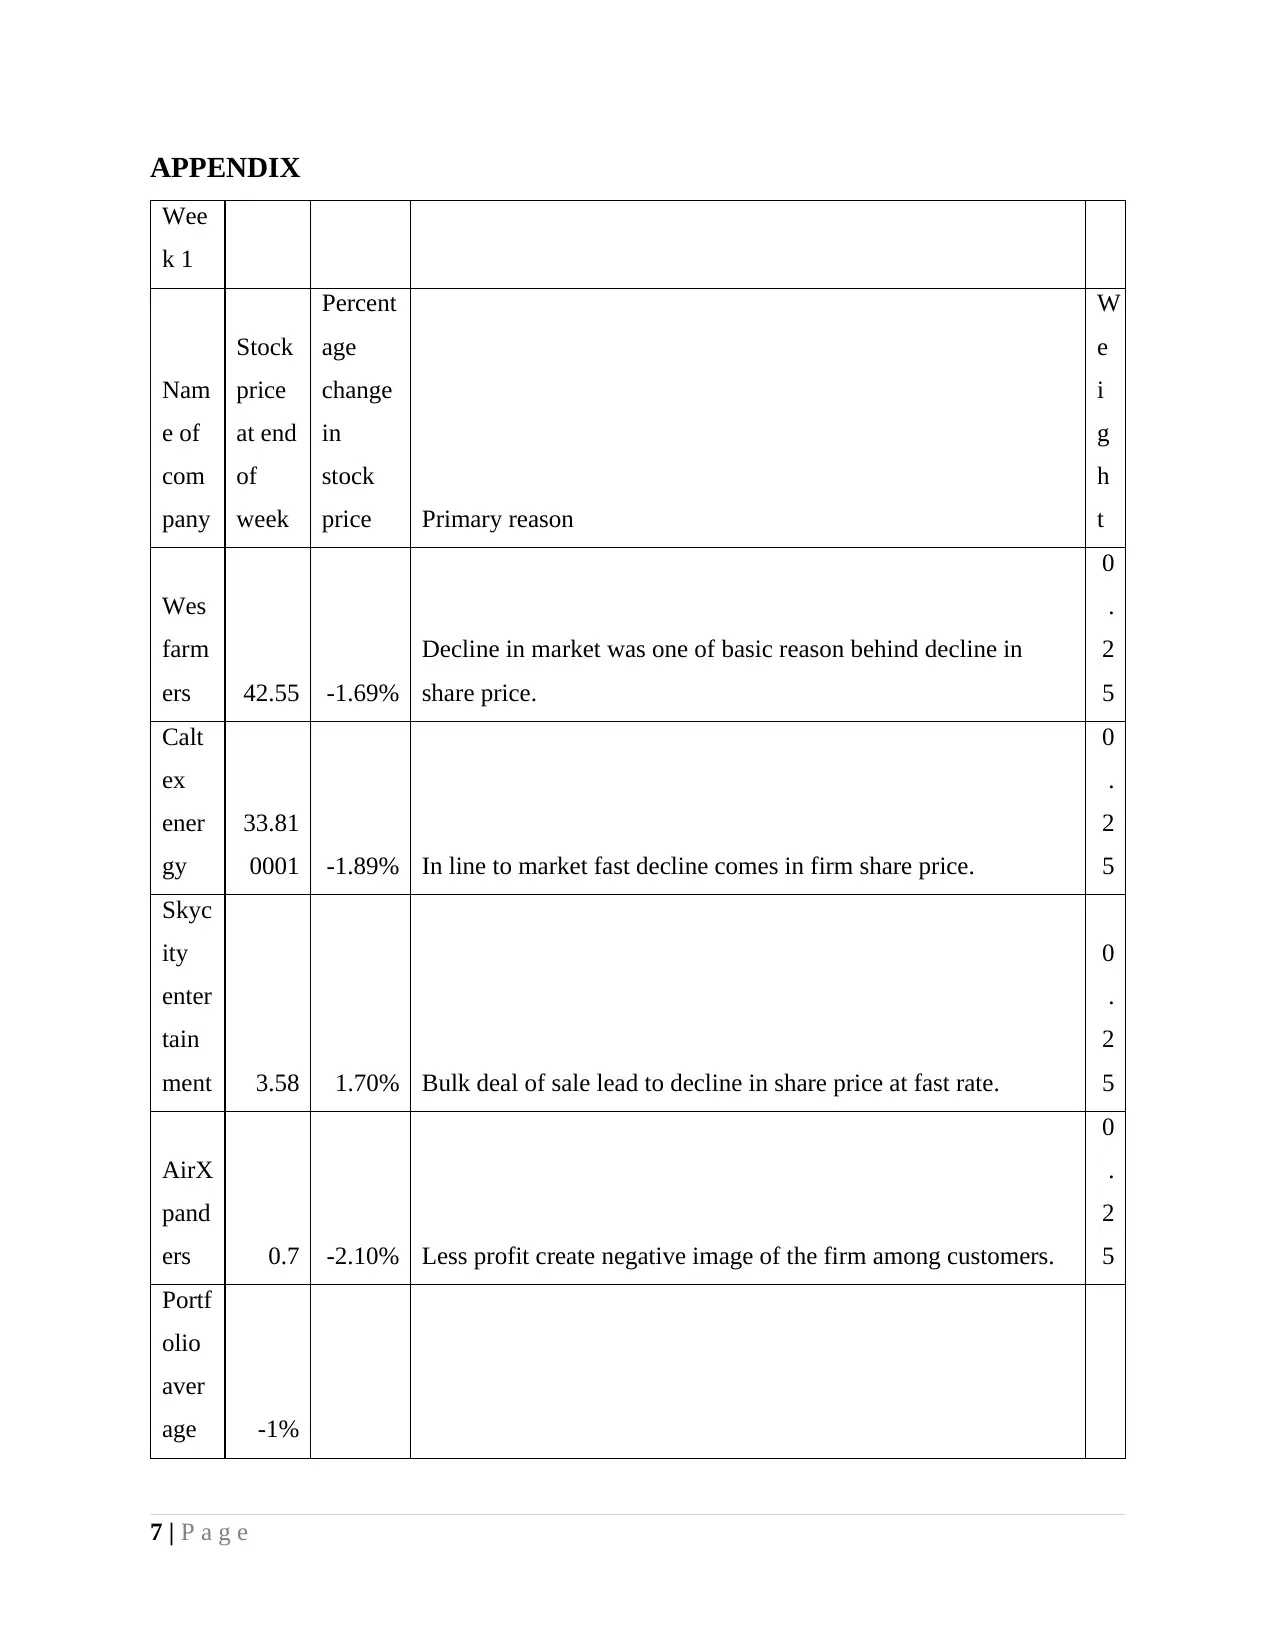
APPENDIX
Wee
k 1
Nam
e of
com
pany
Stock
price
at end
of
week
Percent
age
change
in
stock
price Primary reason
W
e
i
g
h
t
Wes
farm
ers 42.55 -1.69%
Decline in market was one of basic reason behind decline in
share price.
0
.
2
5
Calt
ex
ener
gy
33.81
0001 -1.89% In line to market fast decline comes in firm share price.
0
.
2
5
Skyc
ity
enter
tain
ment 3.58 1.70% Bulk deal of sale lead to decline in share price at fast rate.
0
.
2
5
AirX
pand
ers 0.7 -2.10% Less profit create negative image of the firm among customers.
0
.
2
5
Portf
olio
aver
age -1%
7 | P a g e
⊘ This is a preview!⊘
Do you want full access?
Subscribe today to unlock all pages.
Trusted by 1+ million students worldwide
Wee
k 2
Nam
e of
com
pany
Stock
price
at end
of
week
Percent
age
change
in
stock
price Primary reason
W
e
i
g
h
t
Wes
farm
ers
43.20
9999 2%
Fresh investment by foreign investors in Australia stock market
lead to increase in ASX 200 index which ensue traction in share
price
0
.
2
5
Calt
ex
ener
gy
34.90
0002 3% FII investment increase ensue elevation in share price.
0
.
2
5
Skyc
ity
enter
tain
ment 3.48 -1% Poor market performance lead to decline in share price.
0
.
2
5
AirX
pand
ers 0.695 -2% Same negative perception remain continue.
0
.
2
5
Portf
olio
aver
age
0.27
%
Wee
8 | P a g e
Paraphrase This Document
Need a fresh take? Get an instant paraphrase of this document with our AI Paraphraser
k 3
Nam
e of
com
pany
Stock
price
at end
of
week
Percent
age
change
in
stock
price Primary reason
W
e
i
g
h
t
Wes
farm
ers
43.88
9999 2%
Investors consistently hold confidence on company share and
believe on impetus of stock index performance on company
shares.
0
.
2
5
Calt
ex
ener
gy 35 1%
Positive sentiments among investors about growth of energy
sector lead to increase in share price.
0
.
2
5
Skyc
ity
enter
tain
ment 3.56 2% Due to increase in index value share price also increase.
0
.
2
5
AirX
pand
ers 0.69 0% Same as of week 2.
0
.
2
5
Portf
olio
aver
age
1.14
%
Wee
k 4
9 | P a g e
Nam
e of
com
pany
Stock
price
at end
of
week
Percent
age
change
in
stock
price Primary reason
W
e
i
g
h
t
Wes
farm
ers 43.98 0.14%
Consistent better performance ensue stock selling in stock
exchange.
0
.
2
5
Calt
ex
ener
gy
34.04
0001 -4% Bulk deal of sale lead to decline in share price at fas rate.
0
.
2
5
Skyc
ity
enter
tain
ment 3.58 0.28%
Investors in order to book profit consistently make purchase of
shares and lead to increase in 0.28%.
0
.
2
5
AirX
pand
ers 0.69 -1% Past weeks trend remain continue in the market.
0
.
2
5
Portf
olio
aver
age
-
1.10
%
Wee
k 5
Nam Stock Percent Primary reason W
10 | P a g e
⊘ This is a preview!⊘
Do you want full access?
Subscribe today to unlock all pages.
Trusted by 1+ million students worldwide
1 out of 18
Related Documents


Your All-in-One AI-Powered Toolkit for Academic Success.
+13062052269
info@desklib.com
Available 24*7 on WhatsApp / Email
![[object Object]](/_next/static/media/star-bottom.7253800d.svg)
Unlock your academic potential
Copyright © 2020–2026 A2Z Services. All Rights Reserved. Developed and managed by ZUCOL.