Weka Analysis and Report: Data Science Module, Semester 1

Verified

Added on  2022/09/18

|7
|422
|34
Report
AI Summary
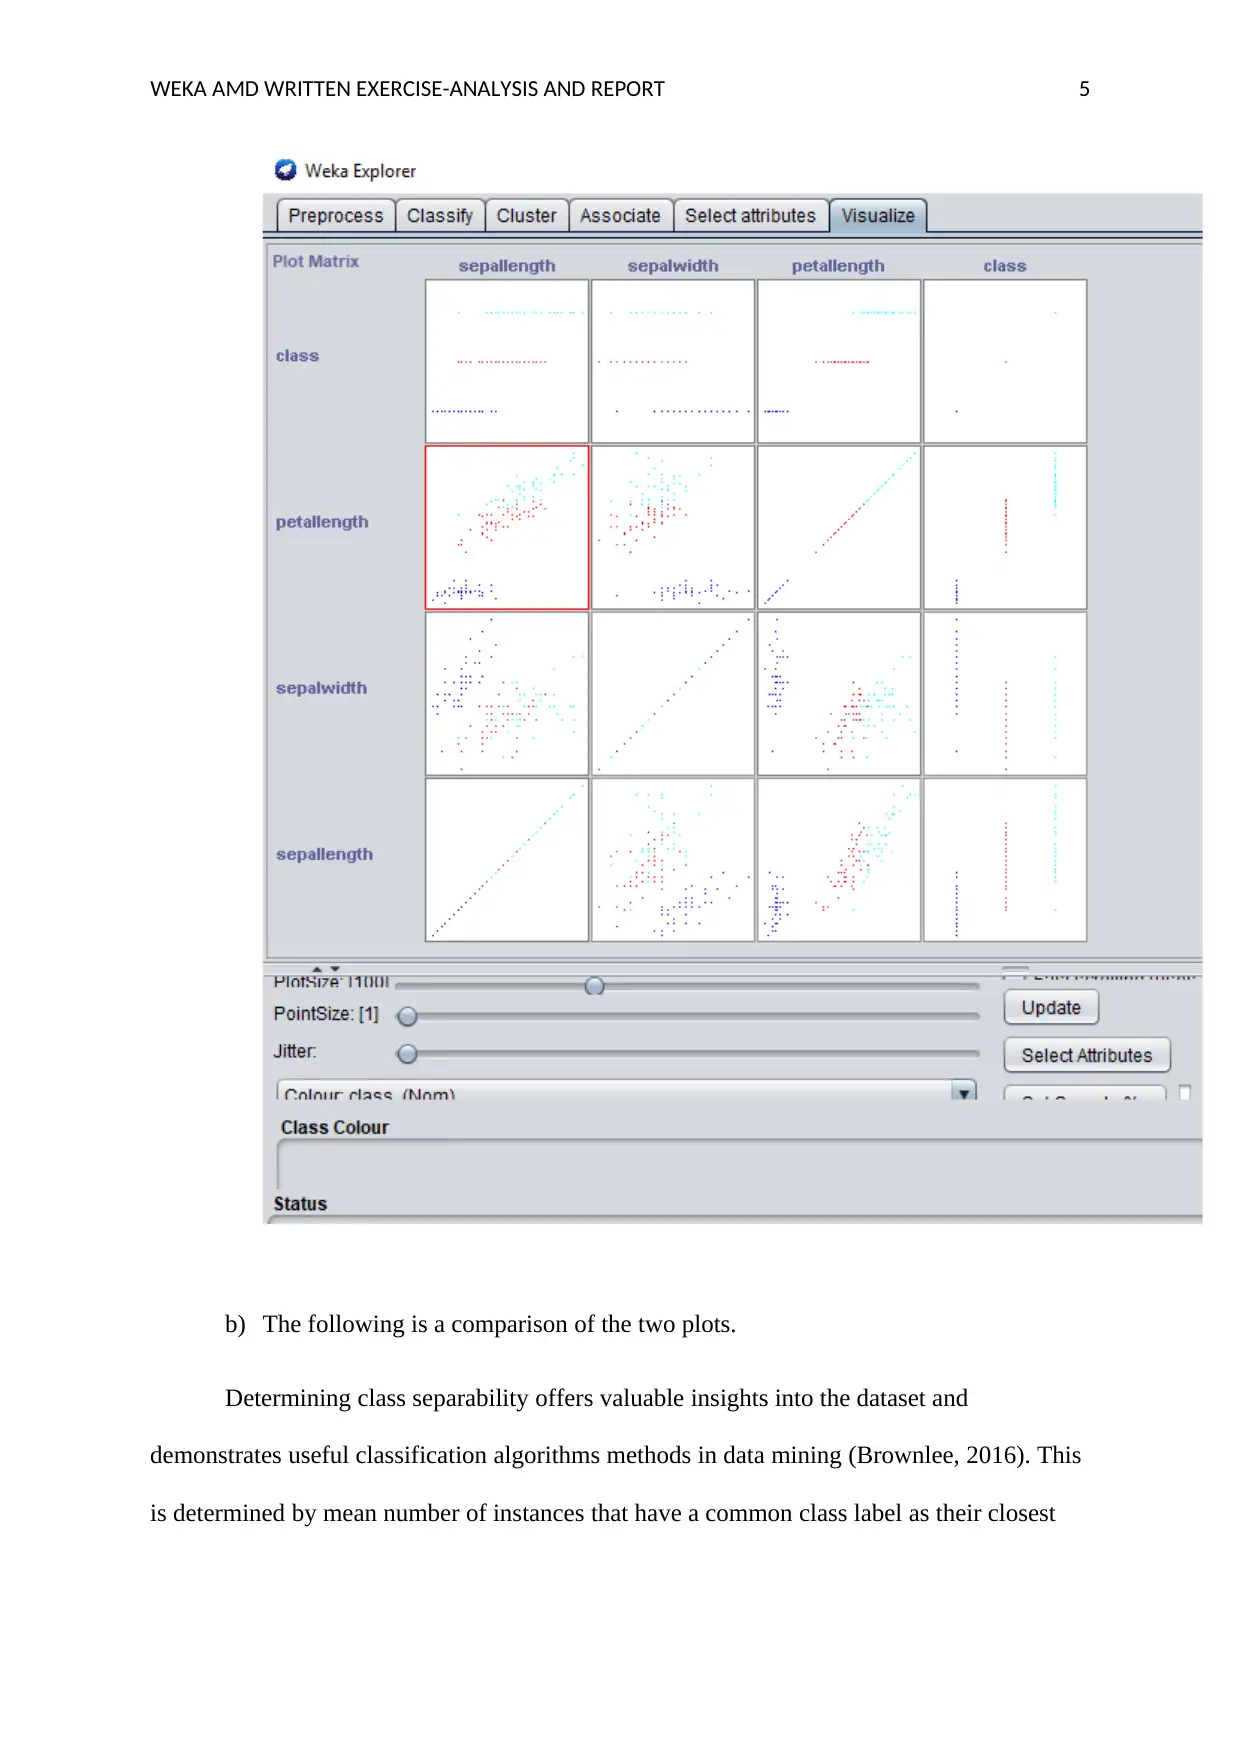
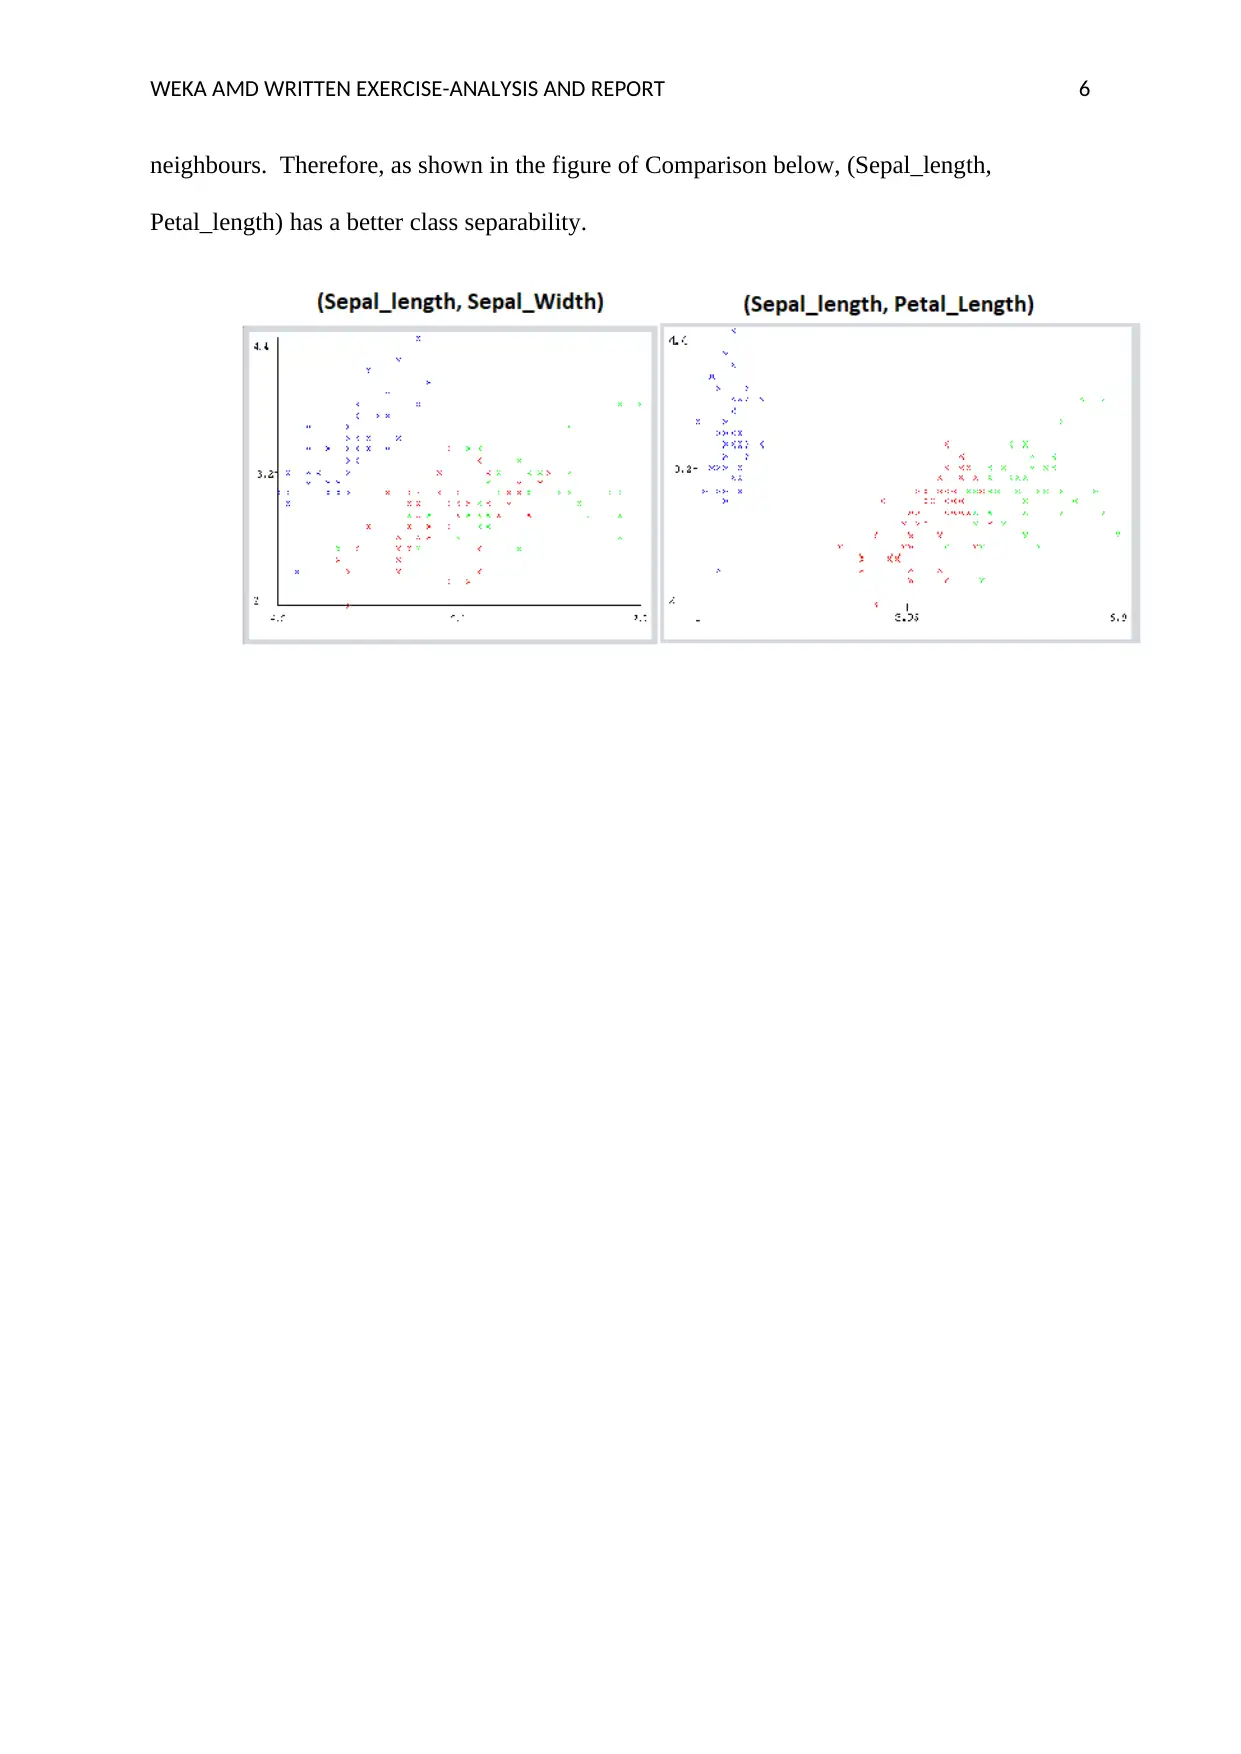
This report presents an analysis of a dataset using the Weka data mining software. The report begins with an overview of the dataset, including the number of instances, attributes, and classes. It then explores the attributes, visualizing the data using histograms and scatter plots. The analysis includes the removal of an attribute and the subsequent impact on the dataset. The report discusses class separability, demonstrating how different attributes contribute to the ability to distinguish between classes. The report also provides references to relevant literature on data mining and Weka. The analysis covers data exploration, attribute analysis, and data visualization techniques to derive meaningful insights from the dataset, and it concludes with a comparison of different plots and their effectiveness in representing the data.
Document Page
Running head: WEKA AMD WRITTEN EXERCISE-ANALYSIS AND REPORT 1
Weka and Written Exercise: Analysis and Report
Student’s Name
Institution
Date
tabler-icon-diamond-filled.svg

Paraphrase This Document

Need a fresh take? Get an instant paraphrase of this document with our AI Paraphraser
Document Page
WEKA AMD WRITTEN EXERCISE-ANALYSIS AND REPORT 2
Weka and Written Exercise: Analysis and Report
Task 1: Weka Data Exploration
a) According to Smith (2015), instances are the individual independent examples of
kinds of things that can be learned from a dataset. On the contrary, attributes are
measuring aspects of an instances. As demonstrated below, the dataset has 768
instances and 9 attributes.
b) A class in a dataset represents a group of values is classified for analysis and
generation of frequency distribution ( Boels, Bakker, Wim , & Drijvers, 2016). Based
on Weka output shown below, the dataset has two classes: tested_negative and
tested_positive with 500 and 268 instances, respectively.
c) The dataset has 13 age groups with largest having 267 samples and smallest having 1
sample. Therefore, as shown below, the age group with the highest number of samples
is [21, 25,615].
Task 2: Working with a new Data File in Weka
Document Page
WEKA AMD WRITTEN EXERCISE-ANALYSIS AND REPORT 3
a) After removal of petal_width attribute, the following is an overview of the iris.3D.rff
dataset:
b) The screenshot below shows histograms with default setting for each attribute in the
new dataset:
Document Page
WEKA AMD WRITTEN EXERCISE-ANALYSIS AND REPORT 4
Task 3: Visual Analysis
a) Loading the iris.3D.arff file and creating scatter plots, the following is a 2D
visualisation from Weka:
tabler-icon-diamond-filled.svg

Paraphrase This Document

Need a fresh take? Get an instant paraphrase of this document with our AI Paraphraser
Document Page
WEKA AMD WRITTEN EXERCISE-ANALYSIS AND REPORT 5
b) The following is a comparison of the two plots.
Determining class separability offers valuable insights into the dataset and
demonstrates useful classification algorithms methods in data mining (Brownlee, 2016). This
is determined by mean number of instances that have a common class label as their closest
Document Page
WEKA AMD WRITTEN EXERCISE-ANALYSIS AND REPORT 6
neighbours. Therefore, as shown in the figure of Comparison below, (Sepal_length,
Petal_length) has a better class separability.
Document Page
WEKA AMD WRITTEN EXERCISE-ANALYSIS AND REPORT 7
References
BIBLIOGRAPHY Boels, L., Bakker, A., Wim , D. V., & Drijvers, P. (2016, July). Students’ interpretations
of histograms: a review. Retrieved from Research Gate:
https://www.researchgate.net/publication/306290864_Students'_interpretations_of_histog
rams_a_review
Brownlee, J. (2016, June 30). How to Better Understand Your Machine Learning Data in
Weka. Retrieved from Machine Learning :
https://machinelearningmastery.com/better-understand-machine-learning-data-weka/
Smith, T. C. (2015). Data Mining Part 2. Hamilton: The University of Waikato.
chevron_up_icon
1 out of 7
circle_padding
hide_on_mobile
zoom_out_icon
[object Object]