Data Mining Project: WEKA Analysis of Breast-cancer, Diabetes, Iris

Verified

Added on  2022/09/28

|13
|1214
|16
Project
AI Summary
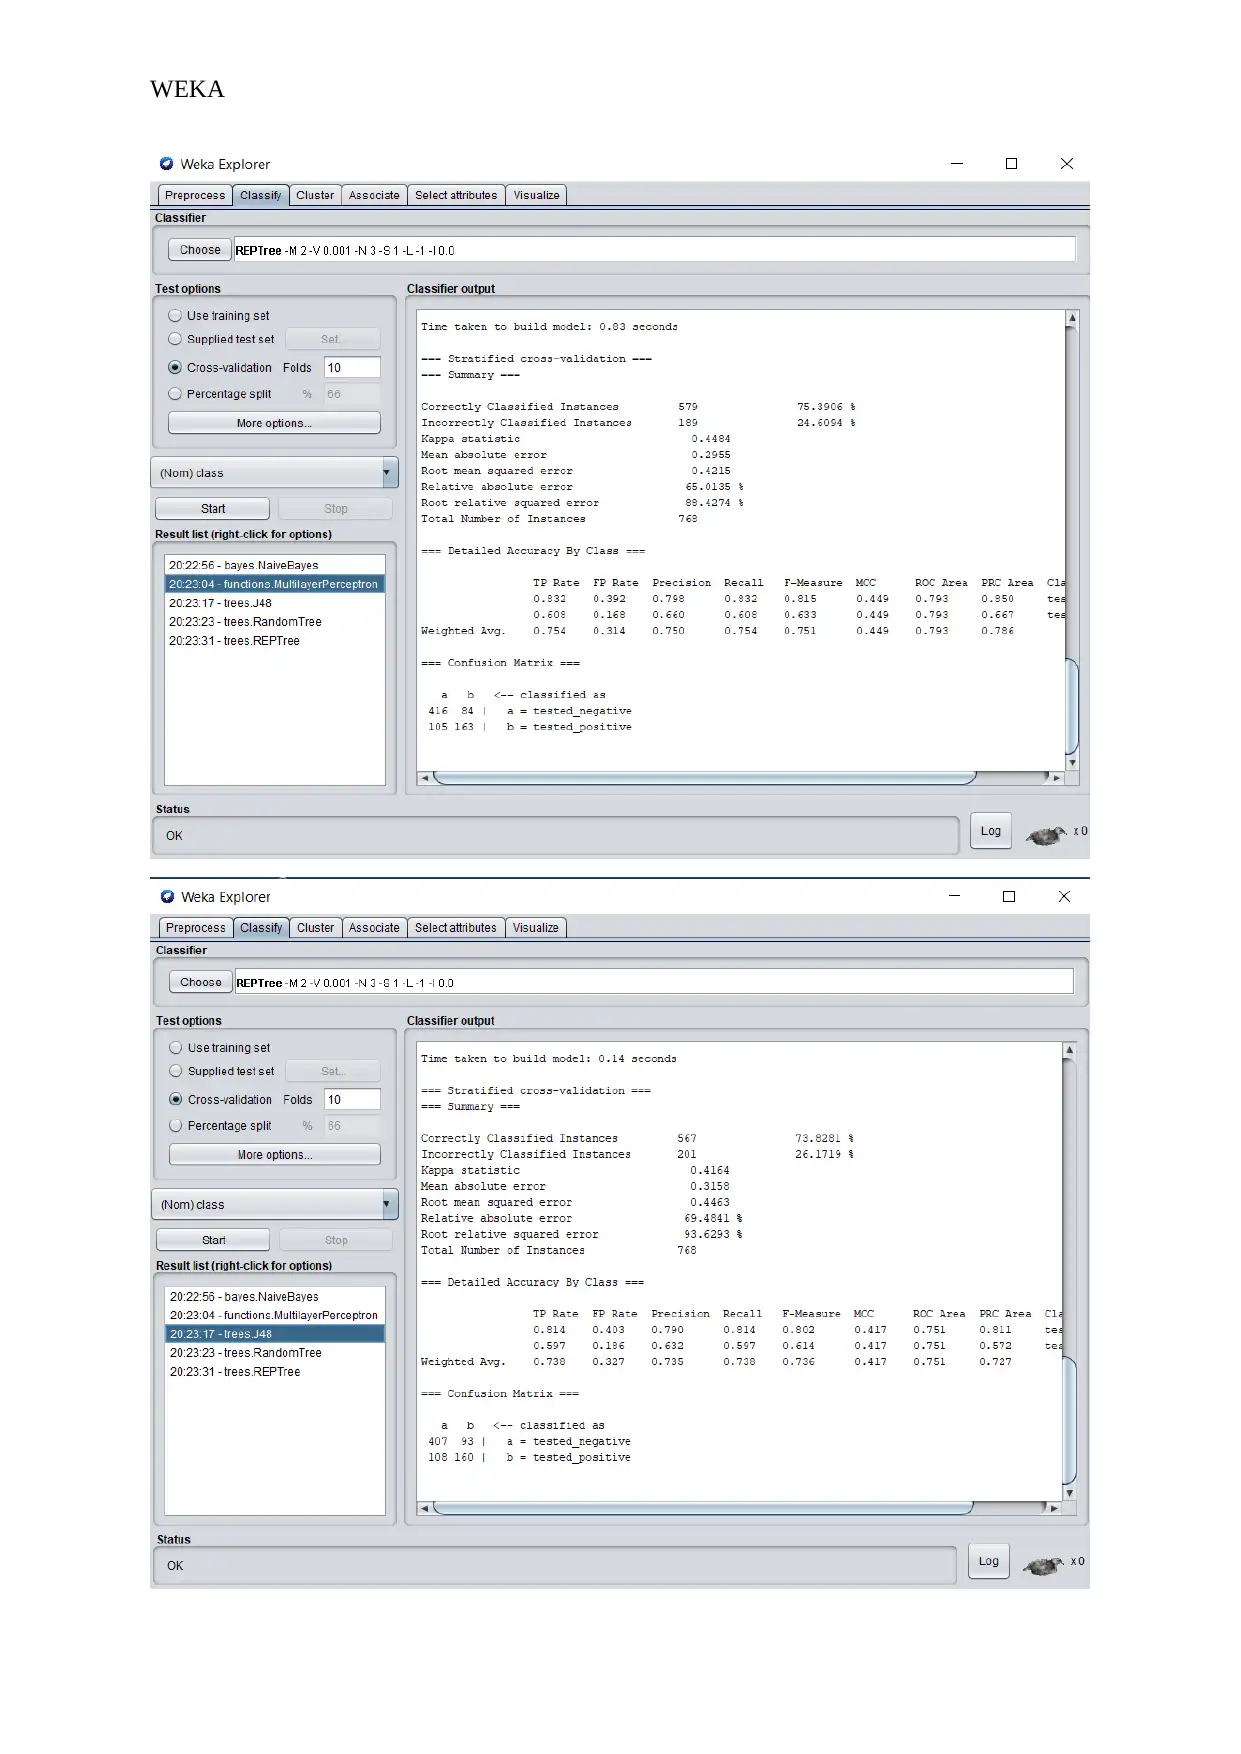
This project evaluates the performance of five classification algorithms (Multilayer Perceptron, Naive Bayes, J48, Random Forest, and REPTree) on three datasets: Breast-cancer, Diabetes, and Iris. The analysis uses WEKA with default settings and 10-fold cross-validation. The study focuses on key performance metrics, including correctly and incorrectly classified instances, kappa statistics, true and false positive rates, precision, recall, F-measure, and ROC area. The results show varying performance across datasets, with the Iris dataset generally yielding the best results. The report highlights how the performance of algorithms varies depending on the dataset and the importance of considering multiple evaluation metrics beyond simple classification accuracy. The project provides insights into the variability and flexibility inherent in data science applications.
Document Page
Running Head: WEKA
TOPIC
NAME OF STUDENT
DATE
tabler-icon-diamond-filled.svg

Paraphrase This Document

Need a fresh take? Get an instant paraphrase of this document with our AI Paraphraser
Document Page
WEKA
INTRODUCTION
The number of models that are supposed to be tested on three different datasets
is five in number and they are Multilayer Perceptron, Naïve Bayes, J48, Random
Forest and REPTree. The models are to be run using the default settings that
have been set there and through 10 folds. The data sets for which performance
are to be tested are Breast-cancer, Diabetes and Breast datasets. In the
evaluation of the performance of the five algorithms on the three datasets, there
will be key areas that will be considered in the analysis results interpretation
report. The areas to be focussed on will be; correctly classified instances (with
the percentage), incorrectly classified instances, kappa statistics, true and false
positive rate, precision, recall, F-measure and ROC (Receiver Operator
Characteristic) area. As we start, it is important that we cannot just rely on the
performance percentages of the model as an evaluation criterion. The reason for
this is because we can have a high percentage of correctly classified instances
but yet the model classifies the instances in only one class and leave the other
classes without any classification. Therefore, there must also be a look into the
confusion matrix and the rest. Just to give a brief meaning of what will be looked
into, we first start with the Kappa statistics and this gives the percentage rate of
being right when a random variable is picked and is supposed to be classified.
What shows that we would be right most of the time is how far the kappa value
is far from 0, and the closer the value is to 1 the more right we are supposed to
be as we tend to do classification. The true positive rate (TP Rate) shows the
ratio of the correctly classified instances and the closer the value is to 1 the
better the classification. The false-positive rate (FP Rate) should be closer to zero
(0) as this entirely gives the false classifications that were classified as true and
so the lower their probabilistic classification value the lower the false
classification and the better the model (Jabez et al. 2019). F-measure is an
Document Page
WEKA
average of precision and recall, values that are gotten from the confusion matrix
that is developed from every classification algorithm developed. The ROC is the
area under the curve and the curve, in this case, is the classification model curve
that the classification model develops. The greater the ROC area value is, and
the closer it is to 1 the higher the variability of the instances and this translates
to.
DATA MININNG AND MACHINE LEARNING
a. Breast-cancer
Document Page
WEKA
tabler-icon-diamond-filled.svg

Paraphrase This Document

Need a fresh take? Get an instant paraphrase of this document with our AI Paraphraser
Document Page
WEKA
Document Page
WEKA
Starting at the evaluation of the performance of different algorithms that were used in classification,
there was a look into the breast cancer dataset which had up to 286 instances. The percentages of
the correctly classified instances summed up to over 60% but all the models did not perform at their
best as the kappa statistic and the false-positive values closer to zero and father from zero
respectively indicating that the models are very poor. The best performing model in all of the models
used for classification, in this case, is J48 and the poorest model, in this case, is the multilayer
perceptron. Form this there is a clear indication of how there are more instances that are
misclassified in most of the models including the best performing model even though the
classification is poorer on the least performer.
b. Diabetes
Document Page
WEKA
tabler-icon-diamond-filled.svg

Paraphrase This Document

Need a fresh take? Get an instant paraphrase of this document with our AI Paraphraser
Document Page
WEKA
Document Page
WEKA
Moving to the Diabetes dataset, there will be a realization that there is an improvement of the
model's performing on the Diabetes dataset. The correctly classified instances percentage goes up
from just over 60% in breast-cancer dataset models to over 70% with only one model at 68%. The
Kappa statistic values are closer to 0.5 and this is like closeness to 50% of being right when making
classifications. There is a fall in the FP rate to 0.3 and a rise in TP to mostly 0.7 indicating a clear
improvement in the performance of the models this time on the Diabetes dataset. There are more
correctly classified instances as compared to the total number of instances recorded for
classification. The F-Measure and the ROC Area have higher values and at 0.748 and 0.766
respectively indicating there are minimal misclassifications. Naïve Bayes is the best model in
classification and Random Forest is the least performing model and at 68%.
c. Iris
Document Page
WEKA
tabler-icon-diamond-filled.svg

Paraphrase This Document

Need a fresh take? Get an instant paraphrase of this document with our AI Paraphraser
Document Page
WEKA
Document Page
WEKA
The Iris dataset gives the best of performance on the classification of the algorithms that were used
for classification. With the Iris dataset, there are very high kappa statistic values, as well as the TP
rate and they, stand at above 0.9 in each case. Very low values for FP rate which is very close to zero
and this indicates very few instances that were incorrectly classified. A farther indication comes in at
the confusion matrix where more instances are classified under their respective variable columns.
The ROC area and the F-measure stand at above 0.9 each, indicating that there are best of
classification from the models. Even so, there must be a poorer performing model from the list. The
best performing model, in this case, is the Multilayer Perception at 97% and the least performing
model is random forest and is at 92% (David et al. 2019).
CONSLUSION
According to the realized results, one is bound to realize that there are different datasets that give
different performance in terms classification models. This is clearly evident as you find Iris dataset
having variables that actually perform way better than the diabetes dataset and the breast cancer
dataset. The variables themselves change in accuracy from one dataset to the next dataset, and this
alone shows that there is variability and flexibility in the field of data science (Bravo-Marquez et al.
2019).
chevron_up_icon
1 out of 13
circle_padding
hide_on_mobile
zoom_out_icon
[object Object]