Business Analysis Report: Data Mining with WEKA Tool for Loan Data

Verified

Added on  2020/05/08

|6
|1882
|203
Report
AI Summary
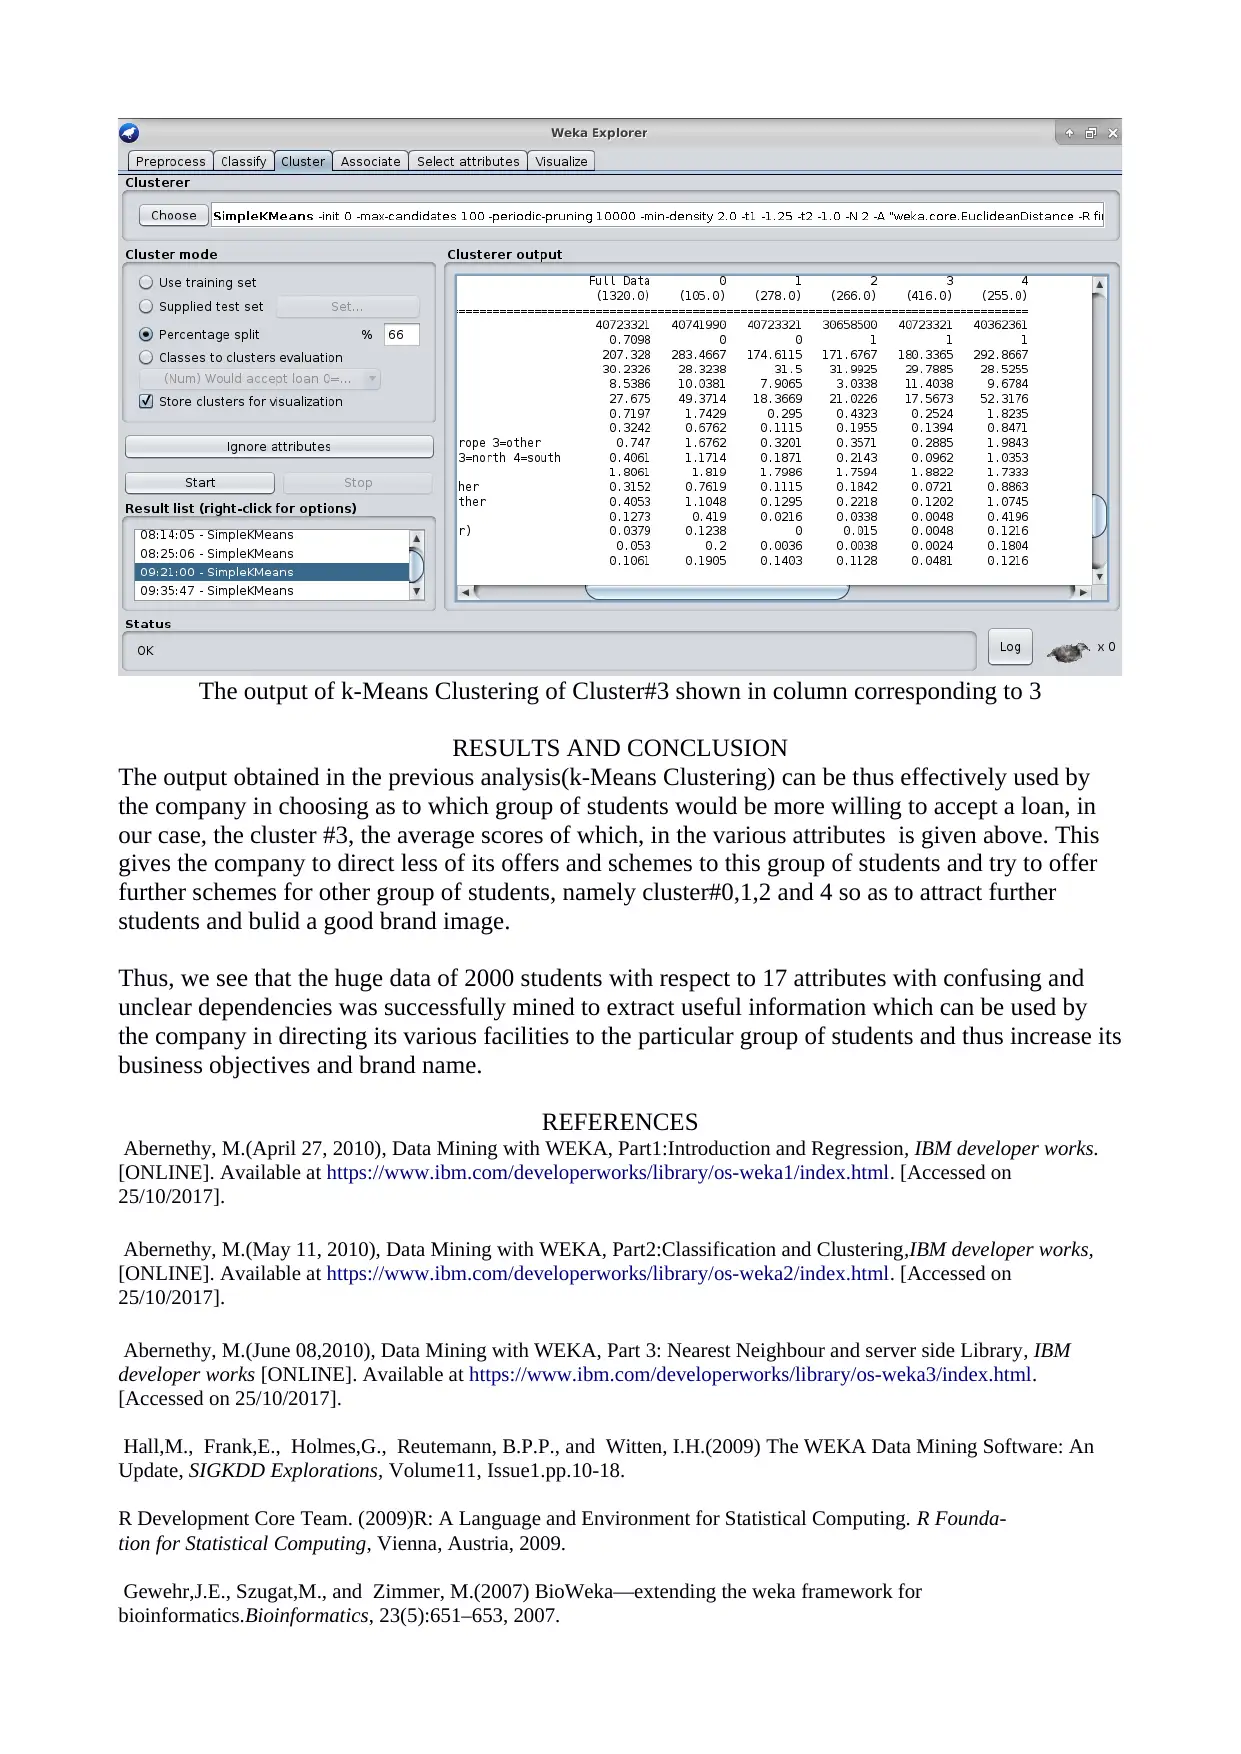
This report presents a business analysis of student loan data using the WEKA data mining tool. It begins with an introduction to data mining concepts, including directed and undirected approaches, and explains various techniques like descriptive statistics, cluster analysis, and classification. The report then details the data visualization and preprocessing steps, highlighting the challenges of interpreting scatter plots with categorical variables. The core of the report focuses on choosing an appropriate data mining model, discussing the suitability of linear regression, decision trees, k-means clustering, and k-Nearest Neighbors. The report describes the generation of test designs, splitting the data into training and testing sets, and presents the results of applying decision tree, k-Means Clustering, and k-Nearest Neighbors algorithms. The report concludes that k-Means Clustering provides the most interpretable model for the dataset. The model identified Cluster #3 as having a high affinity for accepting loans, and this information can be used to refine loan offering strategies. The report includes references to relevant academic and technical resources.
Document Page
BUSINESS ANALYSIS REPORT USING WEKA TOOL
INTRODUCTION
In this project, we create a business analysis report, typically a data mining report, on the set
of data for the company that is engaged in providing loans to students studying for their
degrees in Universities. The tool used to mine the data is the WEKA tool, an open source tool
from the University of Waikato, New Zealand. We analyse the different parameters of the
data using the tool and make a brief report of the same.
Keywords:Business Analysis, WEKA, Data mining, Data Analysis
DATA MINING BASICS
Data Mining is the process of extracting useful information from a set of data using statistical
procedures and techniques that helps us to better understand the data quantitatively as well
qualitatively. This helps us make useful decisions regarding the outputs associated with the data,
like improving the Business output, reducing necessary costs or resources, efficient manangement
tof the processes involved, etc. Data Mining could be classified into broadly two types-Directed,
and , Undirected. In Directed Data Mining, we try to predict the outcome of a particular variable
vis-a-vis other parameters and factors; whereas in Undirected Data Mining, we try to predict
general patterns and interrelationships amongst the variables or quantities. The techniques used to
do both these types of analyses are various, amongst them, a few primary and important ones would
be, for example, descriptive statistics(Box Plot, Histogram, Bar plot, Scatter plot, Pie chart etc.),
Cluster Analysis(k-means clustering, hierarchial clustering), Classification(Nearest Neighbours,
Naive-Bayes, Decision trees, Loistic Regression), ANOVA, ANCOVA etc. In this project, we try to
perform both types of Data Mining to build useful conclusions.
DATA VISUALIZATION AND PREPROCESSING
In the first step, we look at the data visualization. The WEKA tool (Hall,M., Frank,E., Holmes,G.,
Reutemann, B.P.P., and Witten, I.H. 2009) plots the scatter matrix for all the 17 attributes against
each other which can be seen partially in the below screenshot:
Partial plot description in WEKA Tool
As we can see, there are a lot of plots to consider, and some are nominal or categorical variables,
thus, the descriptive plotting dosent give us much explanation and description of the data on hand.
tabler-icon-diamond-filled.svg

Secure Best Marks with AI Grader

Need help grading? Try our AI Grader for instant feedback on your assignments.
Document Page
Though it may tell us some dependencies and interrelationships amongst the variables, the
description is insufficient to predict anything conclusively for the company. Hence, apriori, we
cannot neglect any attribute for further analysis and consider all the attributes for further analysis.
CHOOSING A DATA MINING MODEL
The process of choosing an appropriate data mining model is very crucial as it is the one main step
that decides the effectiveness of the decisions and conclusions made from the data. Among the
various classification and mining methods like Linear Regression, Multiple Linear Regression,
Logistic Regression, Naive- Bayes Classification, Decision tree modeling, k-Nearest Neighbour
Modeling, k-Means Clustering, Principal Component Analysis, four deserve special mention
because of their wide applicability in our case and ease of understanding the algorithm.
( Abernethy,M.. April 27, 2010), (Deng,H.; Runger, G.; Tuv, E. 2011) The first, and most common
used is linear regression. This is the algorithm which does a simple prediction of the value of a
dependent variable(numerical) on the basis of the data on independent variable(s).This is useful, in
say predicting the price of a typical commodity or the rate of a gadget etc. The next useful data
mining technique that desrves mention is the decision tree classification. (Abernethy,M.. May 11,
2010)This algorithm works by creating a tree of dependencies between the various
nodes(independent variables) and chooses the best outcome using the greedy algorithm in giving us
an estimate for possiblity for the independent variable, which is typically a binary nominal variable.
This is useful in say, for example, to decide whether a person would buy a gadget given a data set
on the record of customers buying the gadget with respect to their age, gender , qualifications etc.
The last two data mining techniques that we would focus on, are k-means Clustering and k-Nearest
Neighbours. (Abernethy,M. June 08, 2010). Whereas the former technique is useful in clustering or
grouping the data set into useful patterns which help us to predict the most important attributes from
several attributes affecting the dependent variable; the latter is a combination of both the
classification and clustering, which helps us predict the closeness, or the extent of dependency of a
certain group of data with respect to other data. In our present case, since we are intersted in
determing wheter a student accepts a loan or not from the comapny, which is categorical variable,
therefore we have to go for clustering and/or classification techniques like Decision trees or k-
Nearest Neighbours algorithm. We perform all the three analyses, the random tree, k-Means
Clustering and k-Nearest Neighbours respectively, and choose the best one according to its errors
and outputs for our data set. The linear regression is unsuitable for our purpose, as we are mainly
interested in the outcome of the categorical binary variable of the student accepting or rejecting a
loan.
GENERATING TEST DESIGN
In order to build the model, we split the data into trianing and testing sets with 66% of data into the
training set and the remaining into the test dataset. This is performed using WEKA tool’s inbuilt
splitting mechanism. Now, we run the decision tree(random tree), k-Means Clustering with k=5
and the k-Nearest Neighbours Algorithm using k=5 on our data set using the WEKA tool and see
the outputs. The screenshots of the processes in WEKA are provided below:
Document Page
The
decision
tree(random tree) formed in WEKA
The
clusters
assigned
according
to k-
Means
Clustering
Document Page
The classifier errors for k-Nearest Neighbours
In the first test part, i.e., classification using random decision tree, we see a high value of relative
absolute error(96.533%), which is quite high, hence the model might not be a good fit for our data.
Hence, we see the outputs of cluster analysis(k-Means Clustering) and k-Nearest Neighbor
Algorithm, where we see the errors are relativelely quite less. Thus, the suitable model for our data
would be either k-Means Clustering and k-Nearest Neighbour, among which, we choose k-Means
Clustering for ease of interpretation among the dependencies.
THE MODEL BUILT AND ITS INTERPREATION
The model we choose is built on the k-Means Clustering in which, first the dataset is split into
various groups or clusters(5 in this case) and the mean squared error between the various groups is
calculated using the least squres method by the WEKA tool and the data is clustered. We choose
k=5, so that we get 5 different clusters. We observe that the cluster data tells us that among the 5
clusters, the cluster#3 is the one that has a high affinity for saying yes to Loan. The various average
attributes associated with this cluster are shown below:
tabler-icon-diamond-filled.svg

Secure Best Marks with AI Grader

Need help grading? Try our AI Grader for instant feedback on your assignments.
Document Page
The output of k-Means Clustering of Cluster#3 shown in column corresponding to 3
RESULTS AND CONCLUSION
The output obtained in the previous analysis(k-Means Clustering) can be thus effectively used by
the company in choosing as to which group of students would be more willing to accept a loan, in
our case, the cluster #3, the average scores of which, in the various attributes is given above. This
gives the company to direct less of its offers and schemes to this group of students and try to offer
further schemes for other group of students, namely cluster#0,1,2 and 4 so as to attract further
students and bulid a good brand image.
Thus, we see that the huge data of 2000 students with respect to 17 attributes with confusing and
unclear dependencies was successfully mined to extract useful information which can be used by
the company in directing its various facilities to the particular group of students and thus increase its
business objectives and brand name.
REFERENCES
Abernethy, M.(April 27, 2010), Data Mining with WEKA, Part1:Introduction and Regression, IBM developer works.
[ONLINE]. Available at https://www.ibm.com/developerworks/library/os-weka1/index.html. [Accessed on
25/10/2017].
Abernethy, M.(May 11, 2010), Data Mining with WEKA, Part2:Classification and Clustering,IBM developer works,
[ONLINE]. Available at https://www.ibm.com/developerworks/library/os-weka2/index.html. [Accessed on
25/10/2017].
Abernethy, M.(June 08,2010), Data Mining with WEKA, Part 3: Nearest Neighbour and server side Library, IBM
developer works [ONLINE]. Available at https://www.ibm.com/developerworks/library/os-weka3/index.html.
[Accessed on 25/10/2017].
Hall,M., Frank,E., Holmes,G., Reutemann, B.P.P., and Witten, I.H.(2009) The WEKA Data Mining Software: An
Update, SIGKDD Explorations, Volume11, Issue1.pp.10-18.
R Development Core Team. (2009)R: A Language and Environment for Statistical Computing. R Founda-
tion for Statistical Computing, Vienna, Austria, 2009.
Gewehr,J.E., Szugat,M., and Zimmer, M.(2007) BioWeka—extending the weka framework for
bioinformatics.Bioinformatics, 23(5):651–653, 2007.
Document Page
Su,J., Zhang,H., Ling,C.X., and Matwin,S.,(2008) Discrimina-tive parameter learning for bayesian networks. In
ICML
2008, 2008.
Fan,R.E., Chang,K.W., Hsieh,C.-J., Wang,X-R.,and Lin, C.J., LIBLINEAR: A library for large linear
classification. Journal of Machine Learning. Research,9:1871–1874, 2008.
Brownlee, J. (June 16,2016), How to Download and Install Weka Machine Learning Workbench, Machine Learning
Mastery, [ONLINE]. Available at https://machinelearningmastery.com/download-install-weka-machine-learning-
workbench/. [Accessed on 25/10/2017]
Deng,H.; Runger, G.; Tuv, E. (2011). Bias of importance measures for multi-valued attributes and solutions.
Proceedings of the 21st International Conference on Artificial Neural Networks (ICANN).
chevron_up_icon
1 out of 6
circle_padding
hide_on_mobile
zoom_out_icon
logo.png

Your All-in-One AI-Powered Toolkit for Academic Success.

Available 24*7 on WhatsApp / Email

[object Object]