Economics Assignment on Welfare, Investment, and International Trade
VerifiedAdded on 2020/05/08
|7
|1378
|38
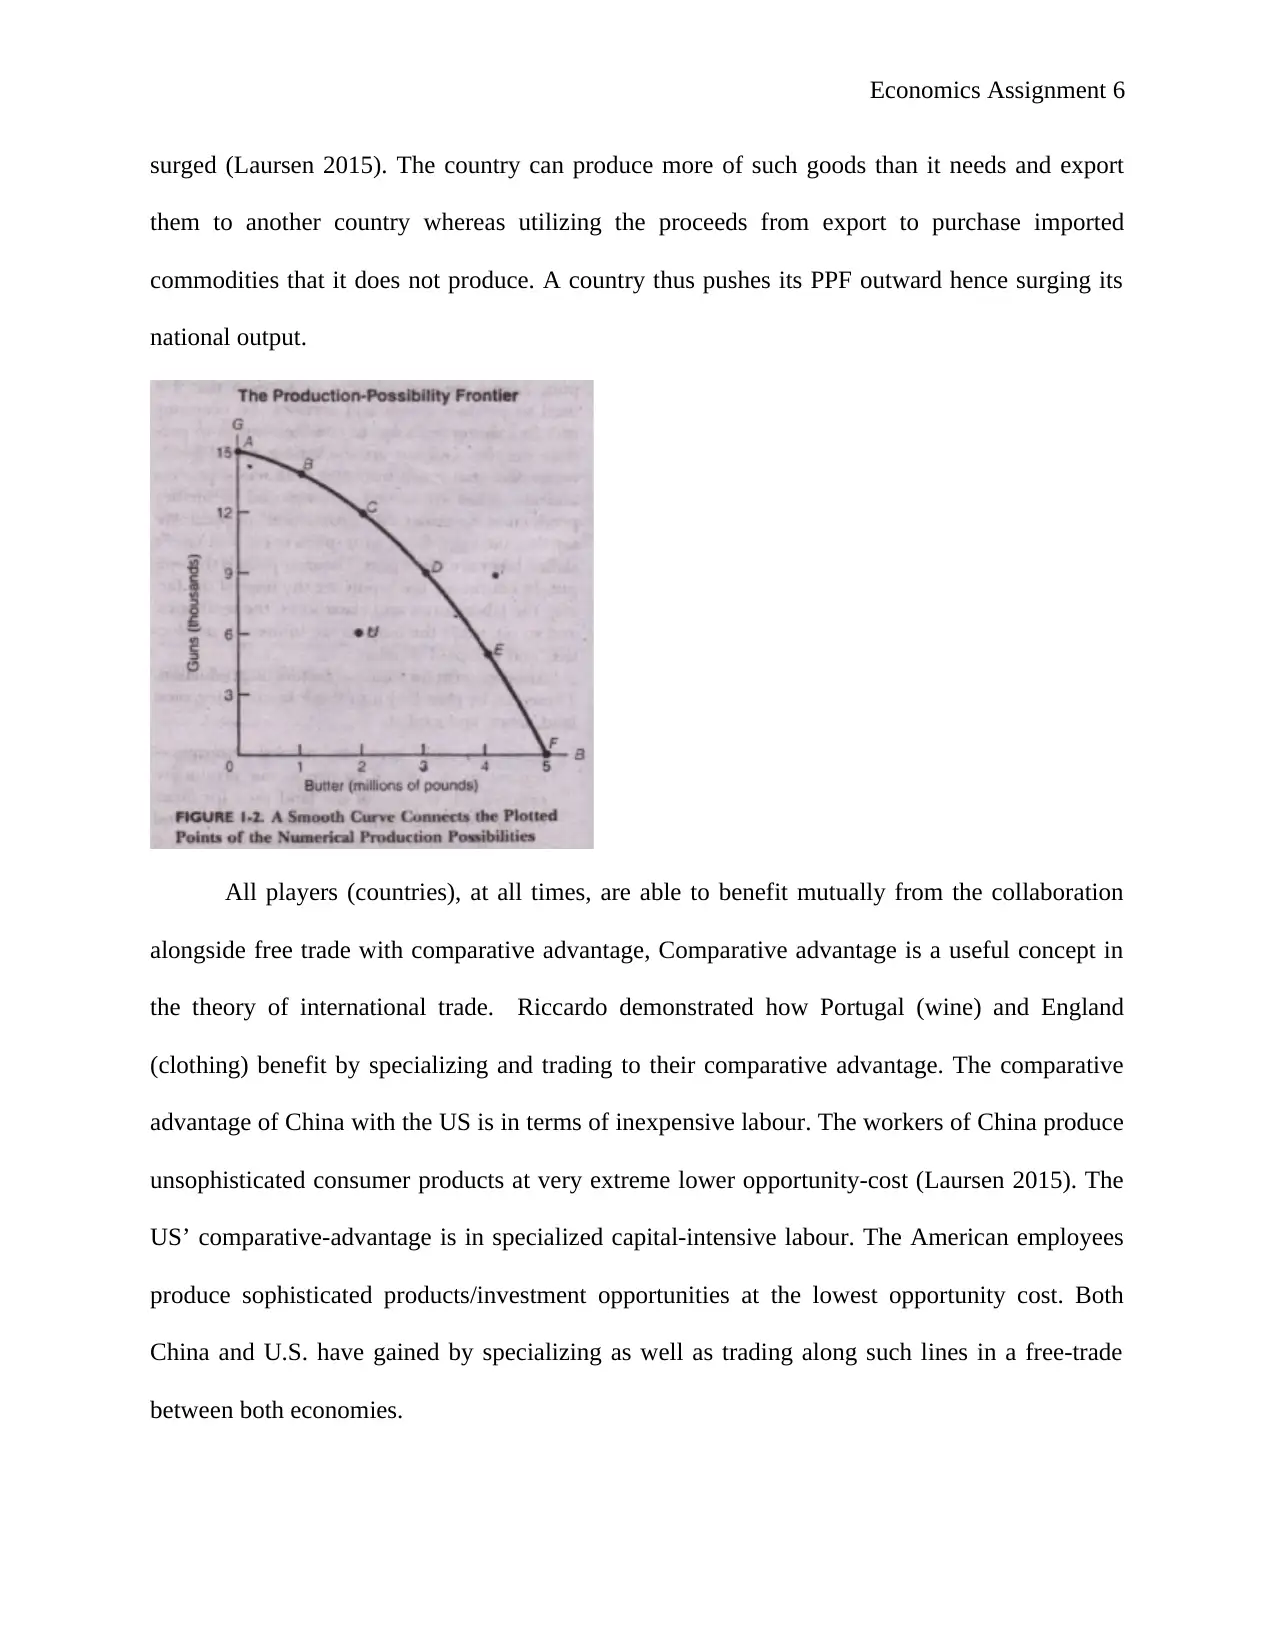
Homework Assignment
AI Summary
This economics assignment addresses three key areas: the effectiveness of GDP as a welfare measure, the impact of interest rates on investment spending, and the role of comparative advantage in international trade. The assignment argues that GDP is an inadequate measure of welfare compared to the Human Development Index (HDI), highlighting the importance of factors beyond market transactions. It then explores the inverse relationship between interest rates and investment, demonstrating how lower rates stimulate investment and higher rates reduce it, impacting GDP growth in both Australia and the United States. Finally, the assignment explains the concept of comparative advantage, illustrating how countries benefit from specializing in goods they can produce most efficiently and engaging in international trade, using examples of trade between China and the United States. The assignment uses graphs and data to support its arguments, and references relevant economic literature.
1 out of 7

Your All-in-One AI-Powered Toolkit for Academic Success.
+13062052269
info@desklib.com
Available 24*7 on WhatsApp / Email
![[object Object]](/_next/static/media/star-bottom.7253800d.svg)
Copyright © 2020–2026 A2Z Services. All Rights Reserved. Developed and managed by ZUCOL.