University Financial Analysis: Wellard Ltd Performance Report
VerifiedAdded on 2020/05/16
|17
|2920
|38
Report
AI Summary
This report provides a comprehensive financial analysis of Wellard Ltd, examining its performance from 2014 to 2017. It includes an overview of the company, its ownership and governance structure, and a detailed ratio analysis, including ROA, ROE, and debt ratios. The report also analyzes share price movements, comparing them to the all-ordinary index and calculating the beta value and required rate of return using the CAPM method. Furthermore, it explores the Weighted Average Cost of Capital (WACC), debt ratios, and dividend policies. The analysis concludes with a letter of recommendation, advising against investment due to the company's financial performance. The report uses data from financial statements and market data to support its findings, offering insights into the company's financial health and investment potential.
RUNNING HEAD: Financial analysis of Wellard Ltd 1
Name of the student
Topic- Financial analysis of Wellard Ltd
University name
Name of the student
Topic- Financial analysis of Wellard Ltd
University name
Paraphrase This Document
Need a fresh take? Get an instant paraphrase of this document with our AI Paraphraser
Table of Contents
Table of Contents..................................................................................................................................2
Introduction...........................................................................................................................................3
1. Present description of the company..........................................................................................3
2. Ownership and governance structure...........................................................................................3
3. Performance ratio analysis of Wellard Ltd....................................................................................4
4. Movements in the share prices.....................................................................................................6
4.1 Graph of share price movement of Wellard Ltd,.........................................................................6
4.2 Comparison of share price movement of Wellard Ltd, with the all ordinary index.....................7
5. Announcements............................................................................................................................7
6. Research via internet.....................................................................................................................8
6.1 The value of beta is calculated from the data fetch from Yahoo finance i.e. .15.........................8
6.2 Computation of required rate of return by using CAPM method................................................8
6.3 Determination of conservative investment.................................................................................9
7. Weighted Average Cost of Capital (WACC)....................................................................................9
7.1 Cost of equity (calculated above using CAPM........................................................................9
7.2 Implications that a higher WACC on investment decision.........................................................10
8. Consideration of debt ratio for the company..............................................................................10
8.1 Appear to stable............................................................................................................................10
8.2 Gearing ratio discussion.............................................................................................................11
9. Divided policies of company........................................................................................................11
10. Letter of recommendation.......................................................................................................12
11. Conclusion...............................................................................................................................13
12. References...............................................................................................................................14
13. Appendix..................................................................................................................................15
Financial analysis of Wellard Ltd 3
Introduction
This report reflects the key understanding on the financial analysis of Wellard Ltd. It
is evaluated that financial analysis tools have been used in this report to evaluate the financial
performance of Wellard Ltd. This report has focused on how investors could analyse the
financial performance of Wellard Ltd in order to make investment in Wellard Company. This
report is focused on the financial performance of Wellard Ltd. It will help investors to assess
whether they should invest in Wellard Ltd.
1. Present description of the company
Wellard Ltd is an Australian company running its business on international level. This
company has operated its business for the production and distribution of livestock and grain.
This company has increased its overall turnover with a view to increase its return.
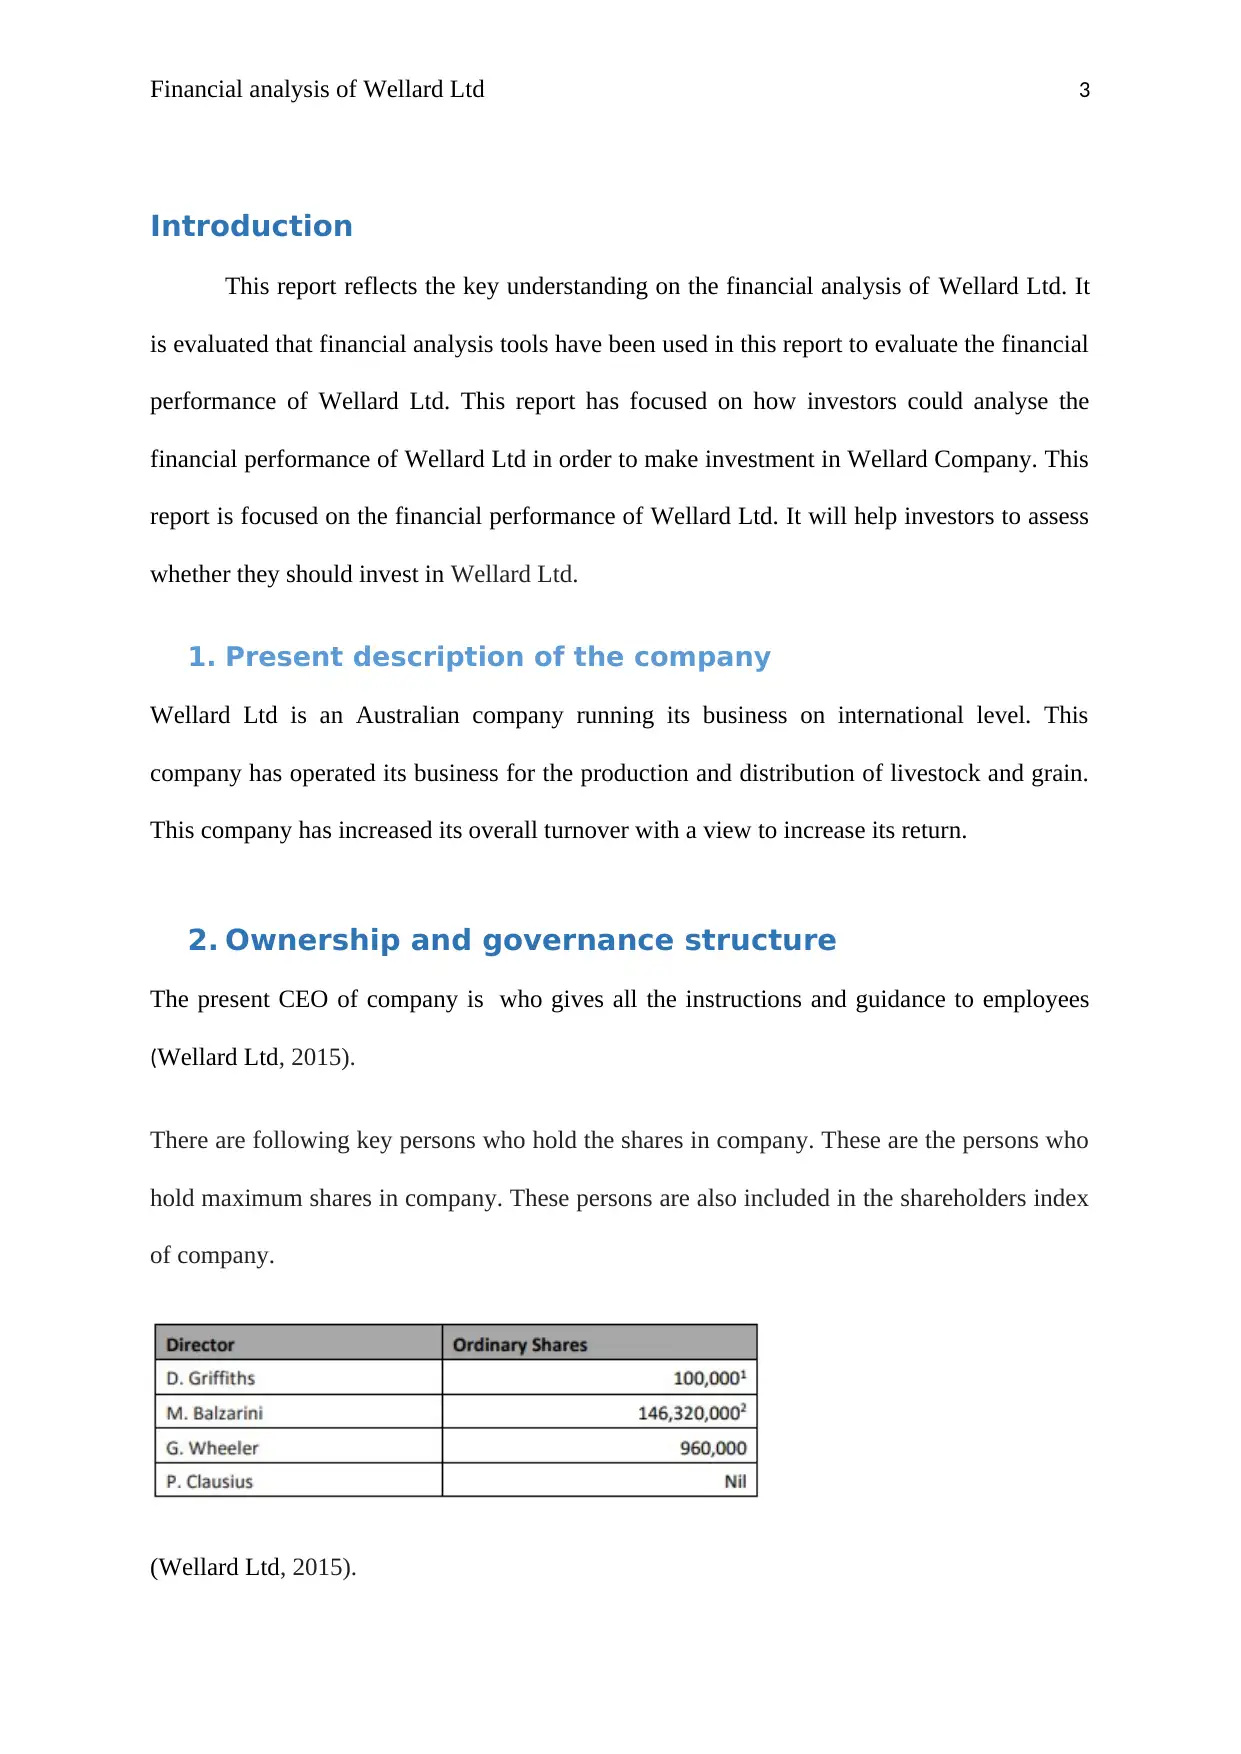
2. Ownership and governance structure
The present CEO of company is who gives all the instructions and guidance to employees
(Wellard Ltd, 2015).
There are following key persons who hold the shares in company. These are the persons who
hold maximum shares in company. These persons are also included in the shareholders index
of company.
(Wellard Ltd, 2015).
Introduction
This report reflects the key understanding on the financial analysis of Wellard Ltd. It
is evaluated that financial analysis tools have been used in this report to evaluate the financial
performance of Wellard Ltd. This report has focused on how investors could analyse the
financial performance of Wellard Ltd in order to make investment in Wellard Company. This
report is focused on the financial performance of Wellard Ltd. It will help investors to assess
whether they should invest in Wellard Ltd.
1. Present description of the company
Wellard Ltd is an Australian company running its business on international level. This
company has operated its business for the production and distribution of livestock and grain.
This company has increased its overall turnover with a view to increase its return.
2. Ownership and governance structure
The present CEO of company is who gives all the instructions and guidance to employees
(Wellard Ltd, 2015).
There are following key persons who hold the shares in company. These are the persons who
hold maximum shares in company. These persons are also included in the shareholders index
of company.
(Wellard Ltd, 2015).
⊘ This is a preview!⊘
Do you want full access?
Subscribe today to unlock all pages.
Trusted by 1+ million students worldwide
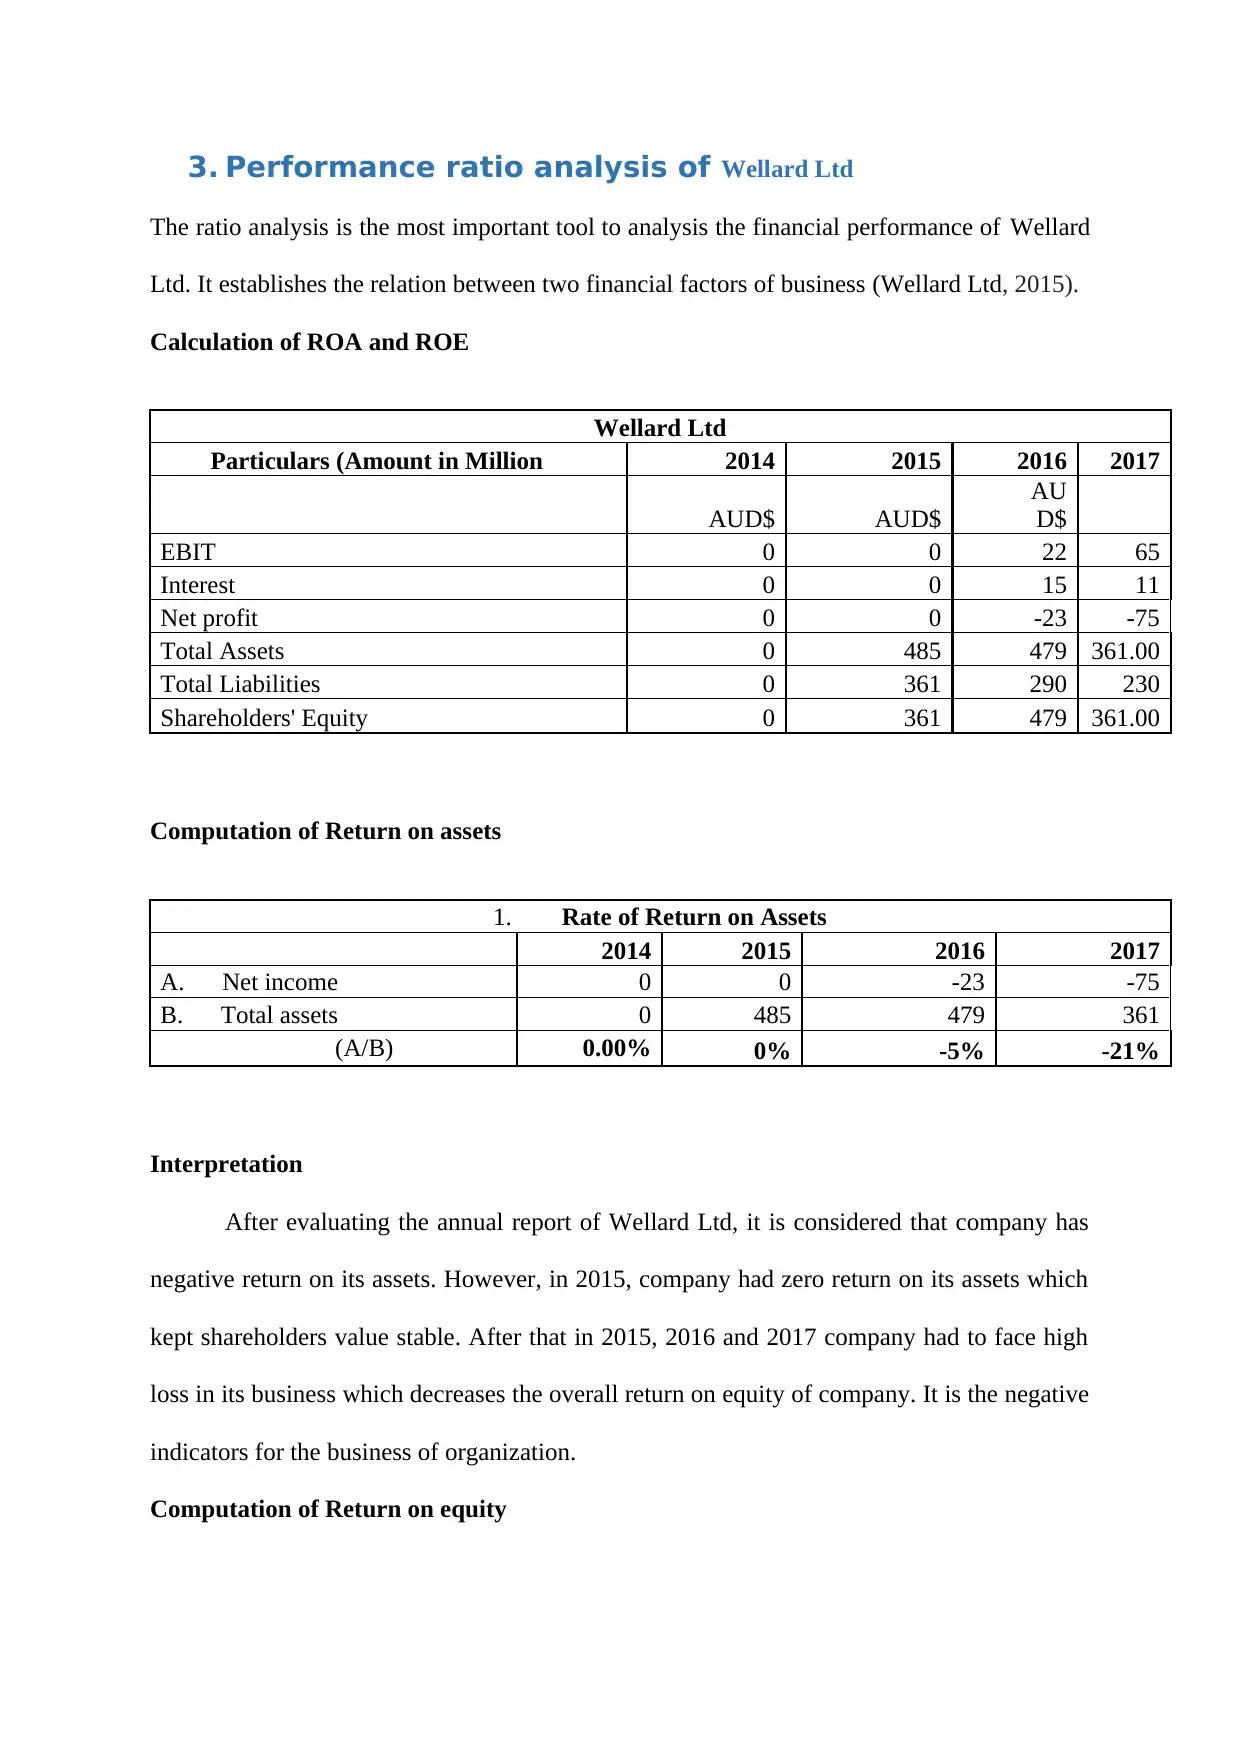
3. Performance ratio analysis of Wellard Ltd
The ratio analysis is the most important tool to analysis the financial performance of Wellard
Ltd. It establishes the relation between two financial factors of business (Wellard Ltd, 2015).
Calculation of ROA and ROE
Wellard Ltd
Particulars (Amount in Million 2014 2015 2016 2017
AUD$ AUD$
AU
D$
EBIT 0 0 22 65
Interest 0 0 15 11
Net profit 0 0 -23 -75
Total Assets 0 485 479 361.00
Total Liabilities 0 361 290 230
Shareholders' Equity 0 361 479 361.00
Computation of Return on assets
1. Rate of Return on Assets
2014 2015 2016 2017
A. Net income 0 0 -23 -75
B. Total assets 0 485 479 361
(A/B) 0.00% 0% -5% -21%
Interpretation
After evaluating the annual report of Wellard Ltd, it is considered that company has
negative return on its assets. However, in 2015, company had zero return on its assets which
kept shareholders value stable. After that in 2015, 2016 and 2017 company had to face high
loss in its business which decreases the overall return on equity of company. It is the negative
indicators for the business of organization.
Computation of Return on equity
Paraphrase This Document
Need a fresh take? Get an instant paraphrase of this document with our AI Paraphraser
Financial analysis of Wellard Ltd 5
2. Rate of Return on Equity
2014 2015 2016 2017
A. Net income available to equity
shareholders. 0 0 -23 -75
B. Shareholder’s Equity 0 17,981 479 361.00
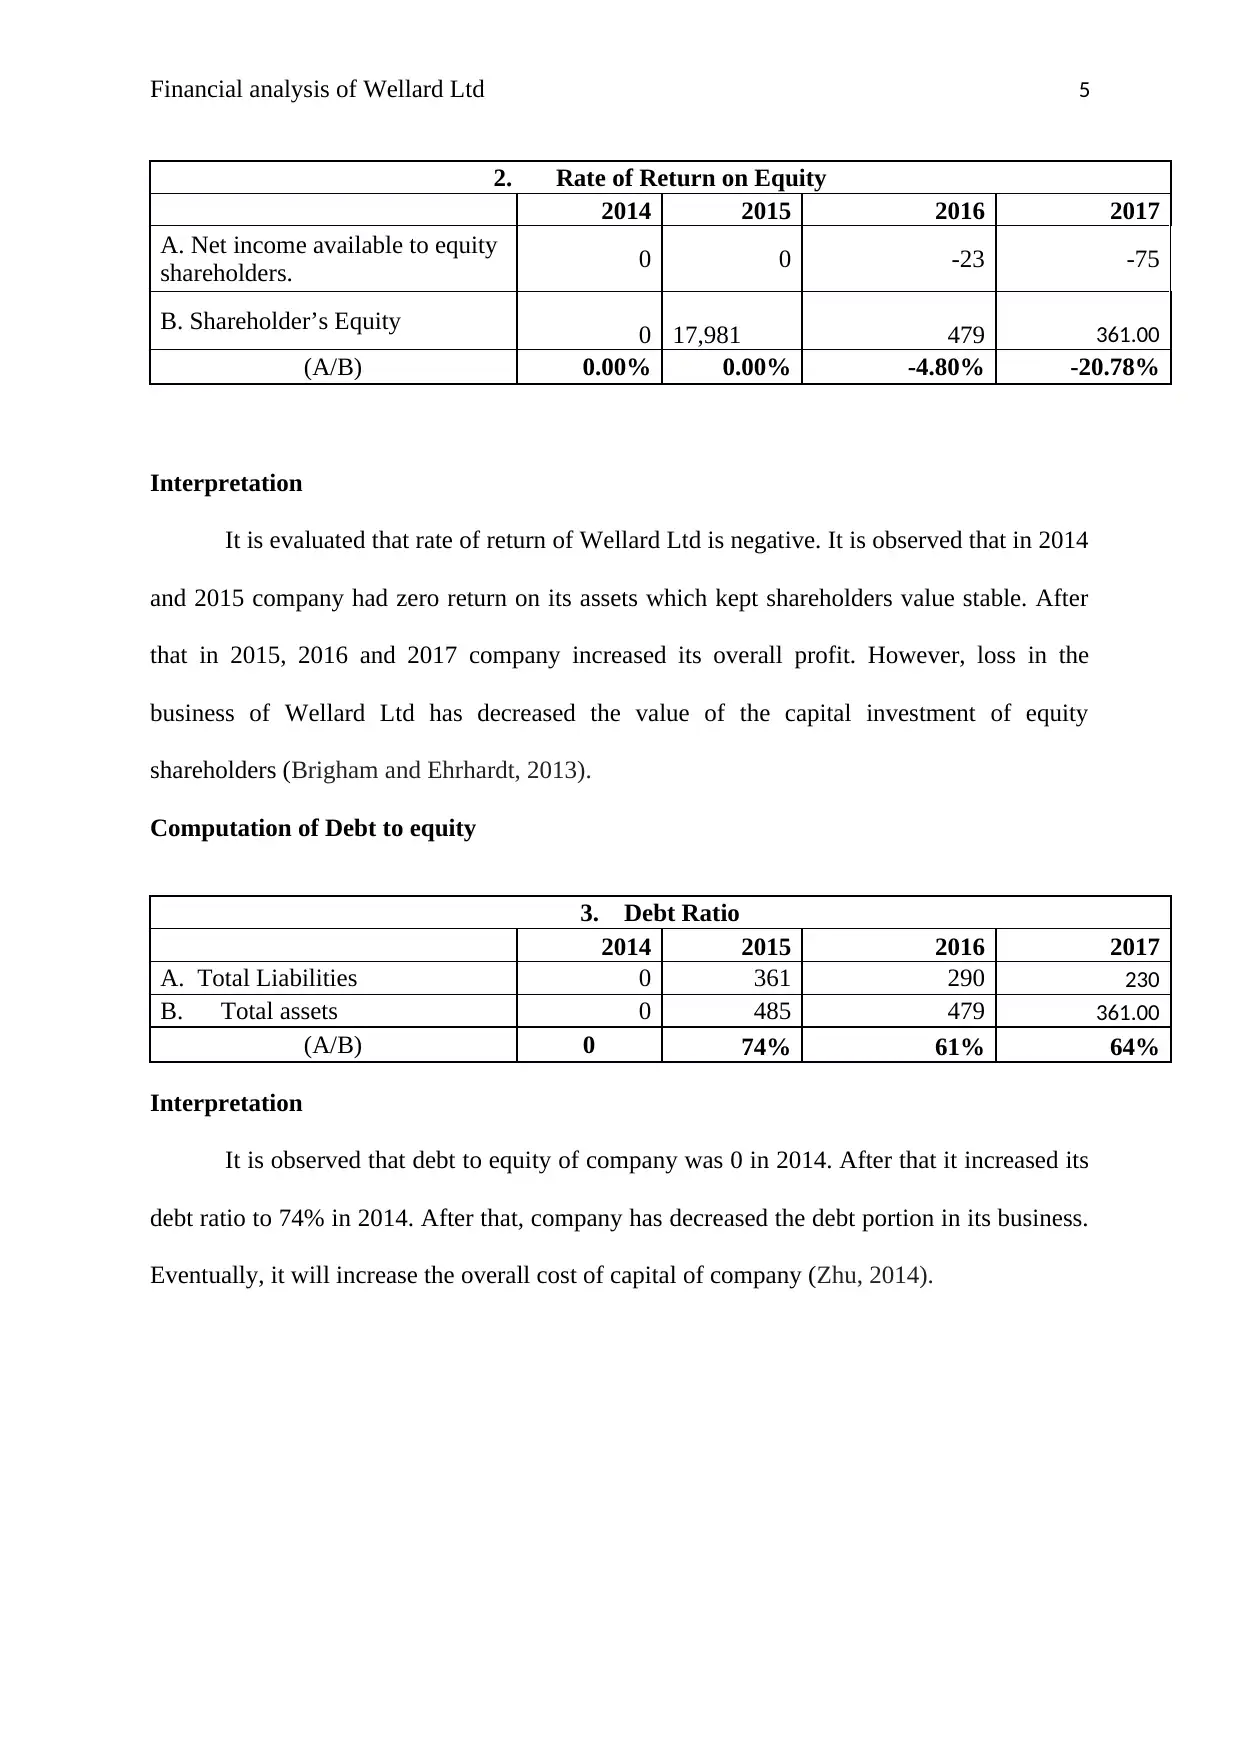
(A/B) 0.00% 0.00% -4.80% -20.78%
Interpretation
It is evaluated that rate of return of Wellard Ltd is negative. It is observed that in 2014
and 2015 company had zero return on its assets which kept shareholders value stable. After
that in 2015, 2016 and 2017 company increased its overall profit. However, loss in the
business of Wellard Ltd has decreased the value of the capital investment of equity
shareholders (Brigham and Ehrhardt, 2013).
Computation of Debt to equity
3. Debt Ratio
2014 2015 2016 2017
A. Total Liabilities 0 361 290 230
B. Total assets 0 485 479 361.00
(A/B) 0 74% 61% 64%
Interpretation
It is observed that debt to equity of company was 0 in 2014. After that it increased its
debt ratio to 74% in 2014. After that, company has decreased the debt portion in its business.
Eventually, it will increase the overall cost of capital of company (Zhu, 2014).
2. Rate of Return on Equity
2014 2015 2016 2017
A. Net income available to equity
shareholders. 0 0 -23 -75
B. Shareholder’s Equity 0 17,981 479 361.00
(A/B) 0.00% 0.00% -4.80% -20.78%
Interpretation
It is evaluated that rate of return of Wellard Ltd is negative. It is observed that in 2014
and 2015 company had zero return on its assets which kept shareholders value stable. After
that in 2015, 2016 and 2017 company increased its overall profit. However, loss in the
business of Wellard Ltd has decreased the value of the capital investment of equity
shareholders (Brigham and Ehrhardt, 2013).
Computation of Debt to equity
3. Debt Ratio
2014 2015 2016 2017
A. Total Liabilities 0 361 290 230
B. Total assets 0 485 479 361.00
(A/B) 0 74% 61% 64%
Interpretation
It is observed that debt to equity of company was 0 in 2014. After that it increased its
debt ratio to 74% in 2014. After that, company has decreased the debt portion in its business.
Eventually, it will increase the overall cost of capital of company (Zhu, 2014).
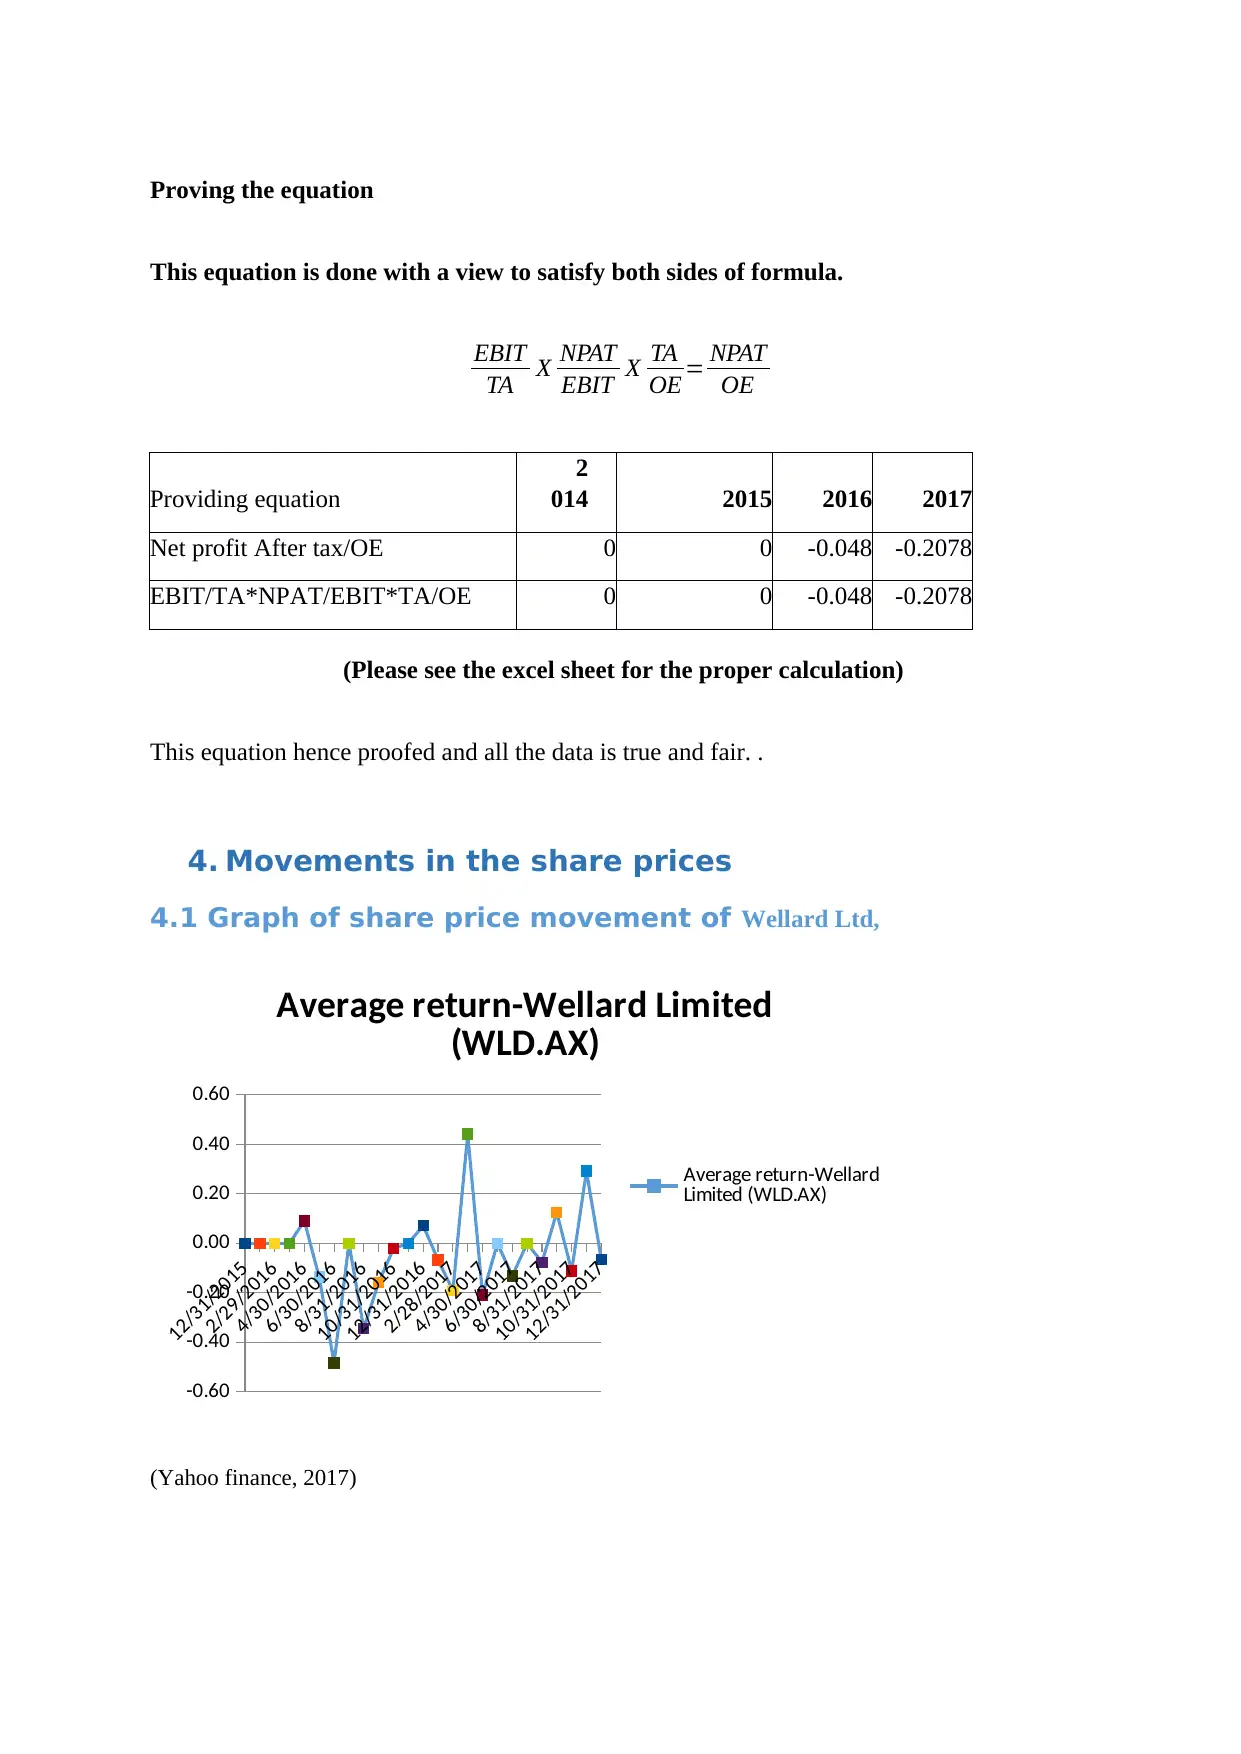
Proving the equation
This equation is done with a view to satisfy both sides of formula.
EBIT
TA X NPAT
EBIT X TA
OE = NPAT
OE
Providing equation
2
014 2015 2016 2017
Net profit After tax/OE 0 0 -0.048 -0.2078
EBIT/TA*NPAT/EBIT*TA/OE 0 0 -0.048 -0.2078
(Please see the excel sheet for the proper calculation)
This equation hence proofed and all the data is true and fair. .
4. Movements in the share prices
4.1 Graph of share price movement of Wellard Ltd,
12/31/2015
2/29/2016
4/30/2016
6/30/2016
8/31/2016
10/31/2016
12/31/2016
2/28/2017
4/30/2017
6/30/2017
8/31/2017
10/31/2017
12/31/2017
-0.60
-0.40
-0.20
0.00
0.20
0.40
0.60
Average return-Wellard Limited
(WLD.AX)
Average return-Wellard
Limited (WLD.AX)
(Yahoo finance, 2017)
⊘ This is a preview!⊘
Do you want full access?
Subscribe today to unlock all pages.
Trusted by 1+ million students worldwide
Financial analysis of Wellard Ltd 7
4.2 Comparison of share price movement of Wellard Ltd, with the all
ordinary index
2/29/2016
3/31/2016
4/30/2016
5/31/2016
6/30/2016
7/31/2016
8/31/2016
9/30/2016
10/31/2016
11/30/2016
12/31/2016
1/31/2017
2/28/2017
3/31/2017
4/30/2017
5/31/2017
6/30/2017
7/31/2017
8/31/2017
9/30/2017
10/31/2017
11/30/2017
12/31/2017
-4.00
-3.00
-2.00
-1.00
0.00
1.00
2.00
3.00
Average Return
Average return-Wellard Limited (WLD.AX) 0.00 0.00
Average Return
(Yahoo finance, 2017)
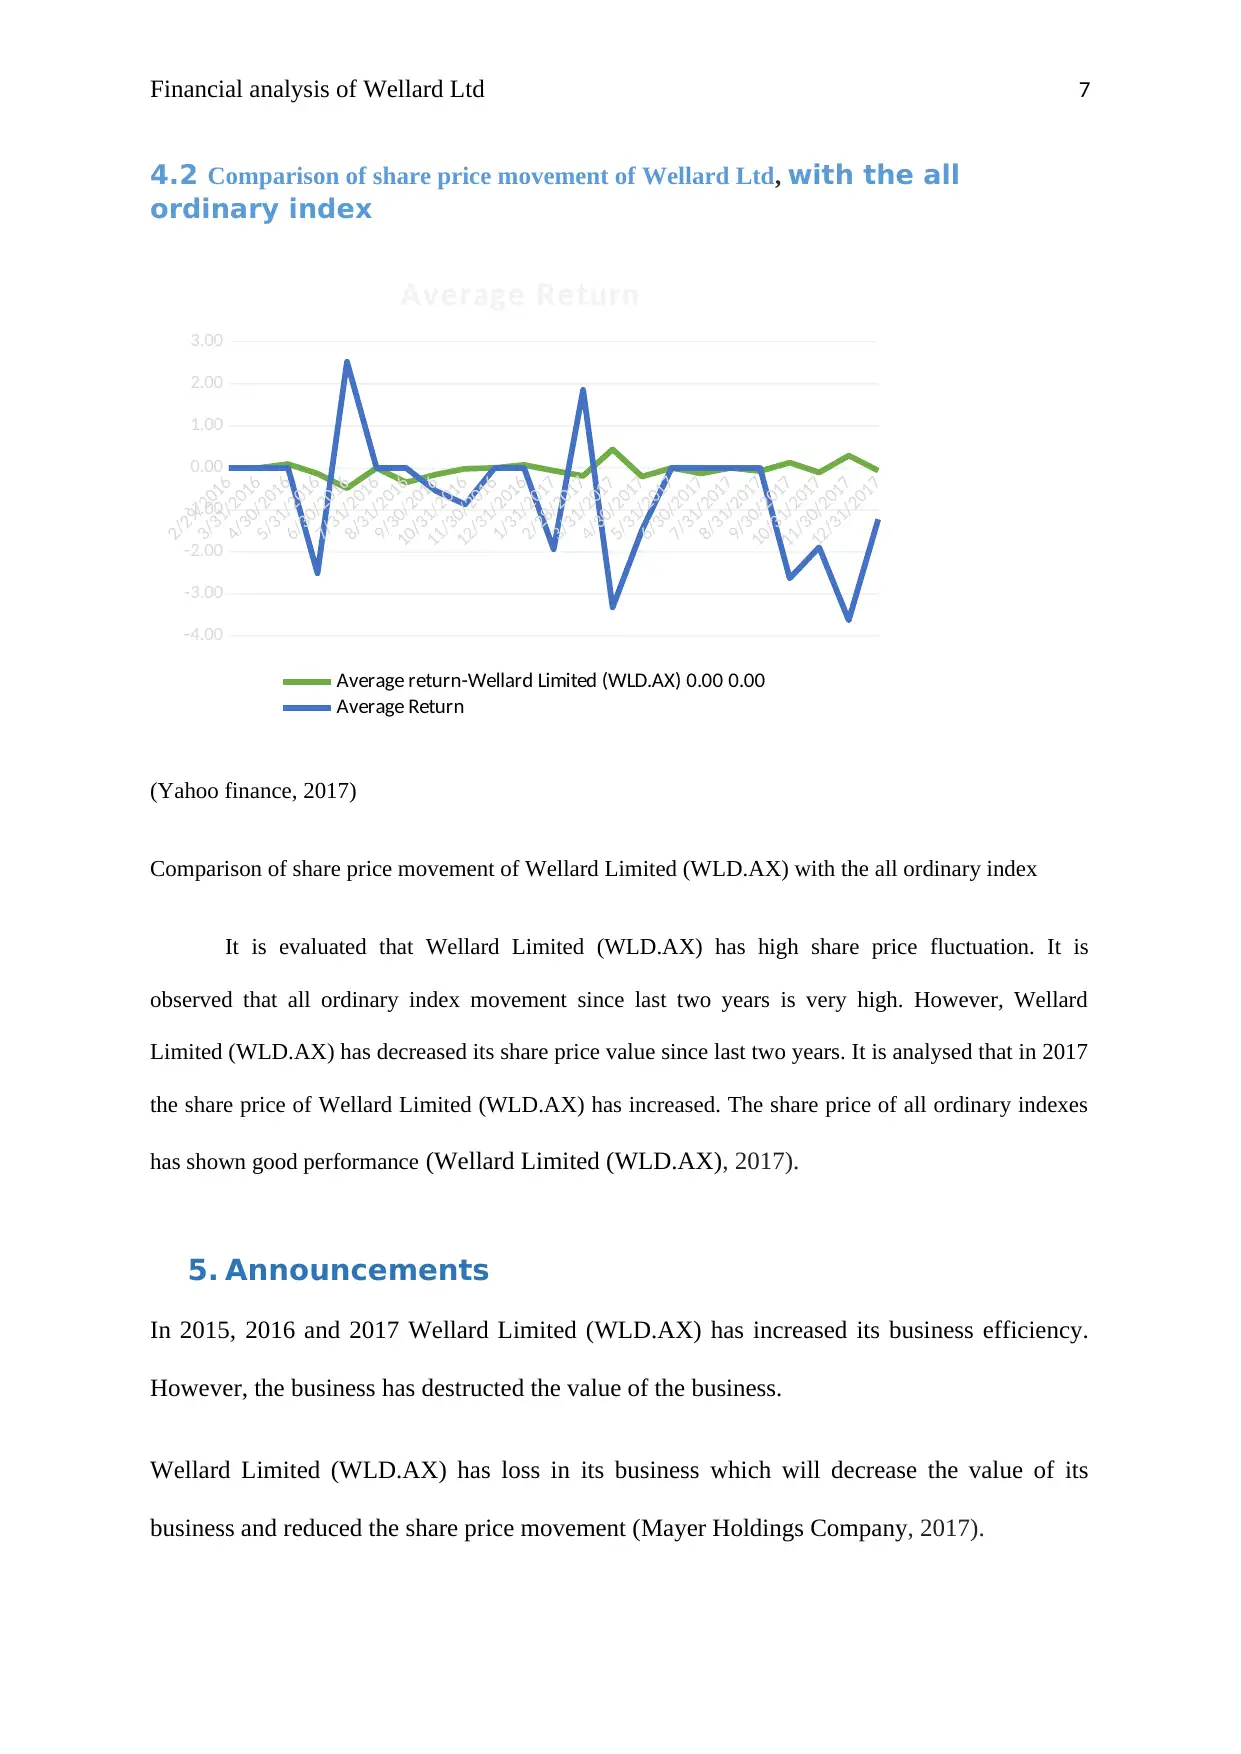
Comparison of share price movement of Wellard Limited (WLD.AX) with the all ordinary index
It is evaluated that Wellard Limited (WLD.AX) has high share price fluctuation. It is
observed that all ordinary index movement since last two years is very high. However, Wellard
Limited (WLD.AX) has decreased its share price value since last two years. It is analysed that in 2017
the share price of Wellard Limited (WLD.AX) has increased. The share price of all ordinary indexes
has shown good performance (Wellard Limited (WLD.AX), 2017).
5. Announcements
In 2015, 2016 and 2017 Wellard Limited (WLD.AX) has increased its business efficiency.
However, the business has destructed the value of the business.
Wellard Limited (WLD.AX) has loss in its business which will decrease the value of its
business and reduced the share price movement (Mayer Holdings Company, 2017).
4.2 Comparison of share price movement of Wellard Ltd, with the all
ordinary index
2/29/2016
3/31/2016
4/30/2016
5/31/2016
6/30/2016
7/31/2016
8/31/2016
9/30/2016
10/31/2016
11/30/2016
12/31/2016
1/31/2017
2/28/2017
3/31/2017
4/30/2017
5/31/2017
6/30/2017
7/31/2017
8/31/2017
9/30/2017
10/31/2017
11/30/2017
12/31/2017
-4.00
-3.00
-2.00
-1.00
0.00
1.00
2.00
3.00
Average Return
Average return-Wellard Limited (WLD.AX) 0.00 0.00
Average Return
(Yahoo finance, 2017)
Comparison of share price movement of Wellard Limited (WLD.AX) with the all ordinary index
It is evaluated that Wellard Limited (WLD.AX) has high share price fluctuation. It is
observed that all ordinary index movement since last two years is very high. However, Wellard
Limited (WLD.AX) has decreased its share price value since last two years. It is analysed that in 2017
the share price of Wellard Limited (WLD.AX) has increased. The share price of all ordinary indexes
has shown good performance (Wellard Limited (WLD.AX), 2017).
5. Announcements
In 2015, 2016 and 2017 Wellard Limited (WLD.AX) has increased its business efficiency.
However, the business has destructed the value of the business.
Wellard Limited (WLD.AX) has loss in its business which will decrease the value of its
business and reduced the share price movement (Mayer Holdings Company, 2017).
Paraphrase This Document
Need a fresh take? Get an instant paraphrase of this document with our AI Paraphraser
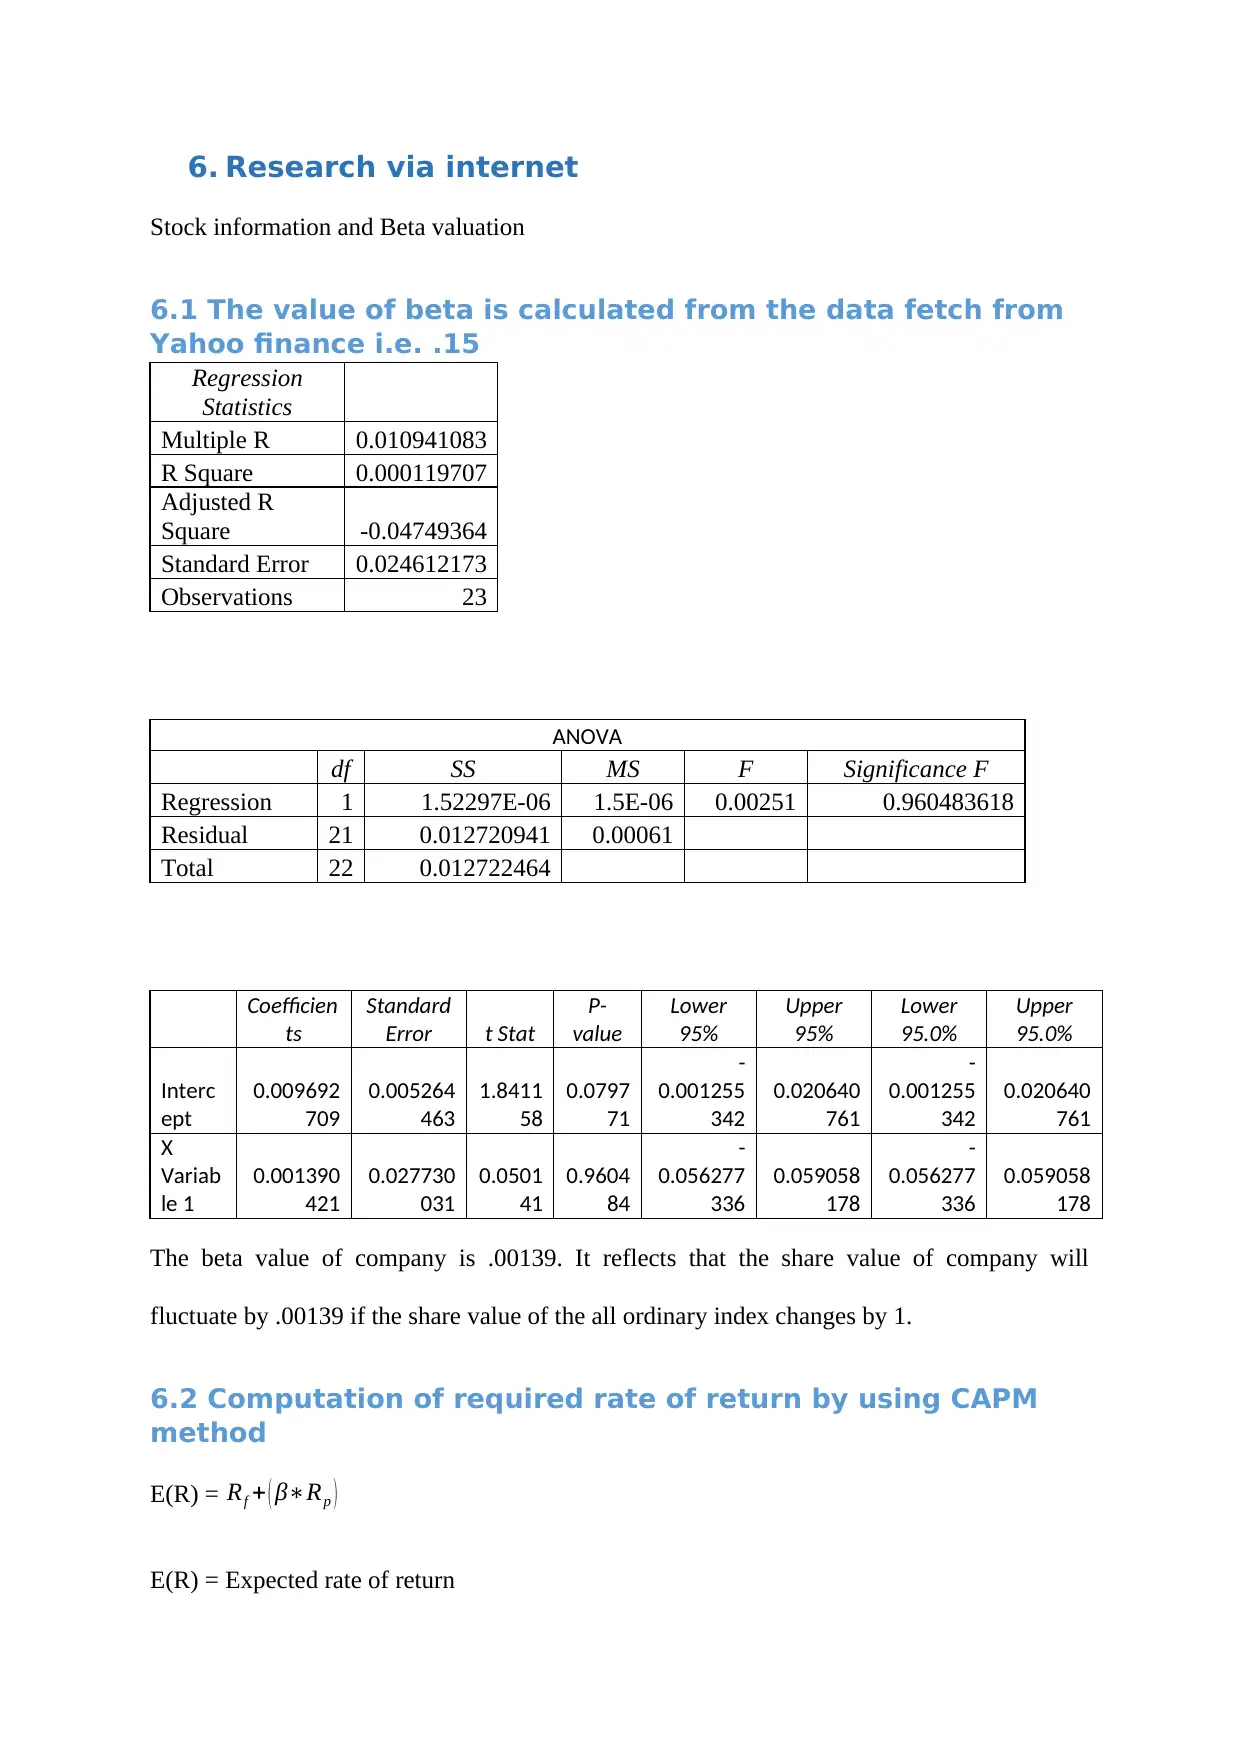
6. Research via internet
Stock information and Beta valuation
6.1 The value of beta is calculated from the data fetch from
Yahoo finance i.e. .15
Regression
Statistics
Multiple R 0.010941083
R Square 0.000119707
Adjusted R
Square -0.04749364
Standard Error 0.024612173
Observations 23
ANOVA
df SS MS F Significance F
Regression 1 1.52297E-06 1.5E-06 0.00251 0.960483618
Residual 21 0.012720941 0.00061
Total 22 0.012722464
Coefficien
ts
Standard
Error t Stat
P-
value
Lower
95%
Upper
95%
Lower
95.0%
Upper
95.0%
Interc
ept
0.009692
709
0.005264
463
1.8411
58
0.0797
71
-
0.001255
342
0.020640
761
-
0.001255
342
0.020640
761
X
Variab
le 1
0.001390
421
0.027730
031
0.0501
41
0.9604
84
-
0.056277
336
0.059058
178
-
0.056277
336
0.059058
178
The beta value of company is .00139. It reflects that the share value of company will
fluctuate by .00139 if the share value of the all ordinary index changes by 1.
6.2 Computation of required rate of return by using CAPM
method
E(R) = Rf + ( β∗Rp )
E(R) = Expected rate of return
Financial analysis of Wellard Ltd 9
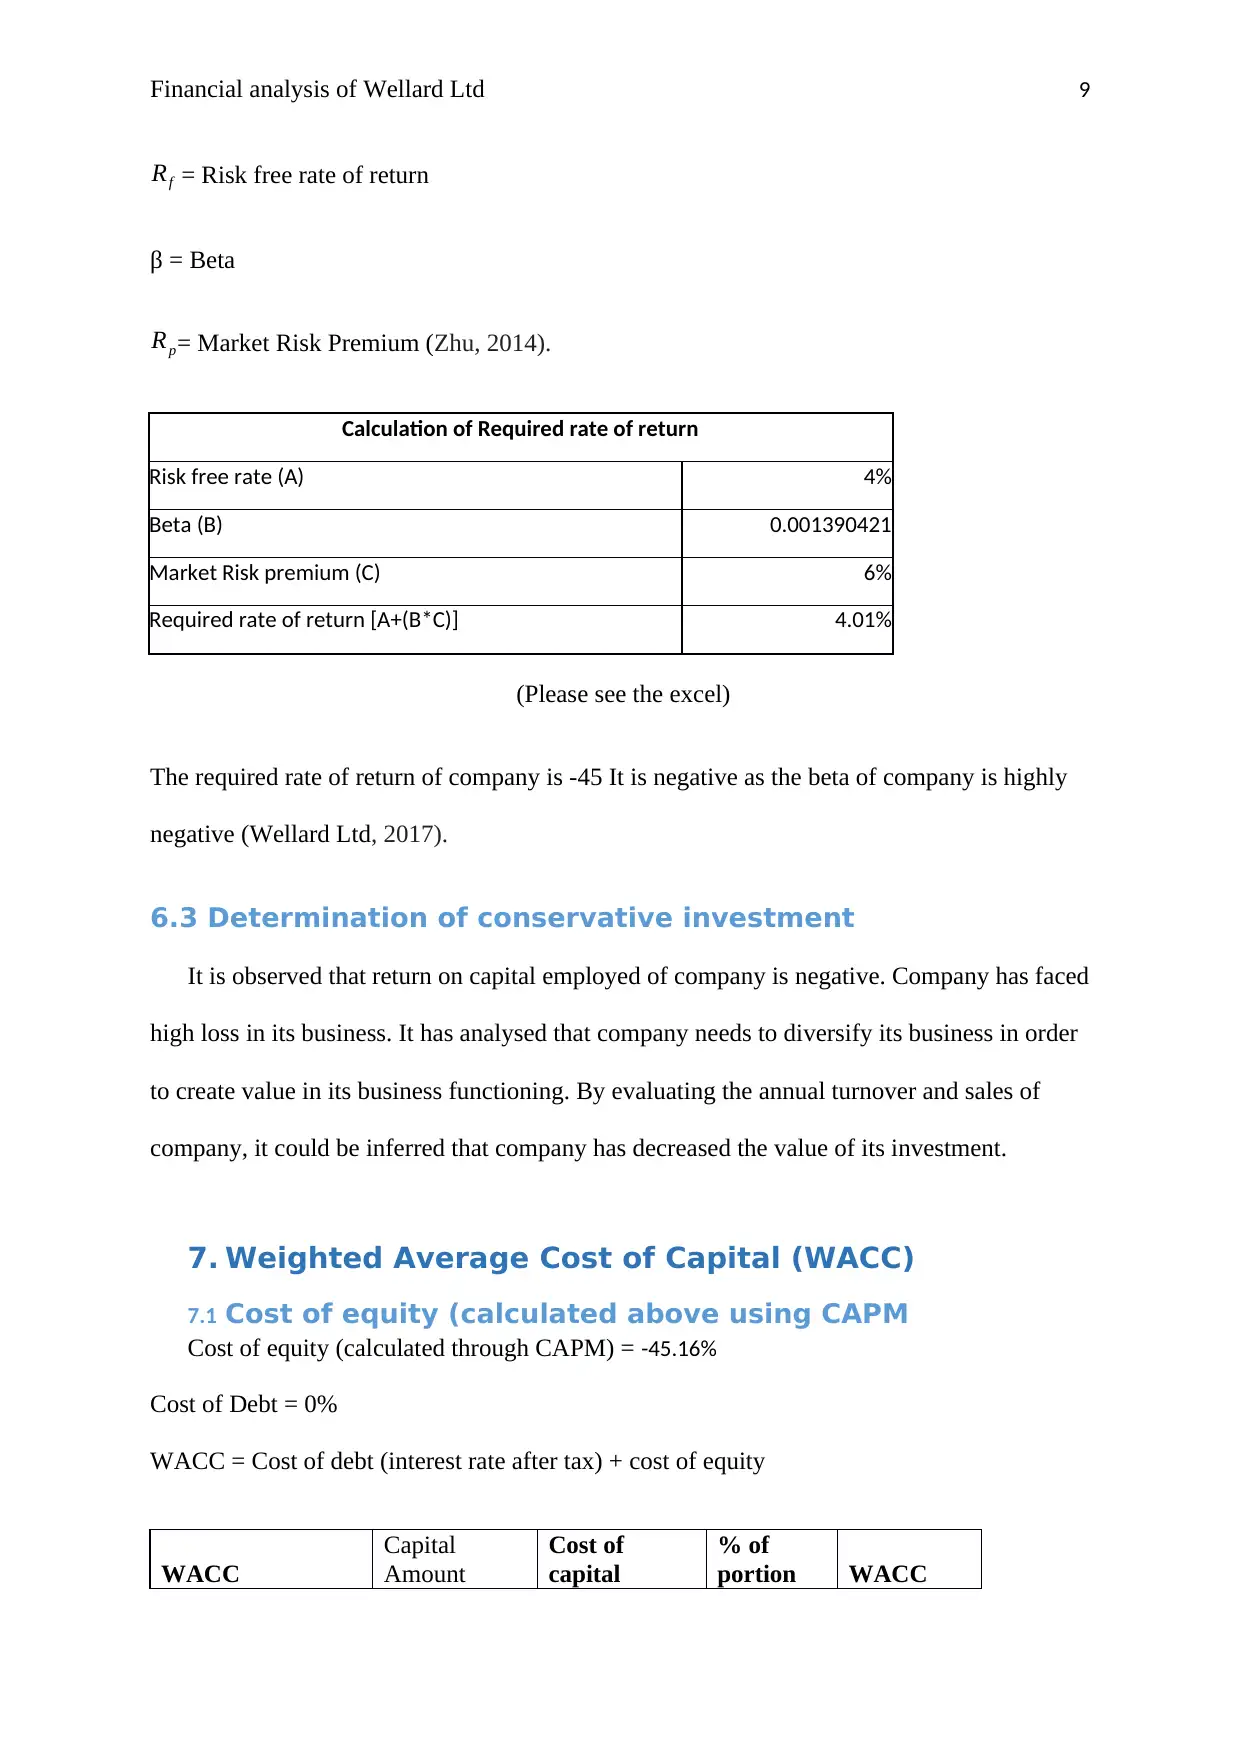
Rf = Risk free rate of return
β = Beta
Rp= Market Risk Premium (Zhu, 2014).
Calculation of Required rate of return
Risk free rate (A) 4%
Beta (B) 0.001390421
Market Risk premium (C) 6%
Required rate of return [A+(B*C)] 4.01%
(Please see the excel)
The required rate of return of company is -45 It is negative as the beta of company is highly
negative (Wellard Ltd, 2017).
6.3 Determination of conservative investment
It is observed that return on capital employed of company is negative. Company has faced
high loss in its business. It has analysed that company needs to diversify its business in order
to create value in its business functioning. By evaluating the annual turnover and sales of
company, it could be inferred that company has decreased the value of its investment.
7. Weighted Average Cost of Capital (WACC)
7.1 Cost of equity (calculated above using CAPM
Cost of equity (calculated through CAPM) = -45.16%
Cost of Debt = 0%
WACC = Cost of debt (interest rate after tax) + cost of equity
WACC
Capital
Amount
Cost of
capital
% of
portion WACC
⊘ This is a preview!⊘
Do you want full access?
Subscribe today to unlock all pages.
Trusted by 1+ million students worldwide
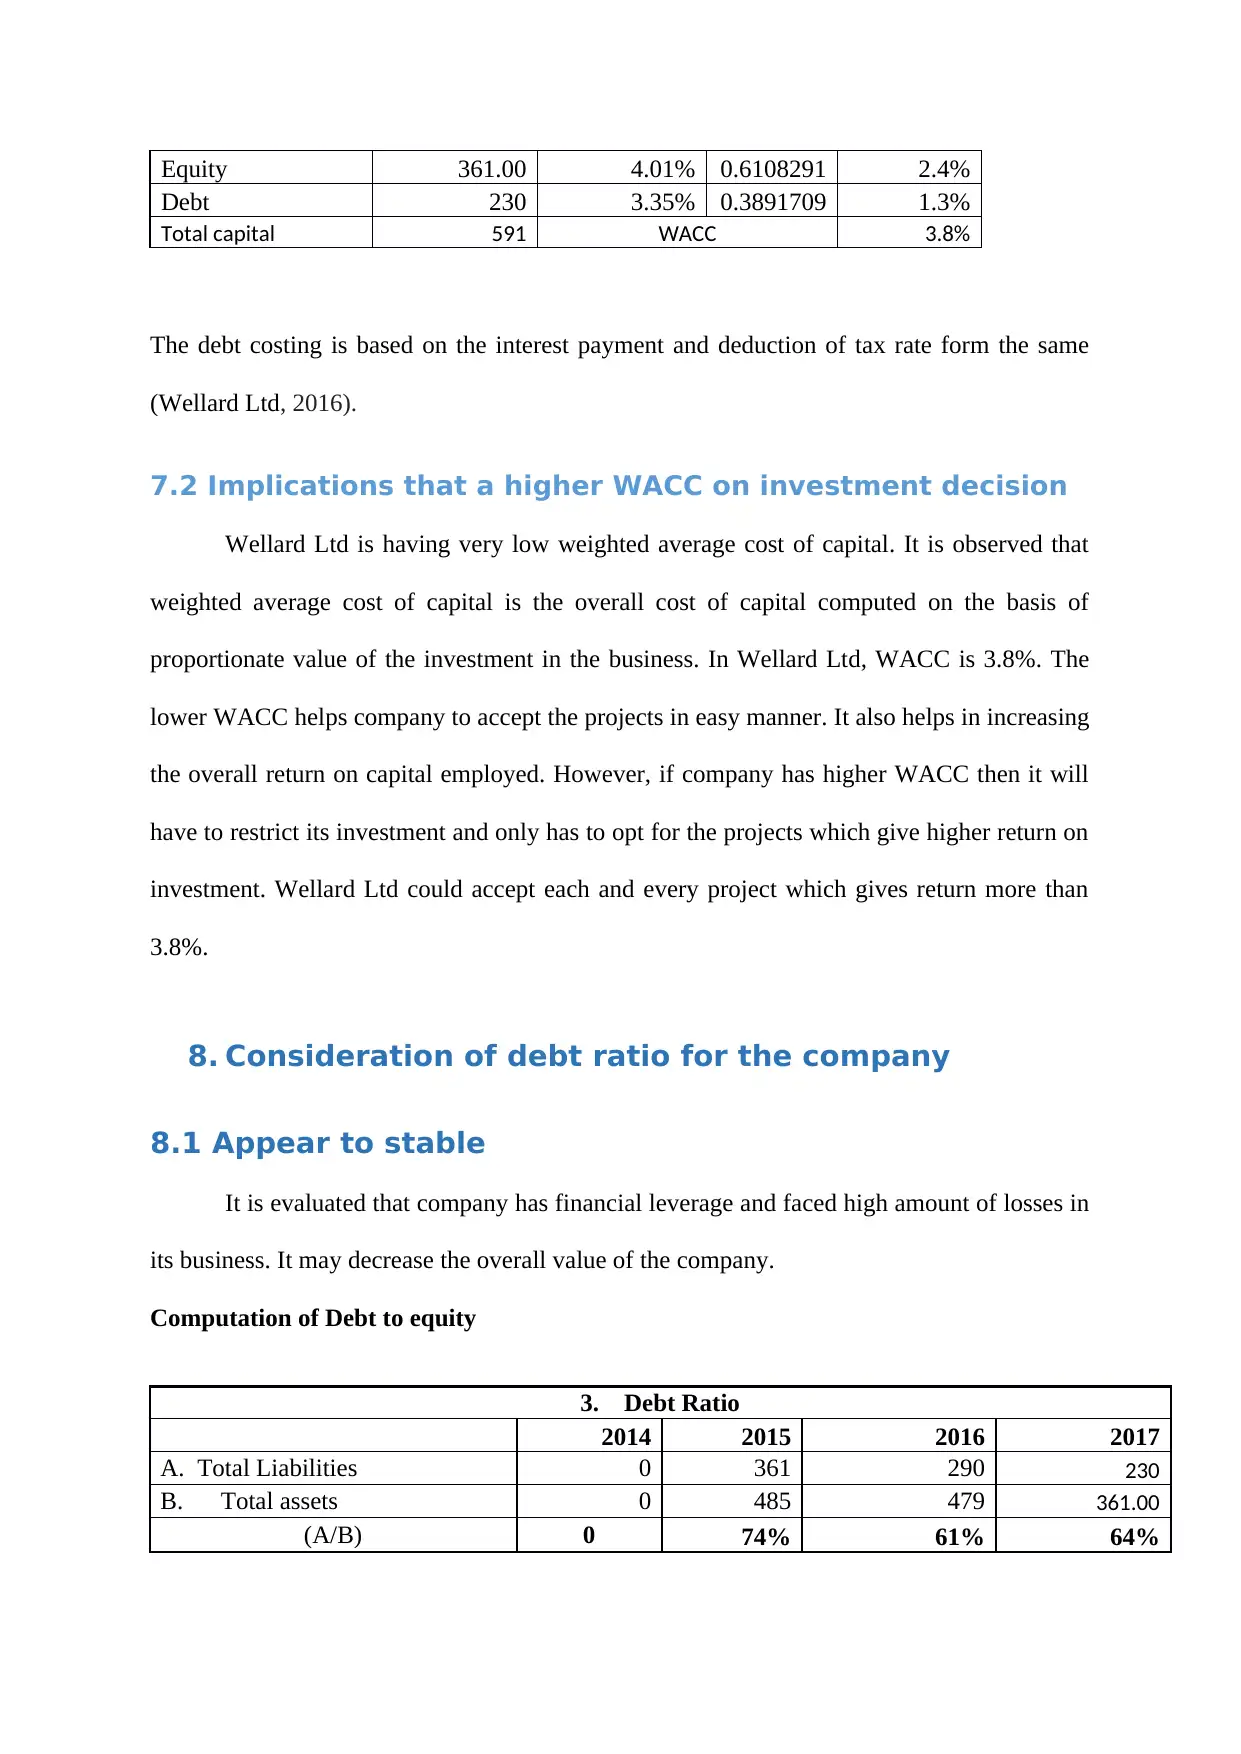
Equity 361.00 4.01% 0.6108291 2.4%
Debt 230 3.35% 0.3891709 1.3%
Total capital 591 WACC 3.8%
The debt costing is based on the interest payment and deduction of tax rate form the same
(Wellard Ltd, 2016).
7.2 Implications that a higher WACC on investment decision
Wellard Ltd is having very low weighted average cost of capital. It is observed that
weighted average cost of capital is the overall cost of capital computed on the basis of
proportionate value of the investment in the business. In Wellard Ltd, WACC is 3.8%. The
lower WACC helps company to accept the projects in easy manner. It also helps in increasing
the overall return on capital employed. However, if company has higher WACC then it will
have to restrict its investment and only has to opt for the projects which give higher return on
investment. Wellard Ltd could accept each and every project which gives return more than
3.8%.
8. Consideration of debt ratio for the company
8.1 Appear to stable
It is evaluated that company has financial leverage and faced high amount of losses in
its business. It may decrease the overall value of the company.
Computation of Debt to equity
3. Debt Ratio
2014 2015 2016 2017
A. Total Liabilities 0 361 290 230
B. Total assets 0 485 479 361.00
(A/B) 0 74% 61% 64%
Paraphrase This Document
Need a fresh take? Get an instant paraphrase of this document with our AI Paraphraser
Financial analysis of Wellard Ltd 11
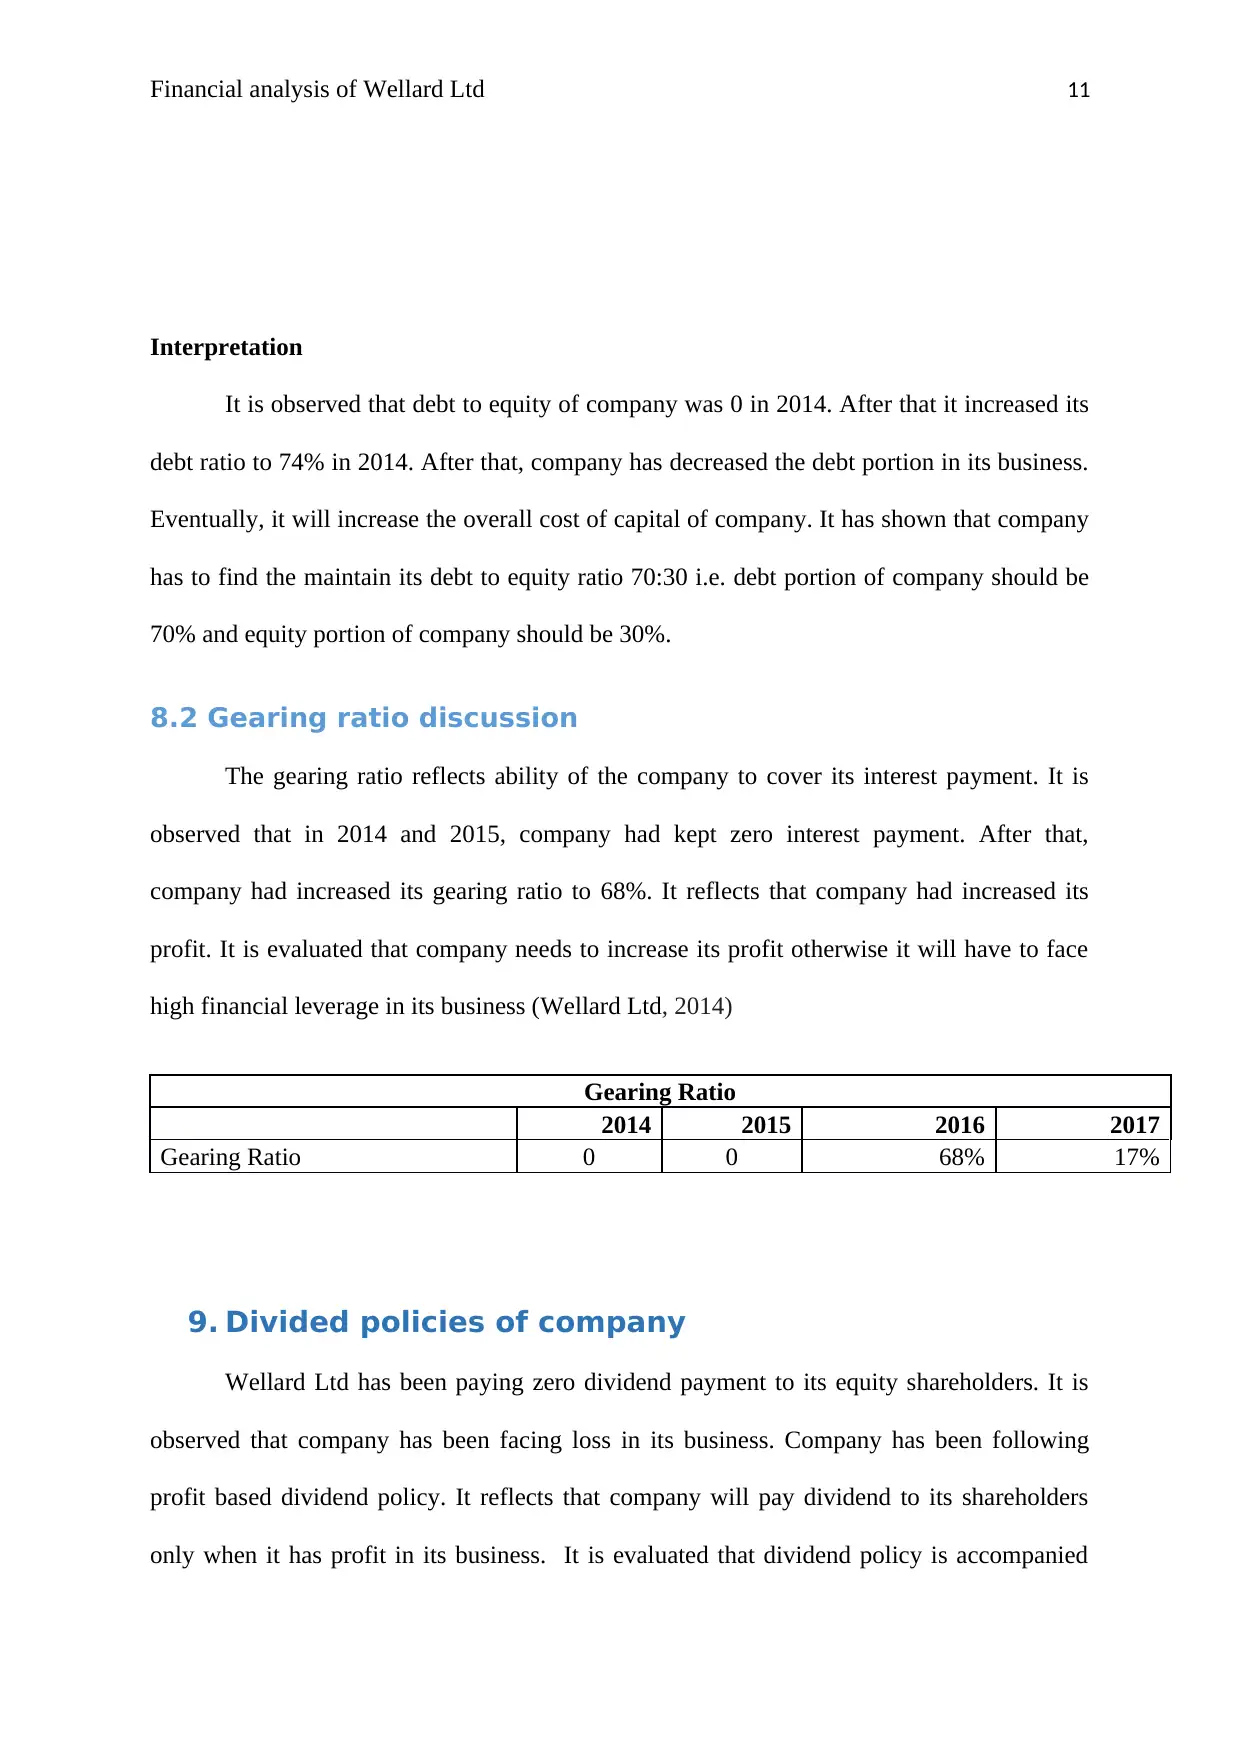
Interpretation
It is observed that debt to equity of company was 0 in 2014. After that it increased its
debt ratio to 74% in 2014. After that, company has decreased the debt portion in its business.
Eventually, it will increase the overall cost of capital of company. It has shown that company
has to find the maintain its debt to equity ratio 70:30 i.e. debt portion of company should be
70% and equity portion of company should be 30%.
8.2 Gearing ratio discussion
The gearing ratio reflects ability of the company to cover its interest payment. It is
observed that in 2014 and 2015, company had kept zero interest payment. After that,
company had increased its gearing ratio to 68%. It reflects that company had increased its
profit. It is evaluated that company needs to increase its profit otherwise it will have to face
high financial leverage in its business (Wellard Ltd, 2014)
Gearing Ratio
2014 2015 2016 2017
Gearing Ratio 0 0 68% 17%
9. Divided policies of company
Wellard Ltd has been paying zero dividend payment to its equity shareholders. It is
observed that company has been facing loss in its business. Company has been following
profit based dividend policy. It reflects that company will pay dividend to its shareholders
only when it has profit in its business. It is evaluated that dividend policy is accompanied
with the guidelines or rules which will be followed by companies to distribute dividend to
shareholders. This dividend policy is the most important factors for the success of
organization. Wellard Ltd has not distributed dividend to its shareholders which reflects that
it has no profit in its business or plugged back all of its profit in its business.
10. Letter of recommendation
After evaluating all the details and case study of the Wellard Ltd, it is observed that since
last five years, the performance of Wellard Ltd is not good. In addition to this, in 2017,
company has increased its investment in its business operation but its profit has not been
increasing throughout the time. It is advised to investors that they should not take this
Wellard Ltd Company in its portfolio. It is observed that including this company in the
investment portfolio will surely destruct the value of the investment capital of clients. It is
advised that investors should not include this company in their investment portfolio.
However, investors might think to include this company for long run to increase the overall
return. Wellard Ltd is increasing its overall return by increasing the investment in its
operating assets. It may result to increase in its operating profit in the future (Brigham, and
Ehrhardt, 2013). Therefore, in the end, it could be recommended that shareholders should not
invest their capital in Wellard Ltd otherwise they would have loss in their capital investment.
⊘ This is a preview!⊘
Do you want full access?
Subscribe today to unlock all pages.
Trusted by 1+ million students worldwide
1 out of 17
Related Documents


Your All-in-One AI-Powered Toolkit for Academic Success.
+13062052269
info@desklib.com
Available 24*7 on WhatsApp / Email
![[object Object]](/_next/static/media/star-bottom.7253800d.svg)
Unlock your academic potential
Copyright © 2020–2026 A2Z Services. All Rights Reserved. Developed and managed by ZUCOL.