Evaluation of Visual Presentation in Wesfarmers Annual Report - MIS770

Verified

Added on  2023/05/29

|16
|2667
|278
Report
AI Summary
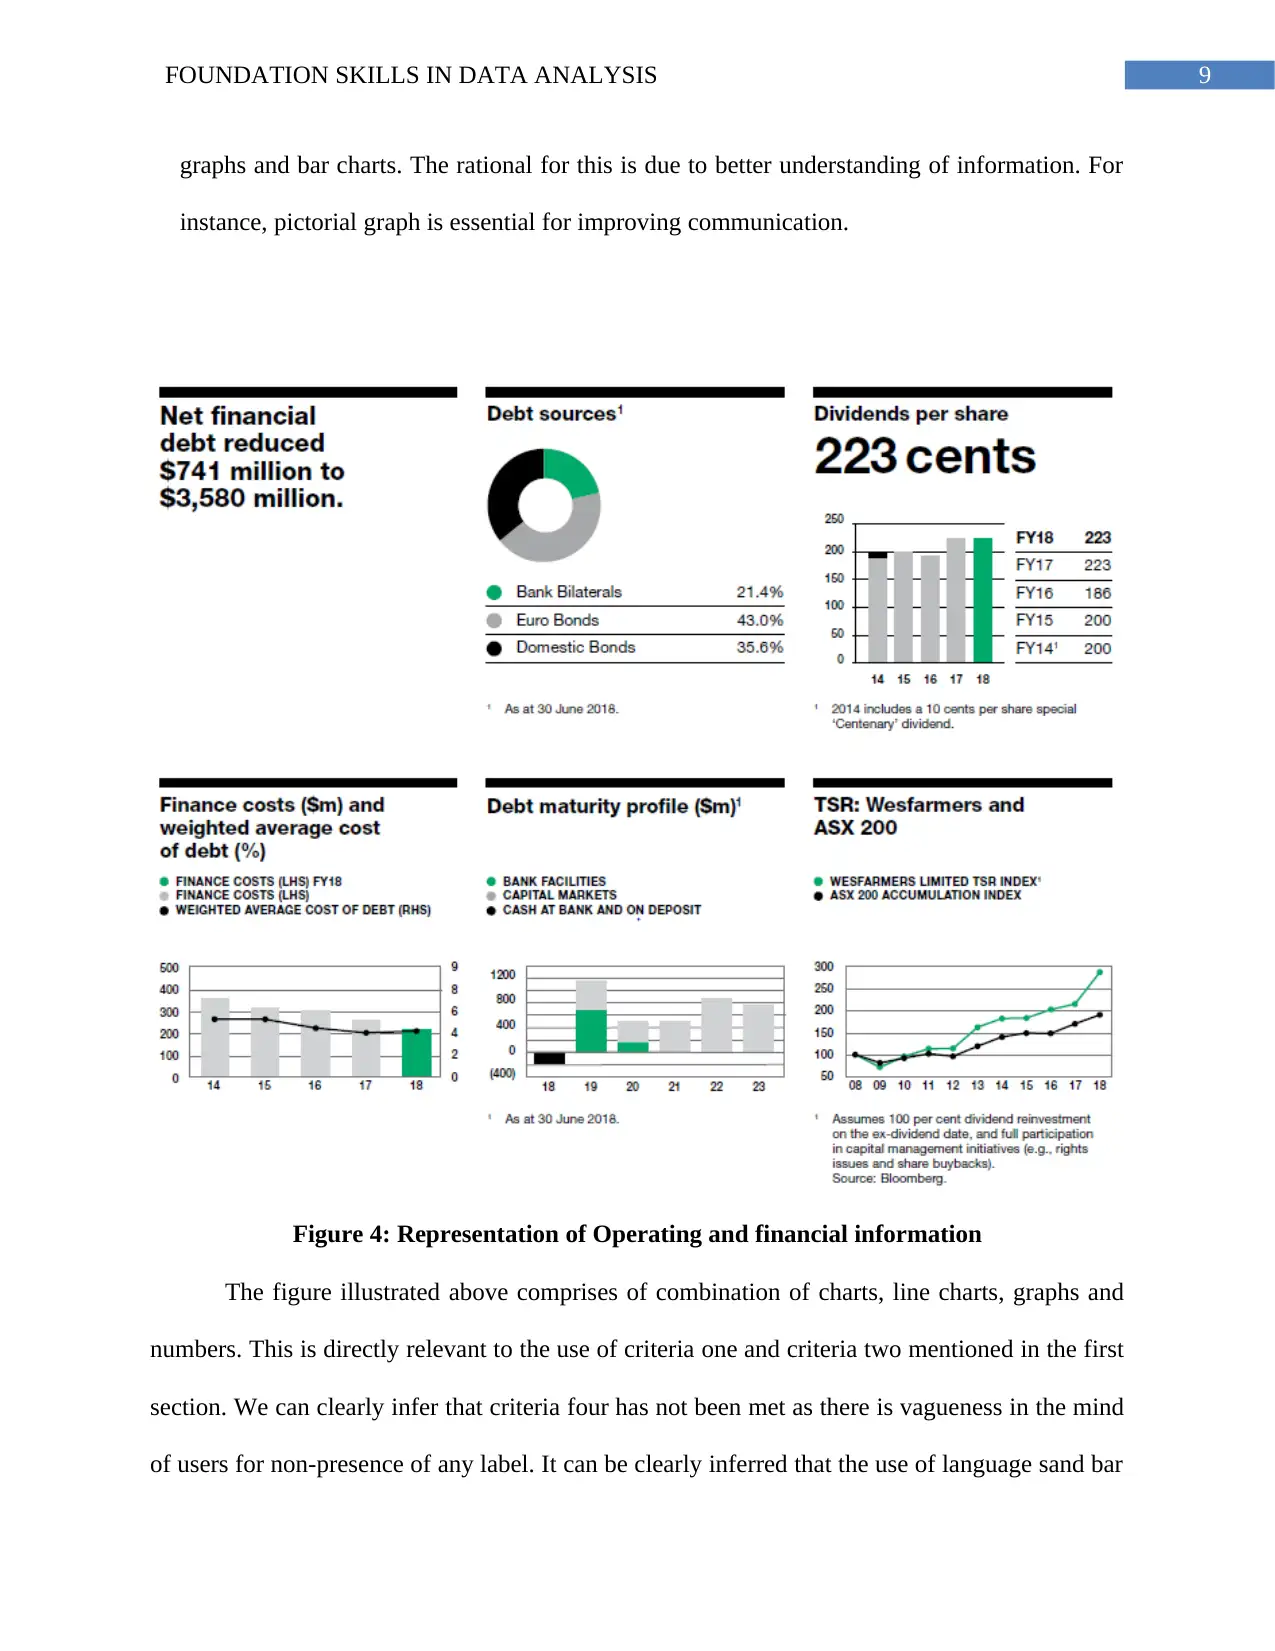
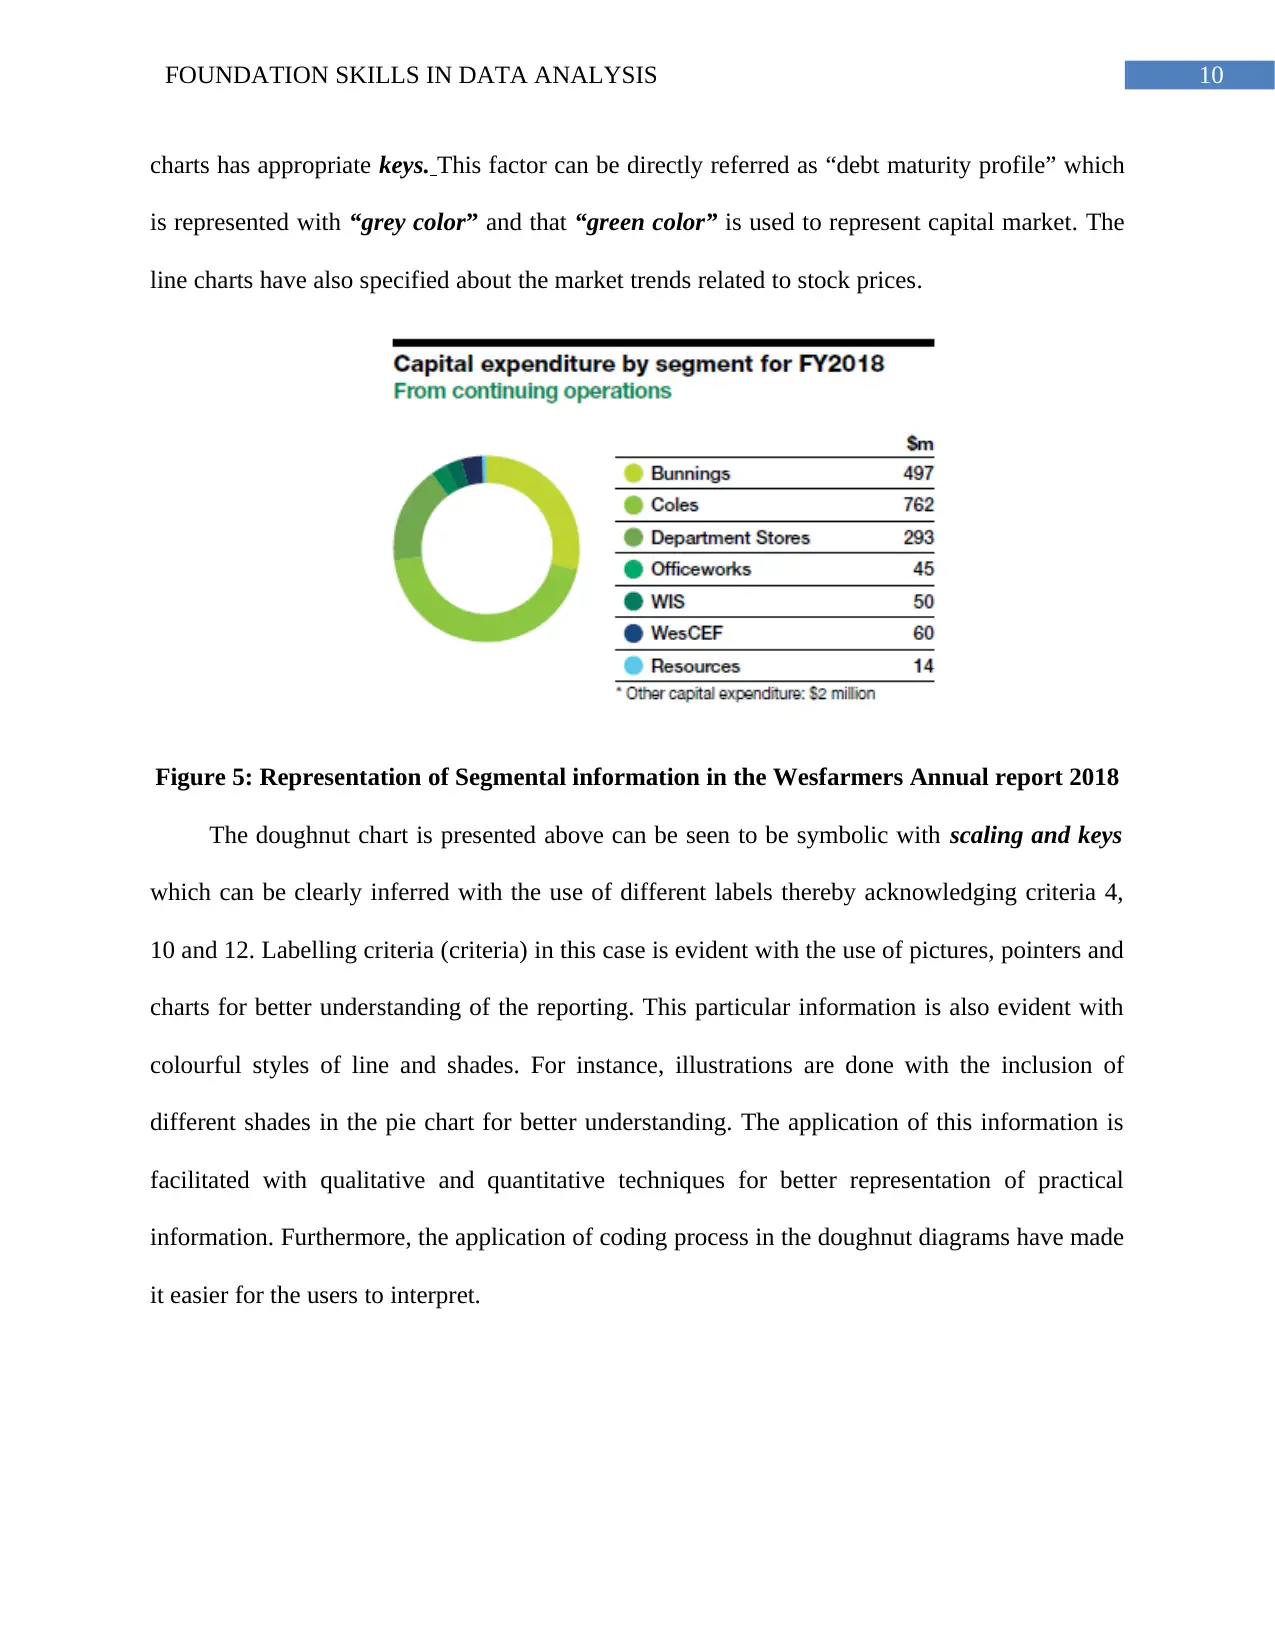
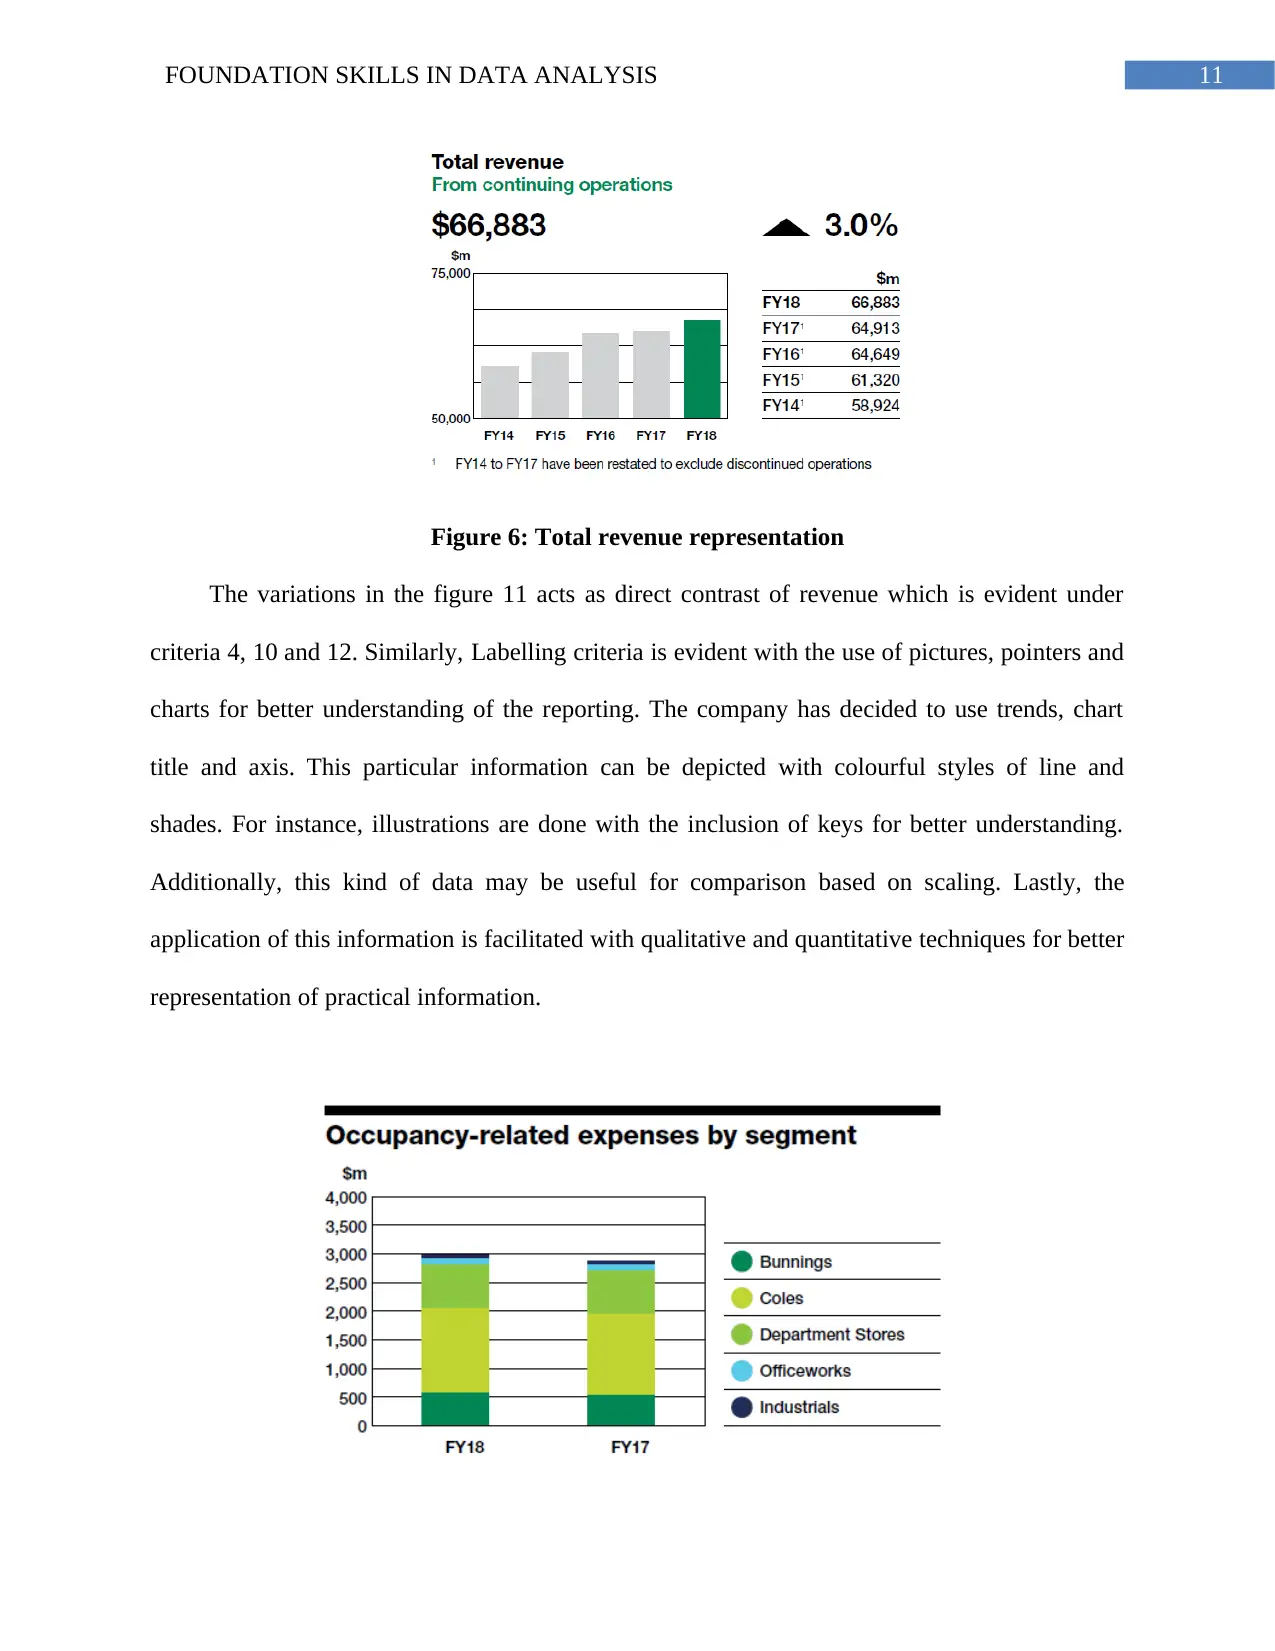
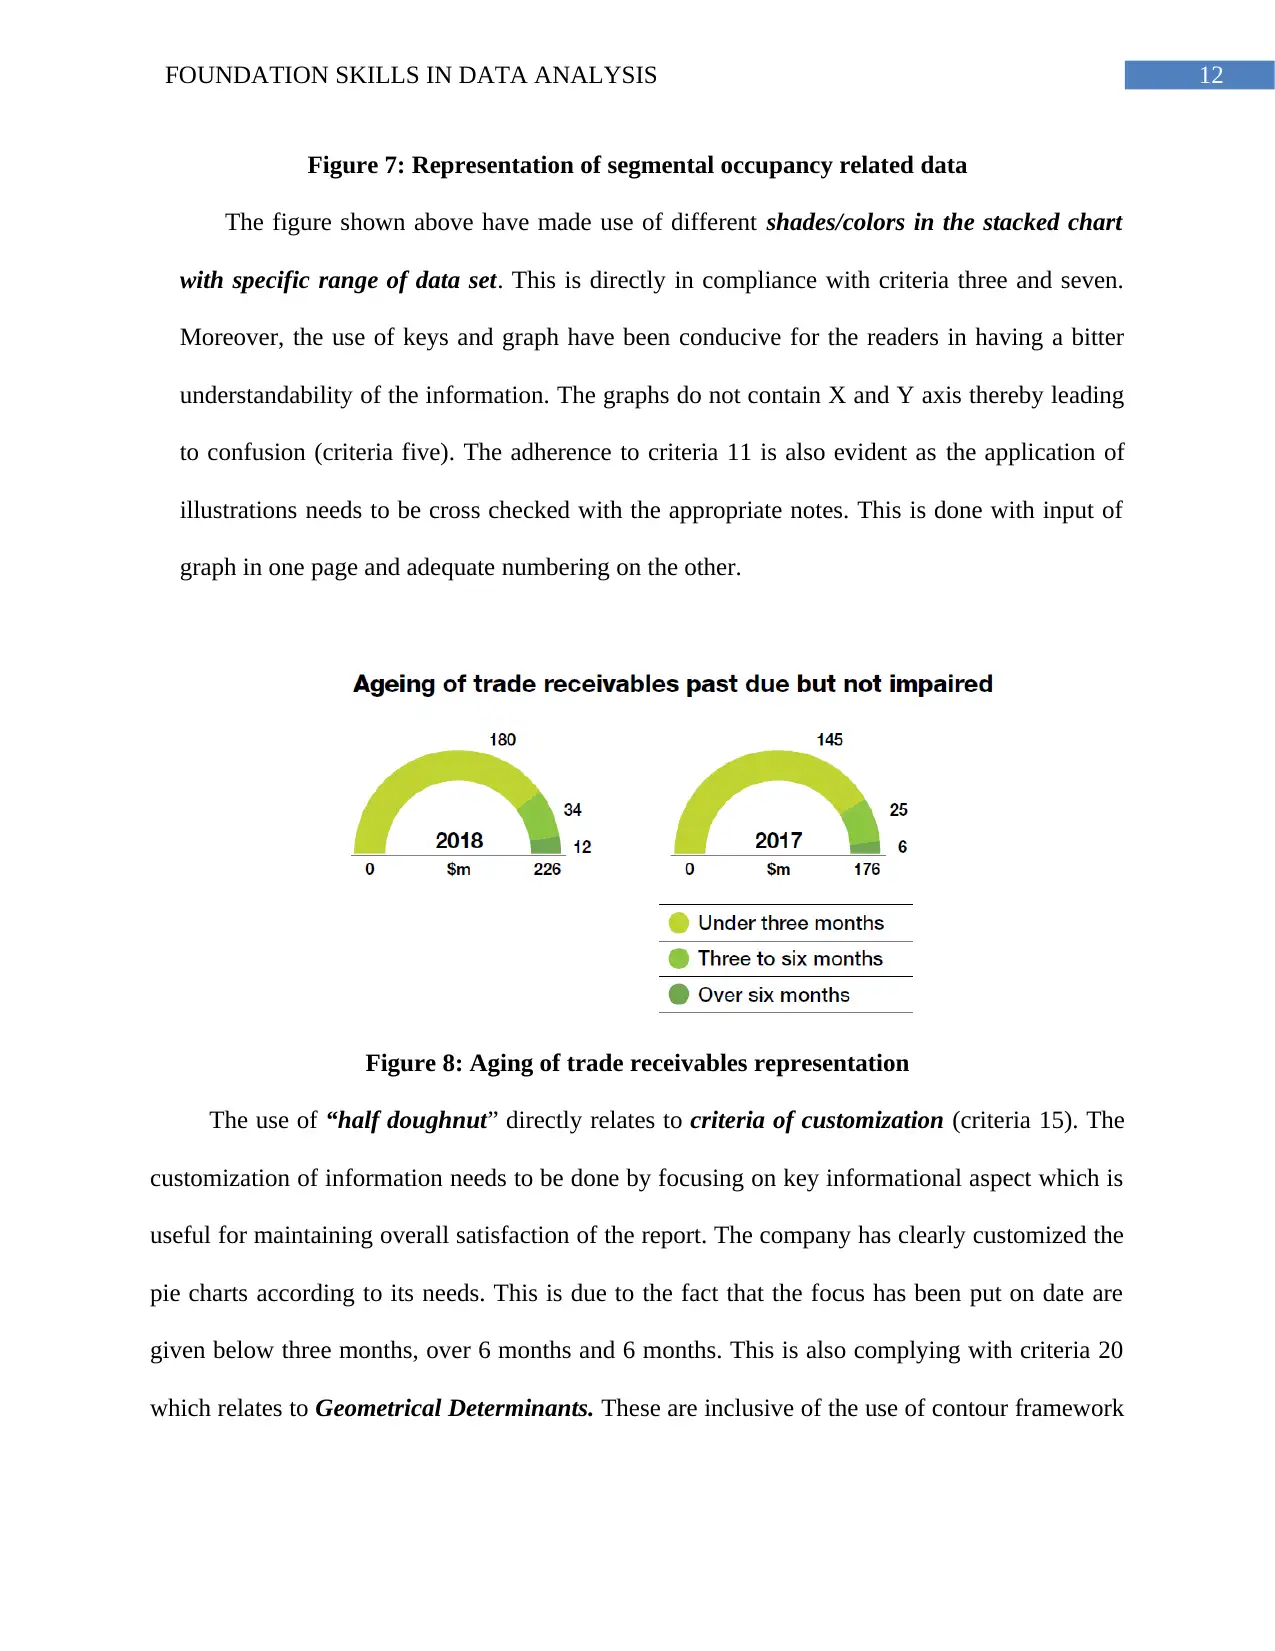
This report provides a comprehensive analysis of the visual presentation of data within the Wesfarmers Annual Report 2018. It begins by establishing evaluation criteria for effective data visualization, including the use of numbers, graphics, layout, labeling, graph references, variable usage, range information, design, line graphs, keys, positioning, scaling, presentation, encoding, customization, and the integration of data. The report then applies these criteria to evaluate various charts and graphs used in the Wesfarmers report, such as doughnut charts, bar graphs, and line graphs, assessing their effectiveness in communicating financial and operational information. The analysis highlights how Wesfarmers utilizes different visual elements like colors, fonts, and layouts to present complex data in an accessible and understandable manner, ultimately demonstrating the company's adherence to the established criteria for impactful data representation. The report also discusses how the company uses different charts to represent greenhouse gas emissions, operating and financial information, segmental information, total revenue representation, and segmental occupancy-related data. The analysis also covers the use of half-doughnut charts to represent the aging of trade receivables and the use of non-financial information in relation to operating lease commitments. Overall, the report offers a detailed assessment of the strengths and weaknesses of the visual communication strategies employed in the annual report, and how they align with the established criteria.
tabler-icon-diamond-filled.svg

Contribute Materials

Your contribution can guide someone’s learning journey. Share your documents today.
Document Page
Running head: FOUNDATION SKILLS IN DATA ANALYSIS
Foundation Skills in Data Analysis
Name of the Student:
Name of the University:
Authors Note:
tabler-icon-diamond-filled.svg

Secure Best Marks with AI Grader

Need help grading? Try our AI Grader for instant feedback on your assignments.
Document Page
2FOUNDATION SKILLS IN DATA ANALYSIS
Table of Contents
Part A: Evaluation Criteria Development..............................................................................3
Part B: Evaluation of Wesfarmers Annual Report, 2018.......................................................5
Document Page
3FOUNDATION SKILLS IN DATA ANALYSIS
Part A: Evaluation Criteria Development
The content of the report and formatting aids in better understanding of various results
and evaluations. Therefore, the use of certain visualisation is conducive for knowing about
strategy precedence, performance and financial position of the company. Some of the most
noteworthy evaluation criteria in any financial report can include the following components:
1. Numbers- The representation of different types of statistical information are done with the
use of radar chart, pie chart, Bar graph and line graph
2. Graphics- The graphical data representation comprises of histograms, scatter charts, line
graphs and bar charts. The rational for this is due to better understanding of information. For
instance, pictorial graph is essential for improving communication.
3. Layout- This refers to integration of information in form of pictures, colours and several
other vital elements which is appealing to the users of the report.
4. Labelling- Labelling criteria is evident with the use of pictures, pointers and charts for better
understanding of the reporting. This also includes line of trends, chart title and axis.
5. Graph reference- This is conducive for better referencing of information in form of plot area
by positioning the Y axis and x-axis, titles and gridlines for differentiating the overall
information.
6. Effective use of variables- The graphical representation of the data is necessary for defining
the variables at each axis and in accessing of the information with ease
7. Specific range information-The inclusion of data requires certain range of information
which can include upper and lower limits along with cross-sectional or longitudinal type of
data.
Document Page
4FOUNDATION SKILLS IN DATA ANALYSIS
8. Background in design-This refers to the adoption of a specific format which is appealing and
comforting to the eyes of the readers so that they are able to hold the interest in reading the
information.
9. Line graph- This is considered helpful for assessment of trends at specific time period and
equal intervals. It is also important for comparing information at various stages.
10. Keys- This particular information can be depicted with colourful styles of line and shades. For
instance, illustrations are done with the inclusion of keys for better understanding.
11. Positioning- The application of illustrations needs to be cross checked with the appropriate
notes. This is often done with input of graph in one page and adequate numbering on the
other.
12. Scaling- The application of this information is facilitated with qualitative and quantitative
techniques for better representation of practical information. Additionally, different set of data
may be useful for comparison based on scaling.
13. Presentation and fonts- The use of forms and presentability of information is depicted to be
useful for better understanding of information. For example, company like this Wesfarmers
have used colour fonts and bold texts for better presentation of information.
14. Process of encoding- The encoding process often refers to use of financial data such as
numerical figures, replies and code for maintaining the straightforwardness of graphical
representation.
15. Customisation- The customisation of information needs to be done by focusing on key
informational aspect which is useful for maintaining overall satisfaction of the report.
16. Non-financial and financial analysts- These analyses along with visual representation
provides better understanding of financial report to the users.
tabler-icon-diamond-filled.svg

Secure Best Marks with AI Grader

Need help grading? Try our AI Grader for instant feedback on your assignments.
Document Page
5FOUNDATION SKILLS IN DATA ANALYSIS
17. Integration of data- Data integration is a key aspect in reporting. The integration of data in
form of graphs and charts is not only appealing but also necessary for outlining significant
facts and figures in the financial report.
18. Appropriateness of the graphical representation- The inclusion of complexity with data
and numbers needs to be presented in a different manner. For example, in various stages of
reporting several companies often use pie chart and Gantt chart.
19. Information Association- The information Association relates to those concepts where a
graph or chart may have two different styles for presentation of any information. This is often
seen to be conducive for investigation for particular part. Generally, using of shades in data is
useful for information Association. Furthermore, population and age can be presented with
the use of bar or charts by incorporating different shades.
20. Geometric assertions- The previous studies have inferred that observations are often driven
with curving properties. These are inclusive of the use of contour framework which helps in
decrypting complex information into multiple units with the assistance of visual properties
namely orientation, location and size.
Part B: Evaluation of Wesfarmers Annual Report, 2018
The use of graphs in the report is associated with background, design, sophistication and
style” (Criteria no.8). This criterion further refers to the adoption of a specific format which is
appealing and comforting to the eyes of the readers so that they are able to hold the interest in
reading the information. The incorporation of such an information is considered with having a
visually appealing impact in the mind of the readers. The integration of varied range of graphs
can be clearly identified with the use of “vertical bar graph, horizontal bar graph, stacked bar
Document Page
6FOUNDATION SKILLS IN DATA ANALYSIS
graph, closed bar graph doughnut chart, line graph and pie chart”. The application of some of
the information can be also discerned with the use of graphs by the company.
The overall reporting has been evident with the application of “sharp and edgy contours
(criteria 20)”.
Figure: Wesfarmers using Doughnut Chart for Performance Review
The above information is related to value creation and wealth creation by the company.
Therefore, the relevant criteria are such as color, fonts, graphics and layout (criteria 2, 3 and
13)” is related to mixing of different types of colors in the doughnut chart. Moreover, the
doughnut in the outside is consisting of a different shade than the rest of the figure. The use of
shade white and black has been useful in identifying wealth creation followed by another
doughnut chart which has used use of green. The application of these doughnut chart also acts as
the symbol of scaling which is directly in compliance with criteria 12. Therefore, the company
has met the quantitative and qualitative numeric aspect of data for visual representation in the
individual categories.
Document Page
7FOUNDATION SKILLS IN DATA ANALYSIS
Figure 2: Yearly Review of Wesfarmers performance
The figure shown above clearly suggests the use of colour green which is directly in
relation to criteria 13 of the report. The use of the above figure has further shown the
“significance of graphics”. This component is directly associated to be adhering with criteria
one, criteria two criteria three. The use of effectiveness of variables can be also seen with the
compliance of criteria six. The positioning of column/bar charts are further stated to criteria 11
and criteria 17. Therefore, the users of the report can directly extract and information from the
figures to analyze. The variations in the reporting can be directly checked from the graphical
tabler-icon-diamond-filled.svg

Paraphrase This Document

Need a fresh take? Get an instant paraphrase of this document with our AI Paraphraser
Document Page
8FOUNDATION SKILLS IN DATA ANALYSIS
representation of information. Similarly, the application of illustrations needs to be cross checked
with the appropriate notes.
Figure 3: Illustration of Green House Gas Emissions of Wesfarmers
The graph shown above represents to changes in numbers in terms of greenhouse
emissions. The use of the information clearly relates to with the use of Bar graph with
histogram which is directly relevant to the discussions of criteria one. This is also evident
with the application of graphical data as it comprises of comprises of histograms and bar
charts. The rational for this is due to better understanding of information. The adherence to
the criteria two is seen with the graphical data representation comprising of histograms, line
Document Page
9FOUNDATION SKILLS IN DATA ANALYSIS
graphs and bar charts. The rational for this is due to better understanding of information. For
instance, pictorial graph is essential for improving communication.
Figure 4: Representation of Operating and financial information
The figure illustrated above comprises of combination of charts, line charts, graphs and
numbers. This is directly relevant to the use of criteria one and criteria two mentioned in the first
section. We can clearly infer that criteria four has not been met as there is vagueness in the mind
of users for non-presence of any label. It can be clearly inferred that the use of language sand bar
Document Page
10FOUNDATION SKILLS IN DATA ANALYSIS
charts has appropriate keys. This factor can be directly referred as “debt maturity profile” which
is represented with “grey color and that “green color” is used to represent capital market. The
line charts have also specified about the market trends related to stock prices.
Figure 5: Representation of Segmental information in the Wesfarmers Annual report 2018
The doughnut chart is presented above can be seen to be symbolic with scaling and keys
which can be clearly inferred with the use of different labels thereby acknowledging criteria 4,
10 and 12. Labelling criteria (criteria) in this case is evident with the use of pictures, pointers and
charts for better understanding of the reporting. This particular information is also evident with
colourful styles of line and shades. For instance, illustrations are done with the inclusion of
different shades in the pie chart for better understanding. The application of this information is
facilitated with qualitative and quantitative techniques for better representation of practical
information. Furthermore, the application of coding process in the doughnut diagrams have made
it easier for the users to interpret.
tabler-icon-diamond-filled.svg

Secure Best Marks with AI Grader

Need help grading? Try our AI Grader for instant feedback on your assignments.
Document Page
11FOUNDATION SKILLS IN DATA ANALYSIS
Figure 6: Total revenue representation
The variations in the figure 11 acts as direct contrast of revenue which is evident under
criteria 4, 10 and 12. Similarly, Labelling criteria is evident with the use of pictures, pointers and
charts for better understanding of the reporting. The company has decided to use trends, chart
title and axis. This particular information can be depicted with colourful styles of line and
shades. For instance, illustrations are done with the inclusion of keys for better understanding.
Additionally, this kind of data may be useful for comparison based on scaling. Lastly, the
application of this information is facilitated with qualitative and quantitative techniques for better
representation of practical information.
Document Page
12FOUNDATION SKILLS IN DATA ANALYSIS
Figure 7: Representation of segmental occupancy related data
The figure shown above have made use of different shades/colors in the stacked chart
with specific range of data set. This is directly in compliance with criteria three and seven.
Moreover, the use of keys and graph have been conducive for the readers in having a bitter
understandability of the information. The graphs do not contain X and Y axis thereby leading
to confusion (criteria five). The adherence to criteria 11 is also evident as the application of
illustrations needs to be cross checked with the appropriate notes. This is done with input of
graph in one page and adequate numbering on the other.
Figure 8: Aging of trade receivables representation
The use of “half doughnut” directly relates to criteria of customization (criteria 15). The
customization of information needs to be done by focusing on key informational aspect which is
useful for maintaining overall satisfaction of the report. The company has clearly customized the
pie charts according to its needs. This is due to the fact that the focus has been put on date are
given below three months, over 6 months and 6 months. This is also complying with criteria 20
which relates to Geometrical Determinants. These are inclusive of the use of contour framework
Document Page
13FOUNDATION SKILLS IN DATA ANALYSIS
which helps in decrypting complex information into multiple units with the assistance of visual
properties namely orientation, location and size.
Figure 9: Operating lease commitment representation
The compliance of criteria 16 is evident in the above diagram as it has use non-financial
information. The relevance of such a graphical information can be traced with the use of criteria
18 which stated about incorporation of double Stack vertical bar graphs and eight also suggests
the incorporation of criteria 19 where the information Association relates to those concepts
where a graph or chart may have two different styles for presentation of any information.
Figure 10: Key financial indicators
tabler-icon-diamond-filled.svg

Paraphrase This Document

Need a fresh take? Get an instant paraphrase of this document with our AI Paraphraser
Document Page
14FOUNDATION SKILLS IN DATA ANALYSIS
In a similar manner the representation of key financial indicators relates to a “process of
encoding (criteria 14)”. This is directly relevant with the encoding process often refers to use
of financial data such as numbers, responses and code for maintaining the straightforwardness
of graphical representation. The use of criteria 15 is also seen to be evident in this aspect. The
customisation of information needs to be done by focusing on key informational aspect which
is useful for maintaining overall satisfaction of the report.
Figure 11: Graphical illustration of greenhouse emission
The above diagram clearly shows the use of criteria 17 as this is evident with the criteria
integration of the information”. Such information can be considered with bar graph and line
Document Page
15FOUNDATION SKILLS IN DATA ANALYSIS
graph. Data integration is a key aspect in reporting. The integration of data in form of graphs and
charts is not only appealing but also necessary for outlining significant facts and figures in the
financial report. The relevance of such a graphical information can be traced with the use of
criteria 18 which stated about incorporation of two bar graphs. Lastly the information published
is also seen to be in direct relevance to criteria 19 where the information Association relates to
those concepts where a graph or chart with one or more styles.
Figure 12: Representation of graph for waste disposal
The relevance of such a graphical information can be traced with the use of criteria 18
which stated about incorporation of double Stack vertical bar graphs and eight also suggests the
incorporation of criteria 19 where the information Association relates to those concepts where a
graph or chart may have two different styles for presentation of any information. The inclusion
of complexity with data and numbers needs to be presented in form of double stacked bar graph
with histogram. Moreover, in various stages of reporting company has used both disposed
income and recycled income. This assists in further enhancement of readability and usability of
Document Page
16FOUNDATION SKILLS IN DATA ANALYSIS
the report. This particular information can be also inferred with colourful styles of line and
shades.
chevron_up_icon
1 out of 16
circle_padding
hide_on_mobile
zoom_out_icon
logo.png

Your All-in-One AI-Powered Toolkit for Academic Success.

Available 24*7 on WhatsApp / Email

[object Object]