Report: Financial Analysis of Wesfarmers Ltd, Performance Review
VerifiedAdded on 2020/03/16
|10
|2427
|53
Report
AI Summary
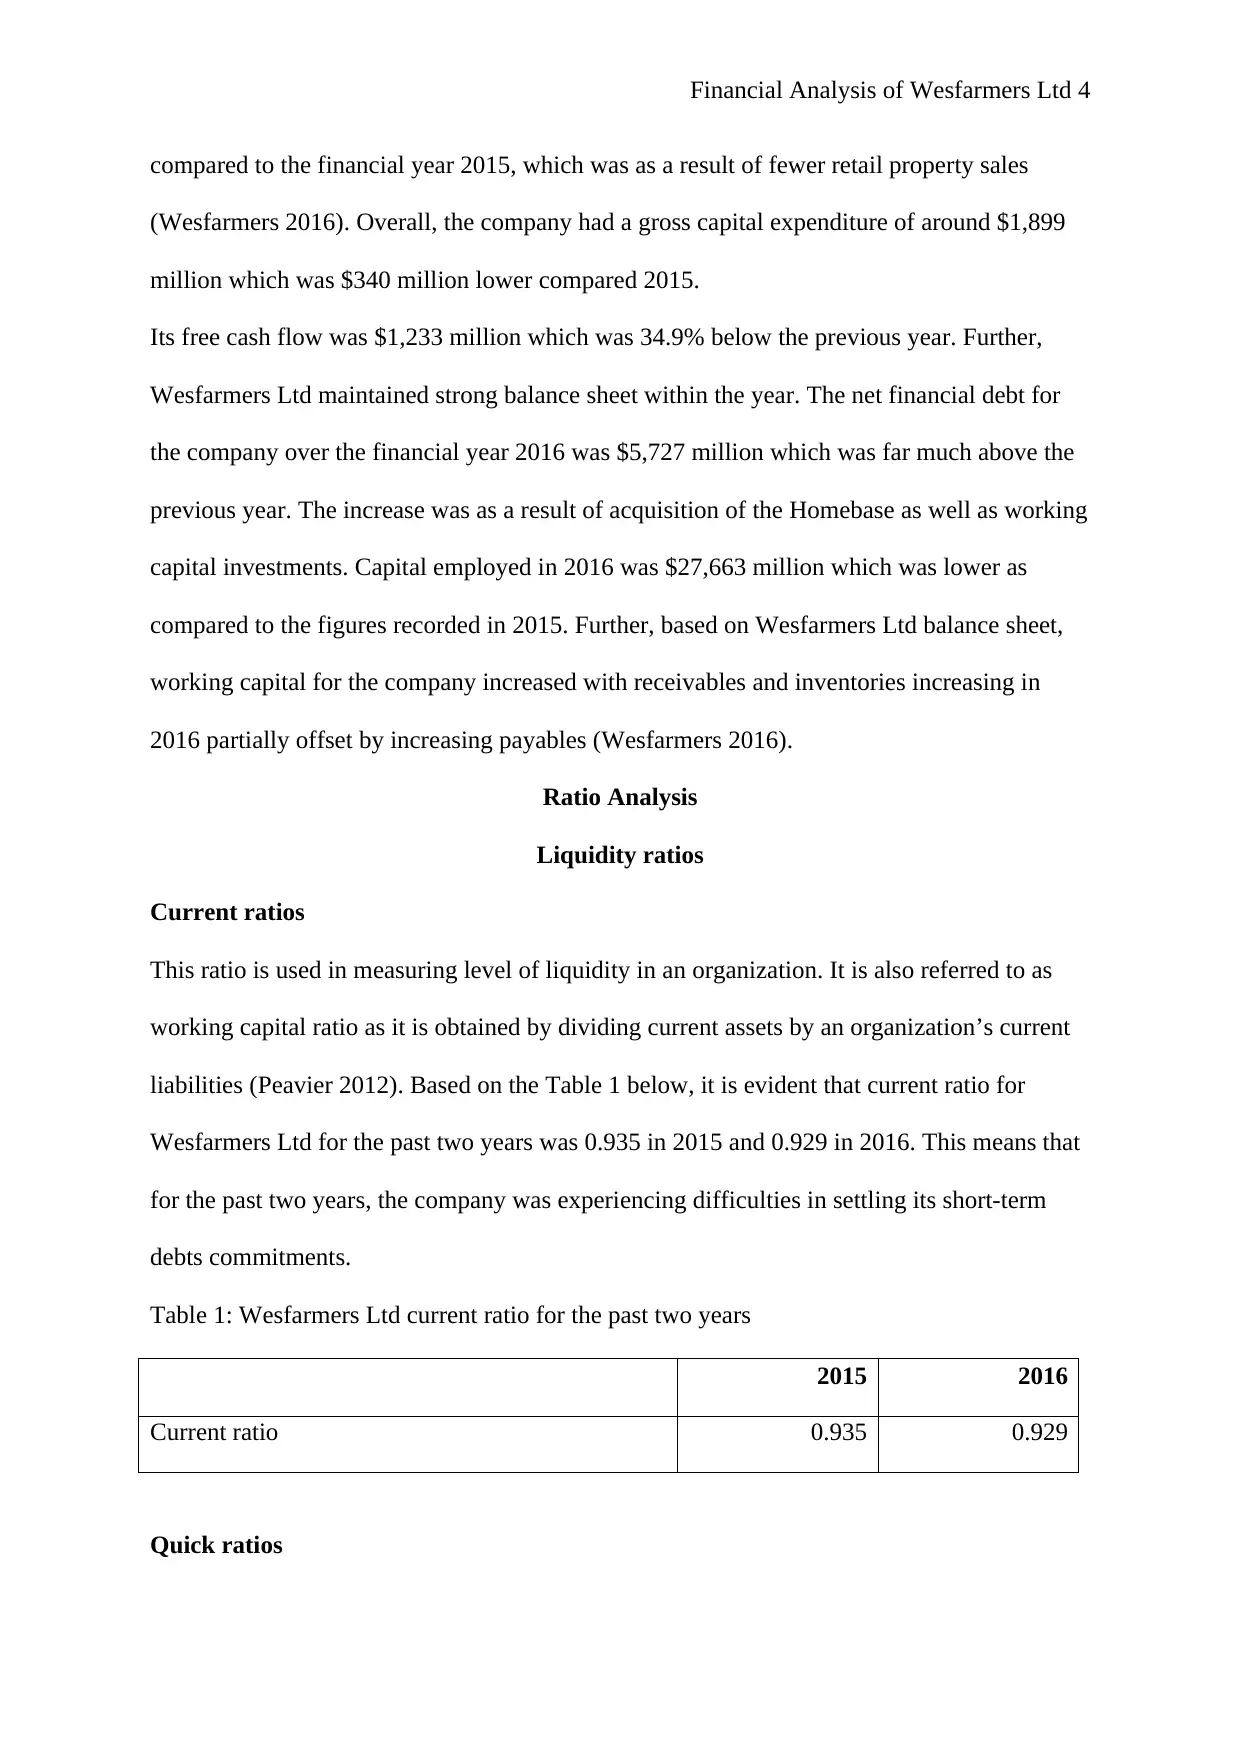
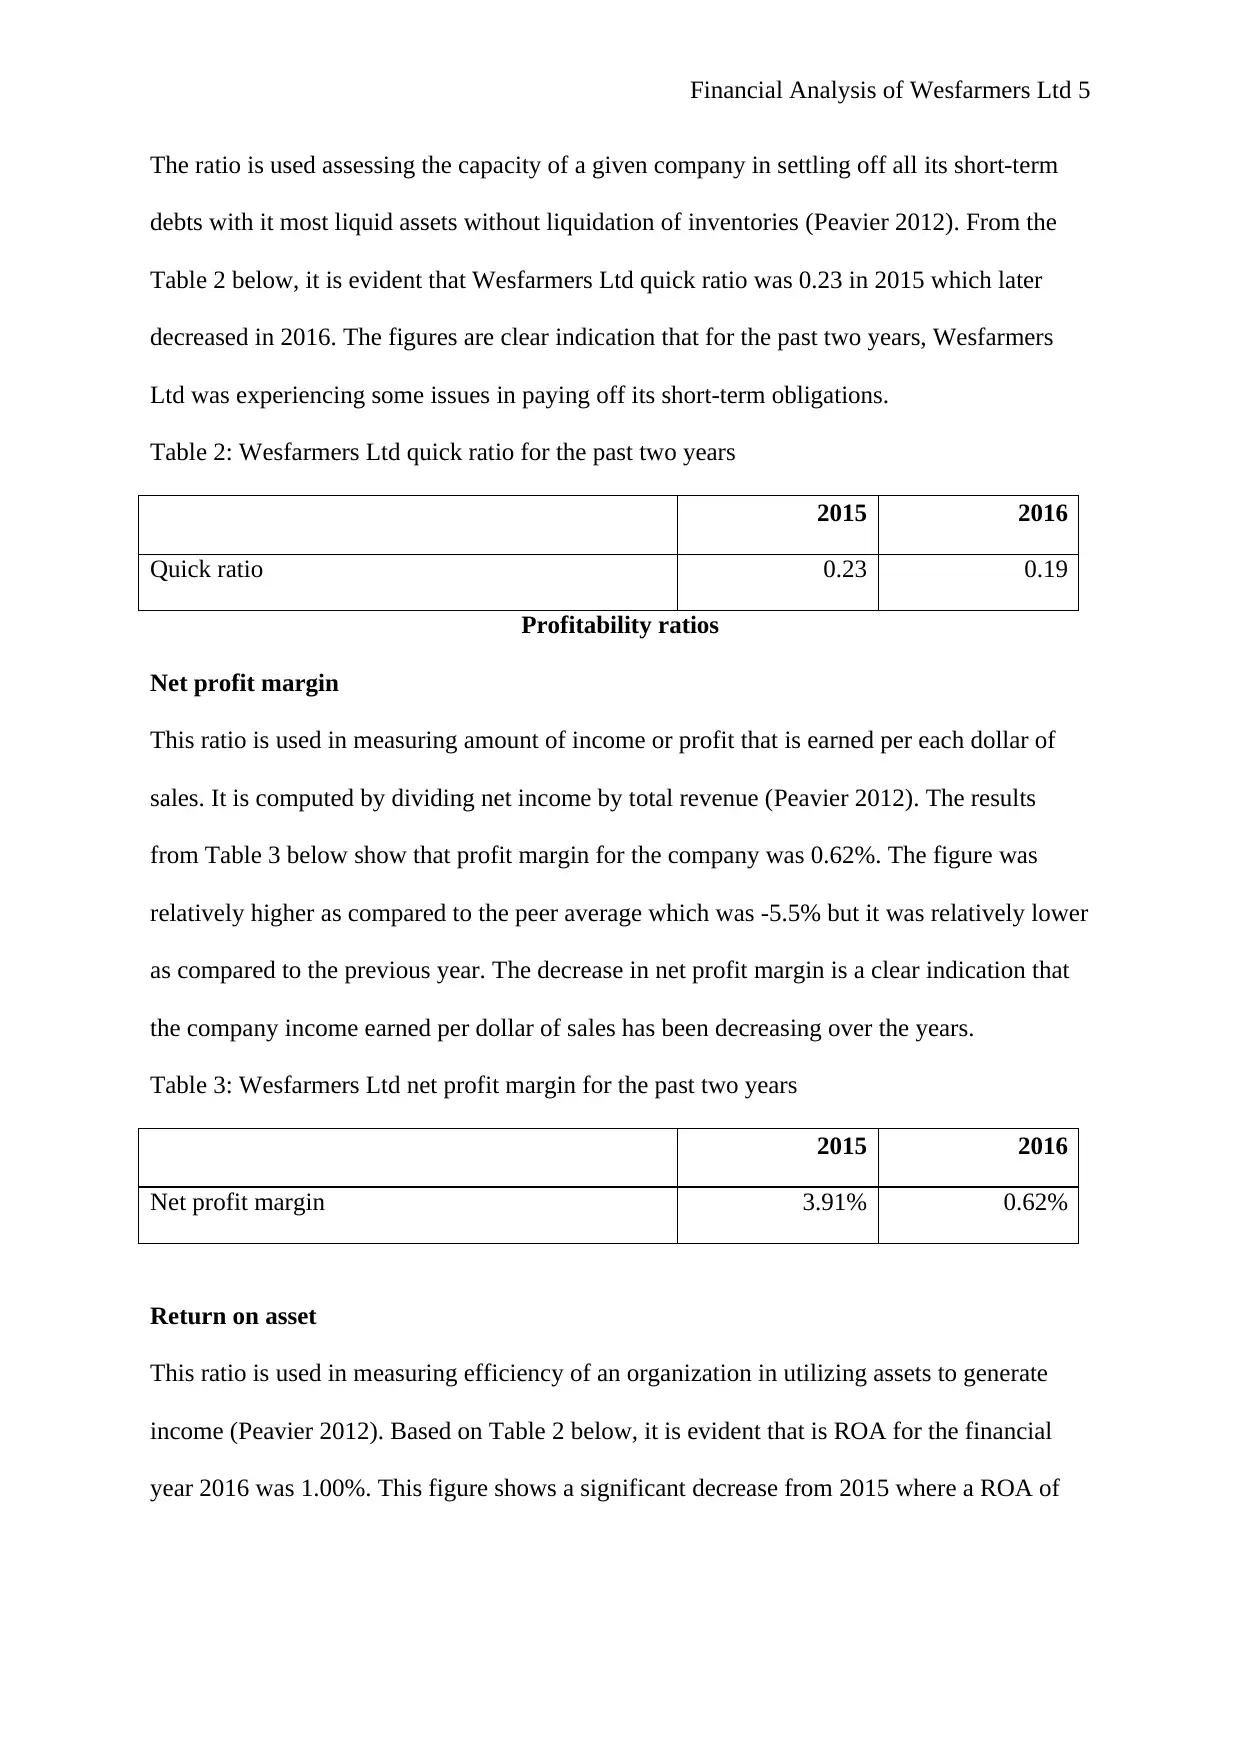
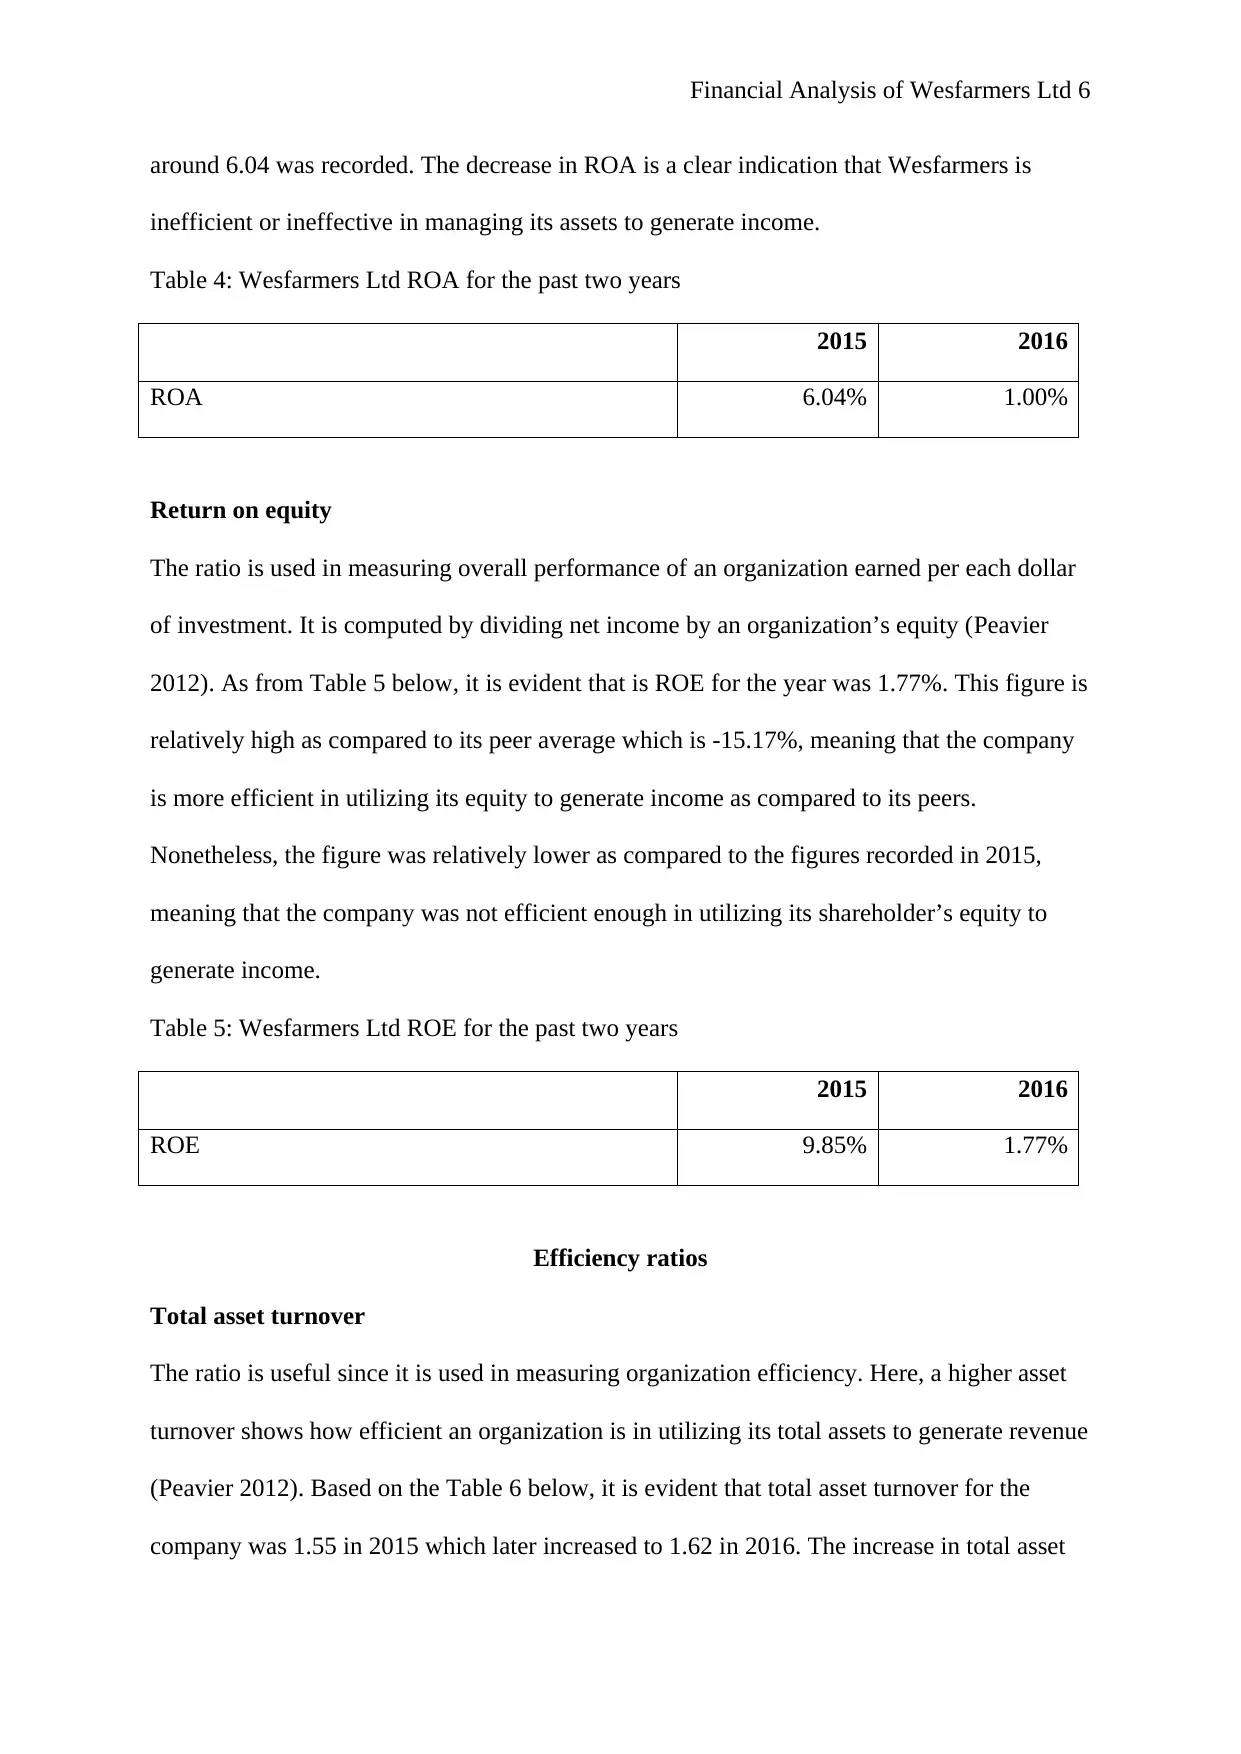
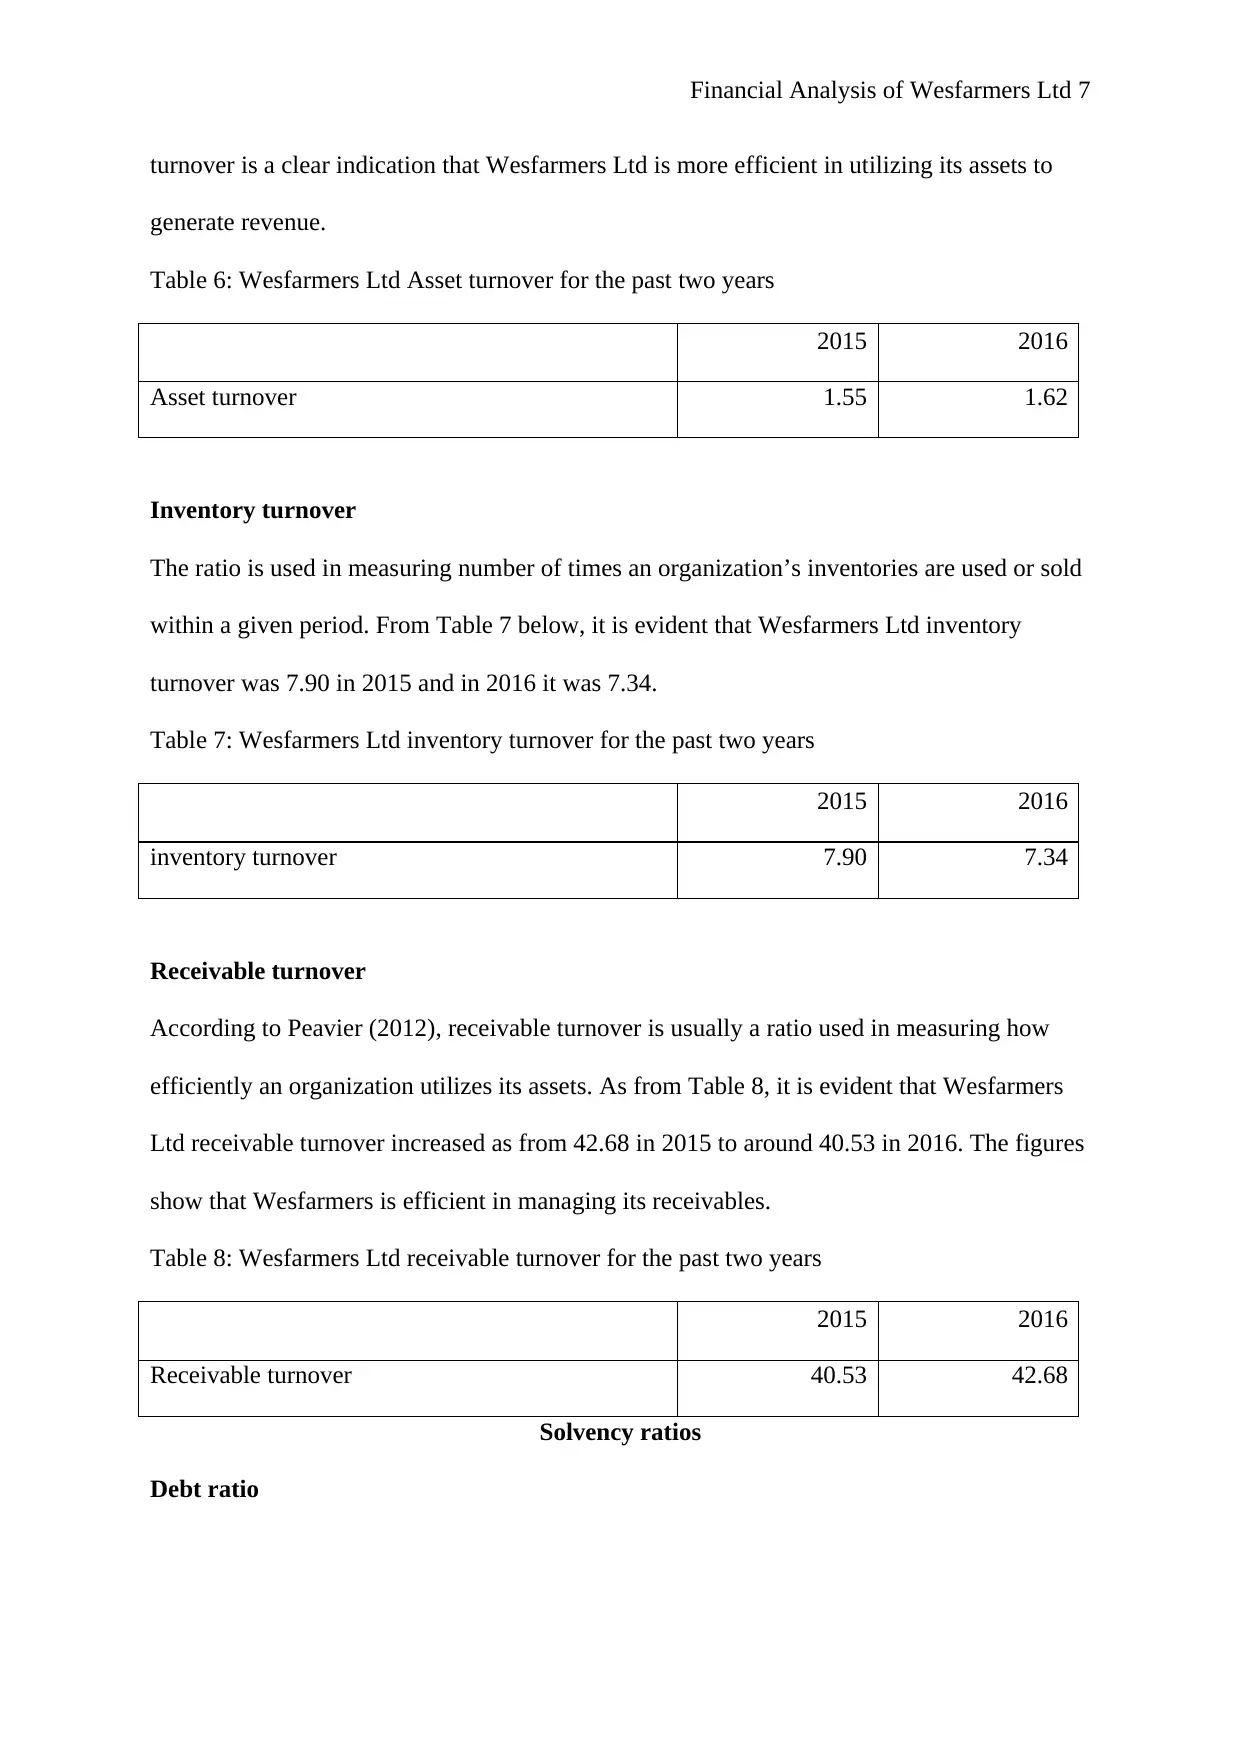
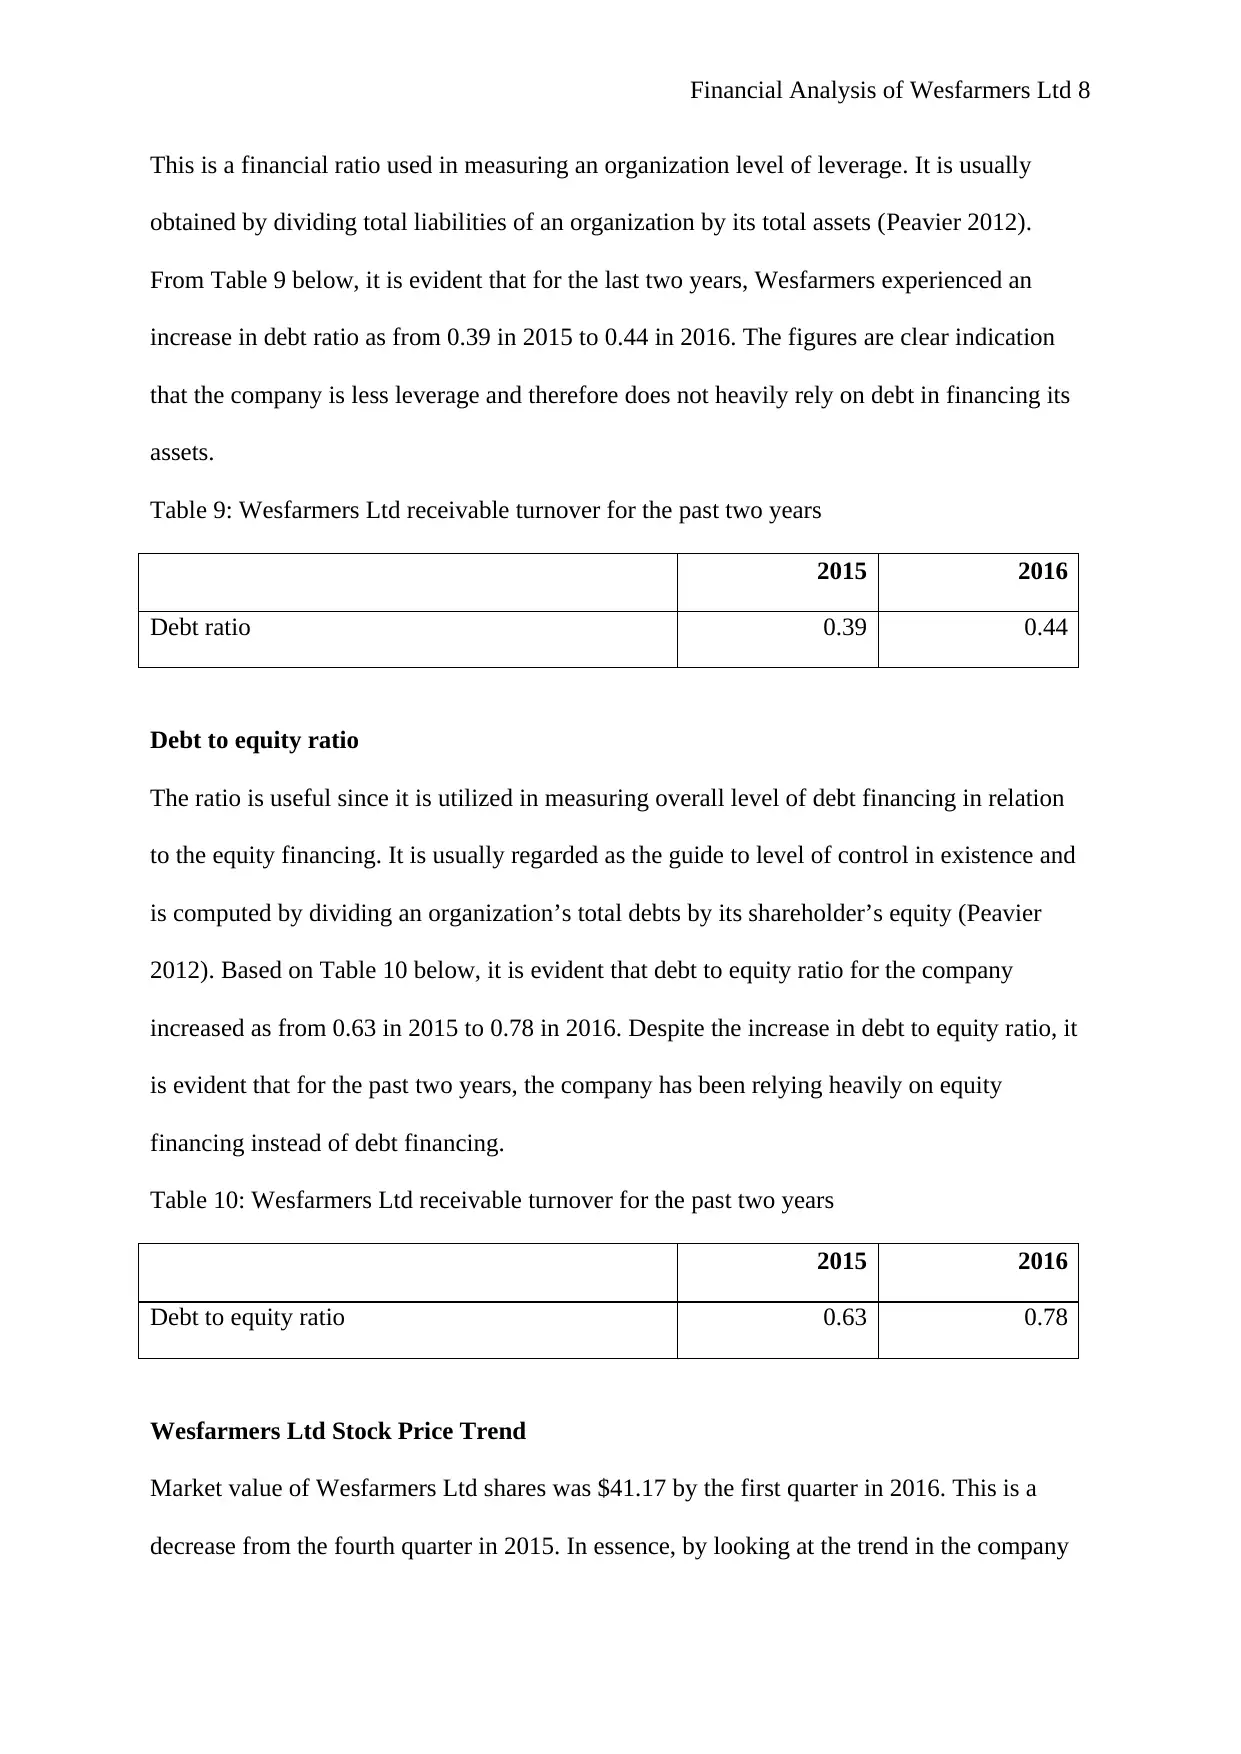
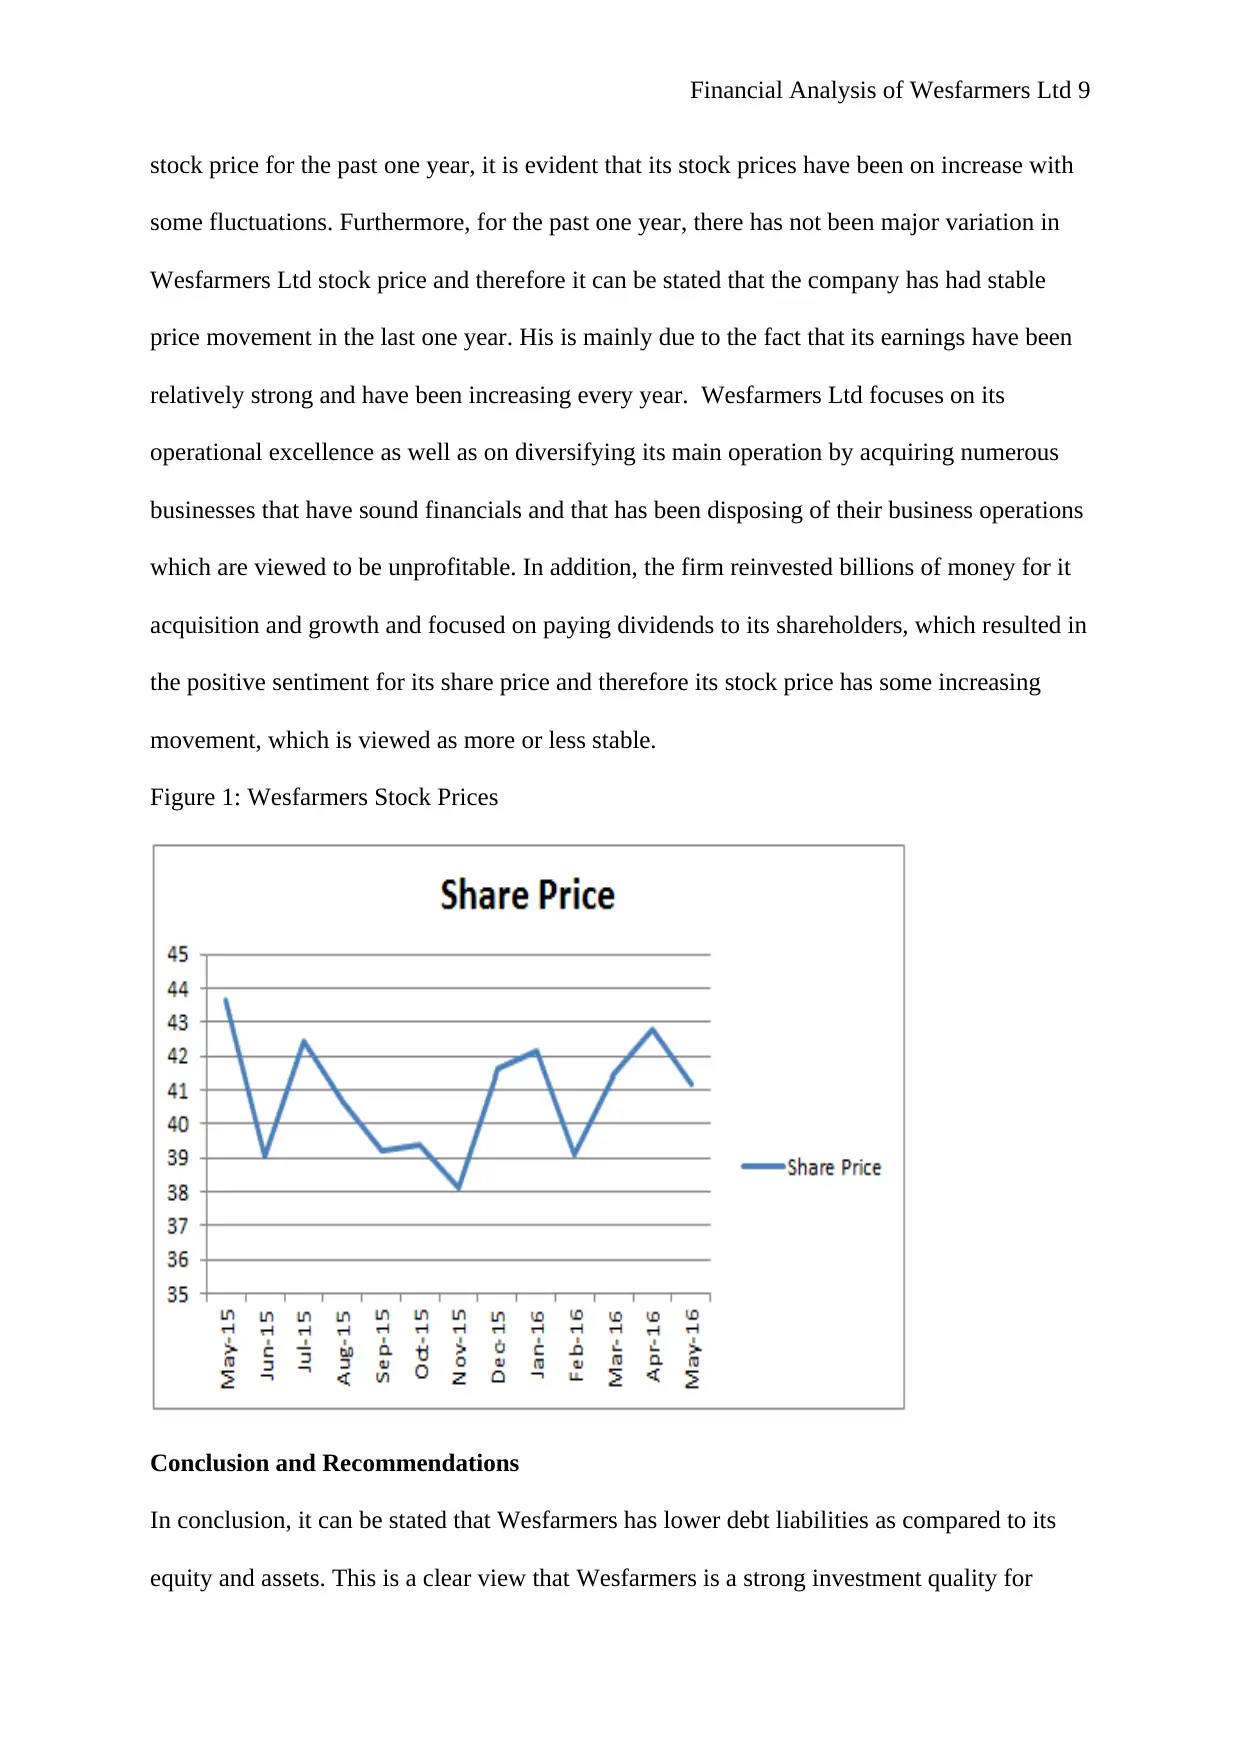
This report provides a financial analysis of Wesfarmers Ltd, examining its performance during the 2015 and 2016 financial years. The analysis focuses on key areas including efficiency, liquidity, solvency, and profitability, providing valuable insights for potential investors. The report utilizes data from the company's annual reports, including consolidated figures from the balance sheet, statement of cash flow, and income statement. It provides an overview of Wesfarmers Ltd's profile as a major conglomerate in Australia, operating across diverse sectors such as retail, resources, and insurance. The report includes financial statement analysis, ratio analysis (current, quick, net profit margin, ROA, ROE, asset turnover, inventory turnover, receivable turnover, debt ratio, and debt to equity ratio), and stock price trend analysis. The findings reveal the company's financial standing, challenges, and overall performance, offering recommendations to potential investors regarding investment decisions. The analysis highlights Wesfarmers Ltd’s strengths in asset turnover and its stable stock price trend, whilst also pointing out areas for improvement in liquidity and profitability ratios.

Financial Analysis of Wesfarmers Ltd 1
FINANCIAL ANALYSIS OF WESFARMERS LTD
Student’s Name
Course
Lecturer
Institution
Date
FINANCIAL ANALYSIS OF WESFARMERS LTD
Student’s Name
Course
Lecturer
Institution
Date
Paraphrase This Document
Need a fresh take? Get an instant paraphrase of this document with our AI Paraphraser

Financial Analysis of Wesfarmers Ltd 2
Introduction
The aim of this report is to examine financial performance of Wesfarmers Ltd over the year
2015 and 2016 financial years. The area of efficiency, liquidity, solvency and profitability
would be assessed and which would be of great interest to potential investors who are key
stakeholders in this case and who invests in highly competitive business conditions. Data
from the company’s 2015 and 2016 annual reports would be used in presenting and analysing
the company financial performance and in making inferences or recommendations about its
financial prospects. In essence, only consolidated figures are used including analysis of
balance sheet, statement of cash flow and income statement. Further, overall summary with
key recommendations about the company on whether potential investors should invest in the
company or not will be made.
Wesfarmers Ltd Profile
Wesfarmers Ltd is the largest conglomerates in the globe operating over six business
segments in Australia, whose headquarter is in Perth, Australia. Furthermore, Wesfarmers
Ltd is one of the highly reputable firms listed on ASX, with around 500,000 shareholders and
200,000 employees (Wesfarmers 2016). It was usually established as small Western
Australian Farmer Co-operative but has not diversified into numerous sectors like resource,
insurance and retail and is currently generating revenue of more than $50 billion per year.
Basically, Wesfarmers Ltd is usually a diversified firm operating departmental stores, coal
mining, supermarkets, officer supplies and home improvement, chemicals, industrial and
safety products, insurance, fertilize and energy products. It most common brands of this
company include Coles, Kmart and Target. In addition, Wesfarmers Ltd is known as a highly
profit making firm in Australia. Wesfarmers competes with Myer Holdings, ADAIRS FPO,
Reject Shop and JB Hi and operates over 787 Coles supermarket and offer credit cards, car,
home, landlord and life insurance products. It also has over 865 liquor stores under Vintage

Financial Analysis of Wesfarmers Ltd 3
Cellars, First Choice Liquor and Liquorland (Wesfarmers 2016). The company supplies
building materials, technology products, and retail office and also supplies ammonium
nitrate, sodium cyanide, wood plastic composite decking, industrial chemicals, polyvinyl
chloride resins as well as sodium.
Financial Analysis
Financial analysis is very crucial in this case since it help potential investors in making better
decisions as to whether to invest in Wesfarmers Ltd. While conducting a financial analysis,
three categories are used, that is financial statement analysis, ratio analysis as well as stock
movement analysis for the past two years.
Financial Statement analysis
Based on the company income statement, it is evident that Wesfarmers Ltd has a net profit of
around $407 million in the financial year 2016. This was relatively lesser as compared to the
previous year. In addition, a strong performance across most of it business are found to have
been offset by the challenging trading situations as well as restructuring activities in the
Target as well as the impacts of relatively lower commodity prices in the resources business.
Despite relatively lower net income, Wesfarmers reported a net sale of around
$65,981million in the financial year 2016 which was mostly attributed by its continued
efforts to invest in the customer value, stores, service, improved merchandise ranges and
online ranges in delivering improved returns and long-term growth (Wesfarmers 2016).
Further, based on its cash flow statement, it is evident that Wesfarmers reported an operating
cash flow of around $3,365 million in the financial year 2016 which was $426 or 11.2% far
much below the previous year. This lower operating cash flow mostly displayed a higher
working capital in retail portfolio. In addition, its net capital expenditure was around $1,336
million which was 13.9% lower as compared to the previous year. Further, proceeds from the
disposals for the company in 2016 was $563 million which was also relatively lower
⊘ This is a preview!⊘
Do you want full access?
Subscribe today to unlock all pages.

Trusted by 1+ million students worldwide

Financial Analysis of Wesfarmers Ltd 4
compared to the financial year 2015, which was as a result of fewer retail property sales
(Wesfarmers 2016). Overall, the company had a gross capital expenditure of around $1,899
million which was $340 million lower compared 2015.
Its free cash flow was $1,233 million which was 34.9% below the previous year. Further,
Wesfarmers Ltd maintained strong balance sheet within the year. The net financial debt for
the company over the financial year 2016 was $5,727 million which was far much above the
previous year. The increase was as a result of acquisition of the Homebase as well as working
capital investments. Capital employed in 2016 was $27,663 million which was lower as
compared to the figures recorded in 2015. Further, based on Wesfarmers Ltd balance sheet,
working capital for the company increased with receivables and inventories increasing in
2016 partially offset by increasing payables (Wesfarmers 2016).
Ratio Analysis
Liquidity ratios
Current ratios
This ratio is used in measuring level of liquidity in an organization. It is also referred to as
working capital ratio as it is obtained by dividing current assets by an organization’s current
liabilities (Peavier 2012). Based on the Table 1 below, it is evident that current ratio for
Wesfarmers Ltd for the past two years was 0.935 in 2015 and 0.929 in 2016. This means that
for the past two years, the company was experiencing difficulties in settling its short-term
debts commitments.
Table 1: Wesfarmers Ltd current ratio for the past two years
2015 2016
Current ratio 0.935 0.929
Quick ratios
Paraphrase This Document
Need a fresh take? Get an instant paraphrase of this document with our AI Paraphraser

Financial Analysis of Wesfarmers Ltd 5
The ratio is used assessing the capacity of a given company in settling off all its short-term
debts with it most liquid assets without liquidation of inventories (Peavier 2012). From the
Table 2 below, it is evident that Wesfarmers Ltd quick ratio was 0.23 in 2015 which later
decreased in 2016. The figures are clear indication that for the past two years, Wesfarmers
Ltd was experiencing some issues in paying off its short-term obligations.
Table 2: Wesfarmers Ltd quick ratio for the past two years
2015 2016
Quick ratio 0.23 0.19
Profitability ratios
Net profit margin
This ratio is used in measuring amount of income or profit that is earned per each dollar of
sales. It is computed by dividing net income by total revenue (Peavier 2012). The results
from Table 3 below show that profit margin for the company was 0.62%. The figure was
relatively higher as compared to the peer average which was -5.5% but it was relatively lower
as compared to the previous year. The decrease in net profit margin is a clear indication that
the company income earned per dollar of sales has been decreasing over the years.
Table 3: Wesfarmers Ltd net profit margin for the past two years
2015 2016
Net profit margin 3.91% 0.62%
Return on asset
This ratio is used in measuring efficiency of an organization in utilizing assets to generate
income (Peavier 2012). Based on Table 2 below, it is evident that is ROA for the financial
year 2016 was 1.00%. This figure shows a significant decrease from 2015 where a ROA of

Financial Analysis of Wesfarmers Ltd 6
around 6.04 was recorded. The decrease in ROA is a clear indication that Wesfarmers is
inefficient or ineffective in managing its assets to generate income.
Table 4: Wesfarmers Ltd ROA for the past two years
2015 2016
ROA 6.04% 1.00%
Return on equity
The ratio is used in measuring overall performance of an organization earned per each dollar
of investment. It is computed by dividing net income by an organization’s equity (Peavier
2012). As from Table 5 below, it is evident that is ROE for the year was 1.77%. This figure is
relatively high as compared to its peer average which is -15.17%, meaning that the company
is more efficient in utilizing its equity to generate income as compared to its peers.
Nonetheless, the figure was relatively lower as compared to the figures recorded in 2015,
meaning that the company was not efficient enough in utilizing its shareholder’s equity to
generate income.
Table 5: Wesfarmers Ltd ROE for the past two years
2015 2016
ROE 9.85% 1.77%
Efficiency ratios
Total asset turnover
The ratio is useful since it is used in measuring organization efficiency. Here, a higher asset
turnover shows how efficient an organization is in utilizing its total assets to generate revenue
(Peavier 2012). Based on the Table 6 below, it is evident that total asset turnover for the
company was 1.55 in 2015 which later increased to 1.62 in 2016. The increase in total asset
⊘ This is a preview!⊘
Do you want full access?
Subscribe today to unlock all pages.

Trusted by 1+ million students worldwide

Financial Analysis of Wesfarmers Ltd 7
turnover is a clear indication that Wesfarmers Ltd is more efficient in utilizing its assets to
generate revenue.
Table 6: Wesfarmers Ltd Asset turnover for the past two years
2015 2016
Asset turnover 1.55 1.62
Inventory turnover
The ratio is used in measuring number of times an organization’s inventories are used or sold
within a given period. From Table 7 below, it is evident that Wesfarmers Ltd inventory
turnover was 7.90 in 2015 and in 2016 it was 7.34.
Table 7: Wesfarmers Ltd inventory turnover for the past two years
2015 2016
inventory turnover 7.90 7.34
Receivable turnover
According to Peavier (2012), receivable turnover is usually a ratio used in measuring how
efficiently an organization utilizes its assets. As from Table 8, it is evident that Wesfarmers
Ltd receivable turnover increased as from 42.68 in 2015 to around 40.53 in 2016. The figures
show that Wesfarmers is efficient in managing its receivables.
Table 8: Wesfarmers Ltd receivable turnover for the past two years
2015 2016
Receivable turnover 40.53 42.68
Solvency ratios
Debt ratio
Paraphrase This Document
Need a fresh take? Get an instant paraphrase of this document with our AI Paraphraser

Financial Analysis of Wesfarmers Ltd 8
This is a financial ratio used in measuring an organization level of leverage. It is usually
obtained by dividing total liabilities of an organization by its total assets (Peavier 2012).
From Table 9 below, it is evident that for the last two years, Wesfarmers experienced an
increase in debt ratio as from 0.39 in 2015 to 0.44 in 2016. The figures are clear indication
that the company is less leverage and therefore does not heavily rely on debt in financing its
assets.
Table 9: Wesfarmers Ltd receivable turnover for the past two years
2015 2016
Debt ratio 0.39 0.44
Debt to equity ratio
The ratio is useful since it is utilized in measuring overall level of debt financing in relation
to the equity financing. It is usually regarded as the guide to level of control in existence and
is computed by dividing an organization’s total debts by its shareholder’s equity (Peavier
2012). Based on Table 10 below, it is evident that debt to equity ratio for the company
increased as from 0.63 in 2015 to 0.78 in 2016. Despite the increase in debt to equity ratio, it
is evident that for the past two years, the company has been relying heavily on equity
financing instead of debt financing.
Table 10: Wesfarmers Ltd receivable turnover for the past two years
2015 2016
Debt to equity ratio 0.63 0.78
Wesfarmers Ltd Stock Price Trend
Market value of Wesfarmers Ltd shares was $41.17 by the first quarter in 2016. This is a
decrease from the fourth quarter in 2015. In essence, by looking at the trend in the company

Financial Analysis of Wesfarmers Ltd 9
stock price for the past one year, it is evident that its stock prices have been on increase with
some fluctuations. Furthermore, for the past one year, there has not been major variation in
Wesfarmers Ltd stock price and therefore it can be stated that the company has had stable
price movement in the last one year. His is mainly due to the fact that its earnings have been
relatively strong and have been increasing every year. Wesfarmers Ltd focuses on its
operational excellence as well as on diversifying its main operation by acquiring numerous
businesses that have sound financials and that has been disposing of their business operations
which are viewed to be unprofitable. In addition, the firm reinvested billions of money for it
acquisition and growth and focused on paying dividends to its shareholders, which resulted in
the positive sentiment for its share price and therefore its stock price has some increasing
movement, which is viewed as more or less stable.
Figure 1: Wesfarmers Stock Prices
Conclusion and Recommendations
In conclusion, it can be stated that Wesfarmers has lower debt liabilities as compared to its
equity and assets. This is a clear view that Wesfarmers is a strong investment quality for
⊘ This is a preview!⊘
Do you want full access?
Subscribe today to unlock all pages.

Trusted by 1+ million students worldwide

Financial Analysis of Wesfarmers Ltd 10
potential investors. In addition, it can be concluded that Wesfarmers management is not
efficient enough in managing its assets and equity to generate income. This is evidence by a
relatively lower ROE and ROA over the years. Nonetheless, based on efficiency and
solvency ratios, it can be concluded that Wesfarmers Ltd has very strong performers with
significantly robust financial positions which is geared towards its improvement and growth
in near future. Therefore, it is recommendable that Wesfarmers could make a good
investment opportunity for potential investors who are looking forward to invest their money
in a financially strong and healthy company.
1 out of 10
Related Documents

Your All-in-One AI-Powered Toolkit for Academic Success.
+13062052269
info@desklib.com
Available 24*7 on WhatsApp / Email
Unlock your academic potential
Copyright © 2020–2025 A2Z Services. All Rights Reserved. Developed and managed by ZUCOL.