Comprehensive Financial Performance Report: Wesfarmers 2017 Analysis
VerifiedAdded on 2021/06/17
|7
|629
|21
Report
AI Summary
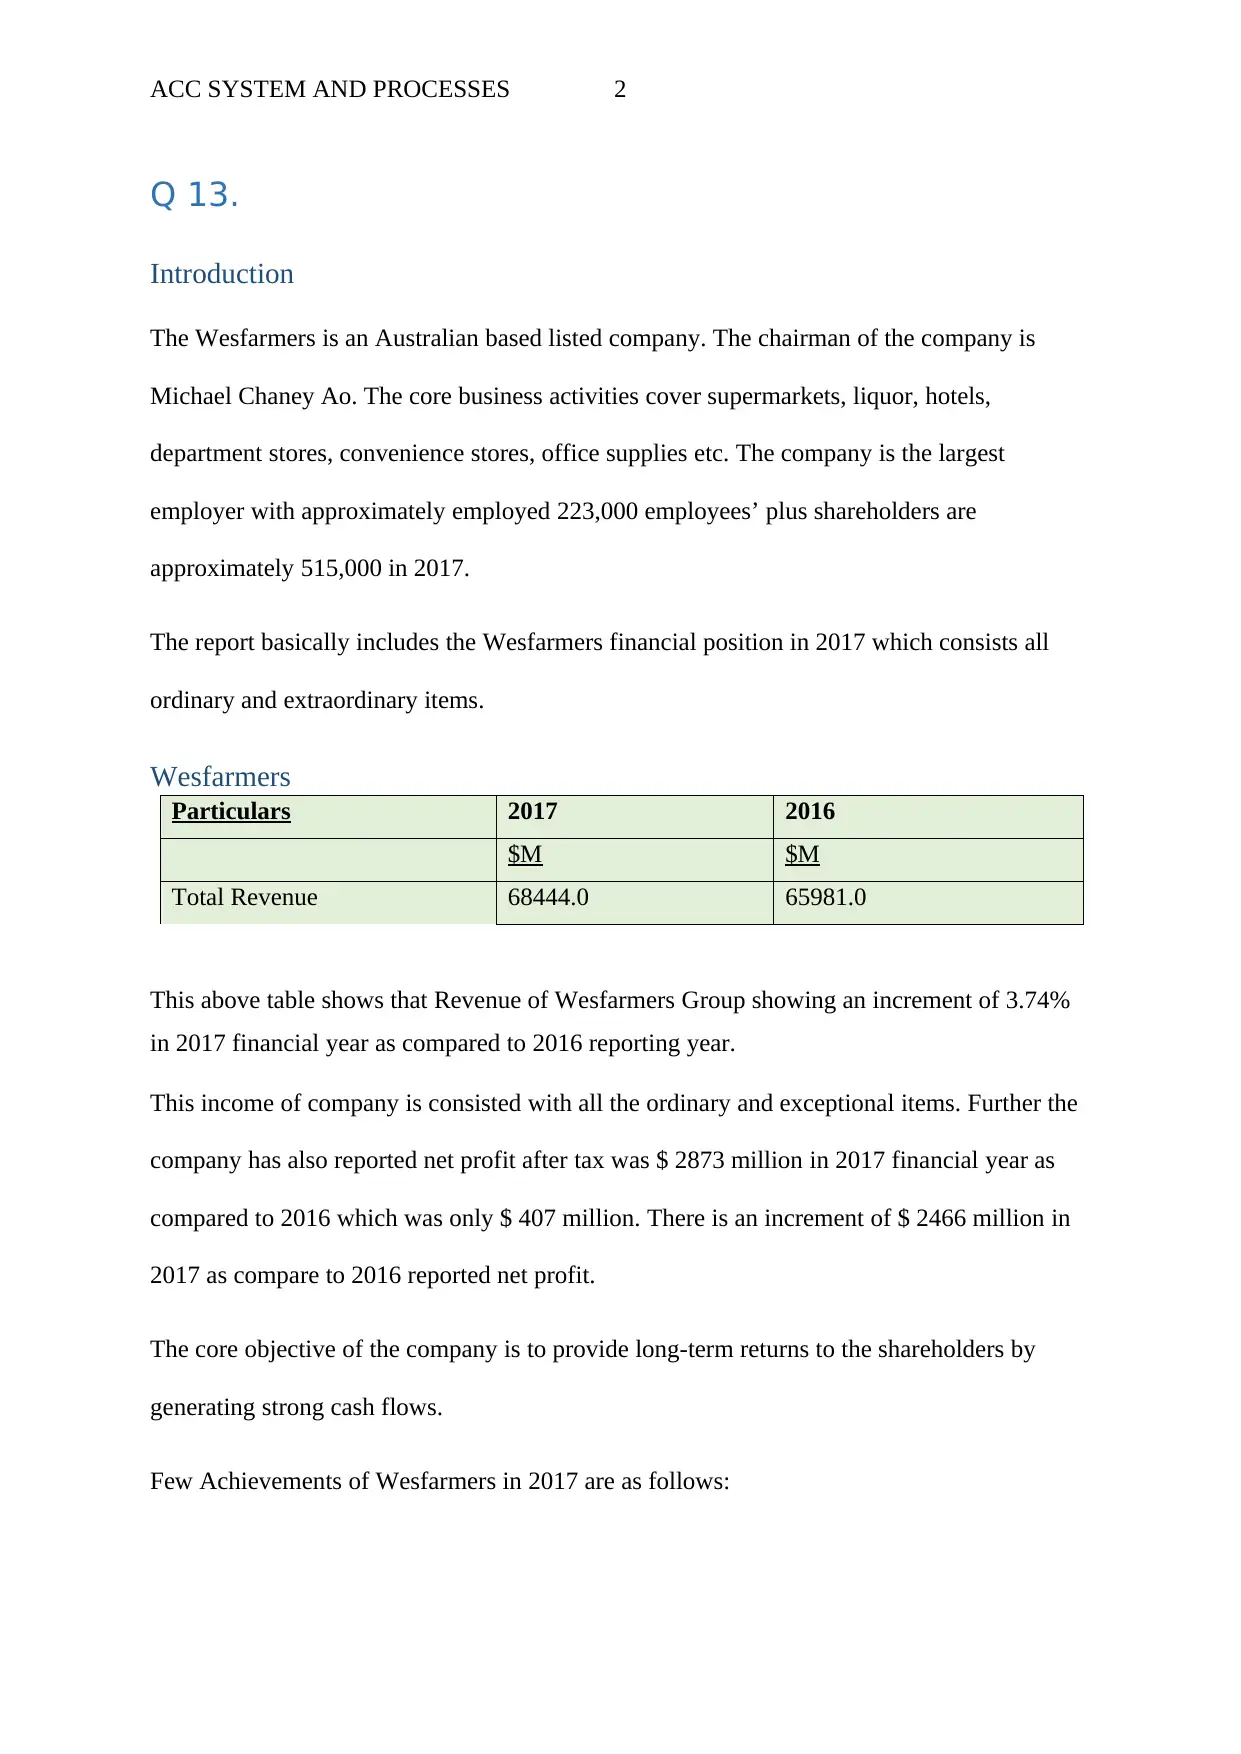
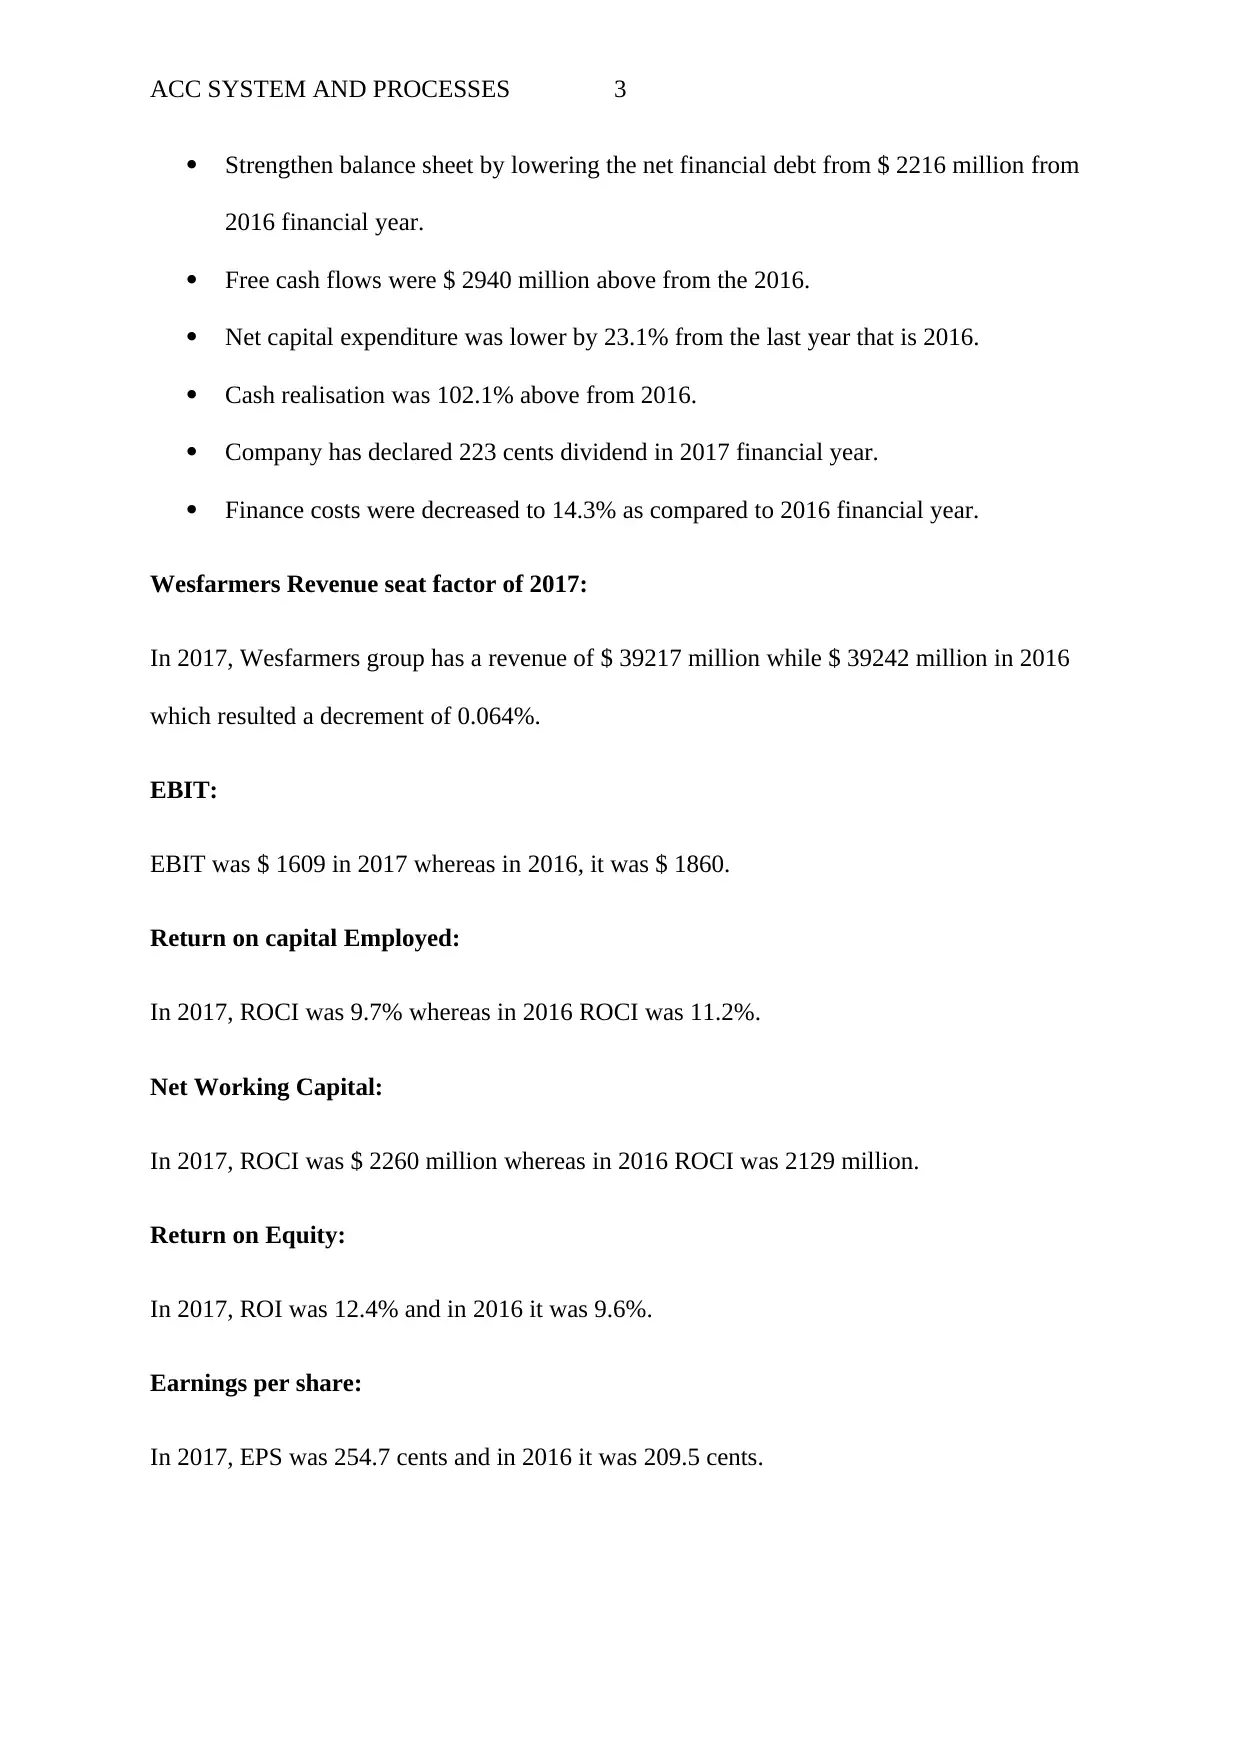
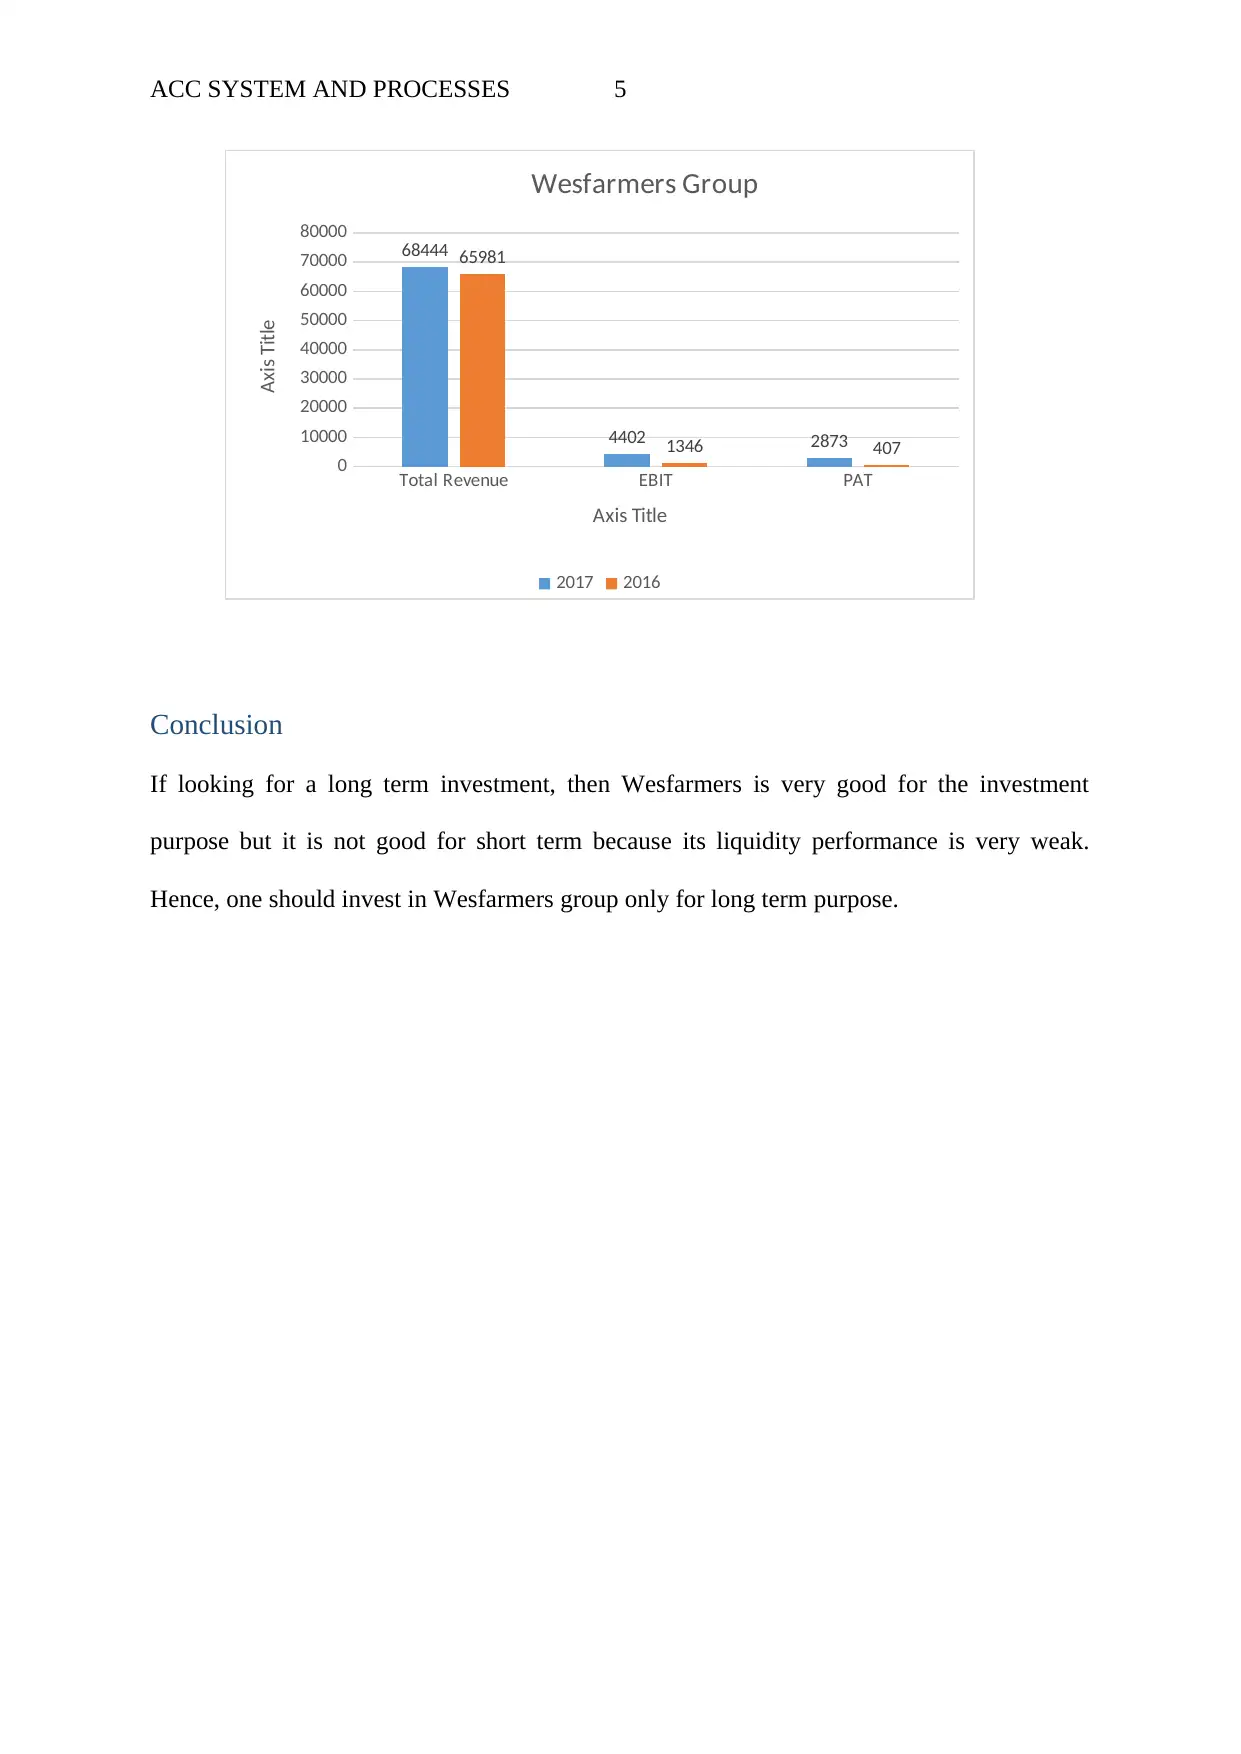
This report analyzes the financial performance of Wesfarmers in 2017, focusing on key metrics such as total revenue, EBIT, and net profit after tax. It highlights the company's revenue growth, with a 3.74% increase compared to 2016, and a significant rise in net profit. The report also examines the company's achievements, including strengthening its balance sheet and improved cash flows. Furthermore, it delves into specific financial data, including revenue seat factor, return on capital employed (ROCI), and current ratio, with a commentary on its liquidity performance. The conclusion suggests Wesfarmers is a good long-term investment but not suitable for short-term investments due to its weak liquidity performance.

RUNNING HEAD: ACC SYSTEM AND PROCESSES
ACC SYSTEM AND PROCESSES
Paraphrase This Document
Need a fresh take? Get an instant paraphrase of this document with our AI Paraphraser

ACC SYSTEM AND PROCESSES 1
Table of Contents
Q 13.......................................................................................................................................................2
Introduction.................................................................................................................................2
Wesfarmers..................................................................................................................................2
Conclusion....................................................................................................................................5
REFERENCES..................................................................................................................................5

ACC SYSTEM AND PROCESSES 2
Q 13.
Introduction
The Wesfarmers is an Australian based listed company. The chairman of the company is
Michael Chaney Ao. The core business activities cover supermarkets, liquor, hotels,
department stores, convenience stores, office supplies etc. The company is the largest
employer with approximately employed 223,000 employees’ plus shareholders are
approximately 515,000 in 2017.
The report basically includes the Wesfarmers financial position in 2017 which consists all
ordinary and extraordinary items.
Wesfarmers
Particulars 2017 2016
$M $M
Total Revenue 68444.0 65981.0
This above table shows that Revenue of Wesfarmers Group showing an increment of 3.74%
in 2017 financial year as compared to 2016 reporting year.
This income of company is consisted with all the ordinary and exceptional items. Further the
company has also reported net profit after tax was $ 2873 million in 2017 financial year as
compared to 2016 which was only $ 407 million. There is an increment of $ 2466 million in
2017 as compare to 2016 reported net profit.
The core objective of the company is to provide long-term returns to the shareholders by
generating strong cash flows.
Few Achievements of Wesfarmers in 2017 are as follows:
⊘ This is a preview!⊘
Do you want full access?
Subscribe today to unlock all pages.

Trusted by 1+ million students worldwide

ACC SYSTEM AND PROCESSES 3
Strengthen balance sheet by lowering the net financial debt from $ 2216 million from
2016 financial year.
Free cash flows were $ 2940 million above from the 2016.
Net capital expenditure was lower by 23.1% from the last year that is 2016.
Cash realisation was 102.1% above from 2016.
Company has declared 223 cents dividend in 2017 financial year.
Finance costs were decreased to 14.3% as compared to 2016 financial year.
Wesfarmers Revenue seat factor of 2017:
In 2017, Wesfarmers group has a revenue of $ 39217 million while $ 39242 million in 2016
which resulted a decrement of 0.064%.
EBIT:
EBIT was $ 1609 in 2017 whereas in 2016, it was $ 1860.
Return on capital Employed:
In 2017, ROCI was 9.7% whereas in 2016 ROCI was 11.2%.
Net Working Capital:
In 2017, ROCI was $ 2260 million whereas in 2016 ROCI was 2129 million.
Return on Equity:
In 2017, ROI was 12.4% and in 2016 it was 9.6%.
Earnings per share:
In 2017, EPS was 254.7 cents and in 2016 it was 209.5 cents.
Paraphrase This Document
Need a fresh take? Get an instant paraphrase of this document with our AI Paraphraser

ACC SYSTEM AND PROCESSES 4
Current Ratio is calculated to find out the soundness performance of the company and the
formula is: Current Assets ÷ Current Liabilities.
Particulars 2017 ($ M) 2016 ($ M)
Current Assets 9667 9684
Current Liabilities 10417 10424
Current Ratio [Current Assets/Current
Liabilities]
0.93 0.92
Comment:
From the basis of above ratio, it has been seen that its liquidity performance is not sound
because Wesfarmers has not sufficient short-term assets to meet its short-term dues.
Financial Data of Wesfarmers Australia Group company
Particulars 2017 2016
$M $M
Total Revenue 68444.0 65981.0
EBIT 4402.0 1346.0
PAT 2873.0 407.0

ACC SYSTEM AND PROCESSES 5
Total Revenue EBIT PAT
0
10000
20000
30000
40000
50000
60000
70000
80000 68444
4402 2873
65981
1346 407
Wesfarmers Group
2017 2016
Axis Title
Axis Title
Conclusion
If looking for a long term investment, then Wesfarmers is very good for the investment
purpose but it is not good for short term because its liquidity performance is very weak.
Hence, one should invest in Wesfarmers group only for long term purpose.
⊘ This is a preview!⊘
Do you want full access?
Subscribe today to unlock all pages.

Trusted by 1+ million students worldwide

ACC SYSTEM AND PROCESSES 6
REFERENCES
Wesfarmers Annual Report. (2017). Wesfarmers Annual Report 2017 . Retrieved on 08 May
2017 from www.wesfarmers.com.au/docs/default-source/default-document-library/2017-annual-
report.pdf
.
REFERENCES
Wesfarmers Annual Report. (2017). Wesfarmers Annual Report 2017 . Retrieved on 08 May
2017 from www.wesfarmers.com.au/docs/default-source/default-document-library/2017-annual-
report.pdf
.
1 out of 7
Related Documents

Your All-in-One AI-Powered Toolkit for Academic Success.
+13062052269
info@desklib.com
Available 24*7 on WhatsApp / Email
Unlock your academic potential
Copyright © 2020–2025 A2Z Services. All Rights Reserved. Developed and managed by ZUCOL.