Financial Accounting Report: Wesfarmers Limited Performance Analysis
VerifiedAdded on 2023/06/12
|21
|4085
|242
Report
AI Summary
This report provides a comprehensive analysis of Wesfarmers Limited, a major Australian retail business, focusing on its operational, financial, and managerial performance. It includes an examination of profitability ratios for the past two years, an evaluation of cash flow statements, and a critical analysis of the balance sheet, including liquidity, efficiency, solvency, and profitability ratios. The report also reviews the director's report to assess the company's operational and managerial productivity, comparing Wesfarmers' performance with competitor Woolworths.
Running head: ACCOUNTING FOR BUSINESS
Accounting for Business
Name of the Student
Name of the University
Author Note
Accounting for Business
Name of the Student
Name of the University
Author Note
Paraphrase This Document
Need a fresh take? Get an instant paraphrase of this document with our AI Paraphraser
1ACCOUNTING FOR BUSINESS
Executive summary
The discussion deals with the operational, financial and managerial performance analysis of
the chosen organisation of Wesfarmers limited which is one of the largest retail businesses in
Australia. It deals with mining, super market, petrol, chemical, fertilizers and safety products.
In order Analysis of the profitability of the chosen company of Wesfarmers of the recent two
years the profitability ratios have been calculated followed by evaluation and analysis of the
cash flow statements of the business organizations. It becomes easier to gain an
understanding of their outflows as well as the inflow. The critical analysis have been
conducted of the statement balance sheet of the firm along with the ratio analysis that
identifies the aspects of the organisations of the operating and the financial performance with
the help of various ratio the liquidity, efficiency, solvency and profitability ratio. The
discussion examines critically the annual report to find out the operational and managerial
productivity of the company.
2ACCOUNTING FOR BUSINESS
Table of Contents
Executive summary....................................................................................................................1
Introduction................................................................................................................................2
Discussion of the Report............................................................................................................3
Section 1.................................................................................................................................3
Profitability analysis both company wise and year wise...................................................3
Analysis of the cash flow statement...................................................................................5
Analysis of the balance sheet.............................................................................................7
The balance sheet ratio for determining the financial positions........................................8
Section 2.................................................................................................................................9
Ratio analysis.....................................................................................................................9
Section 3...............................................................................................................................12
Directors Report analysis:................................................................................................12
Conclusion................................................................................................................................14
References................................................................................................................................15
⊘ This is a preview!⊘
Do you want full access?
Subscribe today to unlock all pages.
Trusted by 1+ million students worldwide
3ACCOUNTING FOR BUSINESS
Introduction
For the purpose of analysis of the annual report the chosen company that is listed on
the Australian Stock exchange (ASX) is Wesfarmers limited which is the largest retail
business in Australia. It deals with the super market, mining, chemical, fertilizers and safety
products. The chosen company offers stable cash flows and comparatively low risks and it
facilitates payment to the investors along with the potential long-term growth. It seeks to
establish the diversified portfolio with regard to regulated utility infrastructure assets and
continuing to be in the lead position under the Australian infrastructure investment fund
(Gates, Prachyl and Sullivan 2016.). Moreover, the values upon which the company is
maintaining its growth are honesty, fairness, maximising the value of the security holder and
maintenance of the high corporate governance standards.
Discussion of the Report
Section 1
Profitability analysis both company wise and year wise
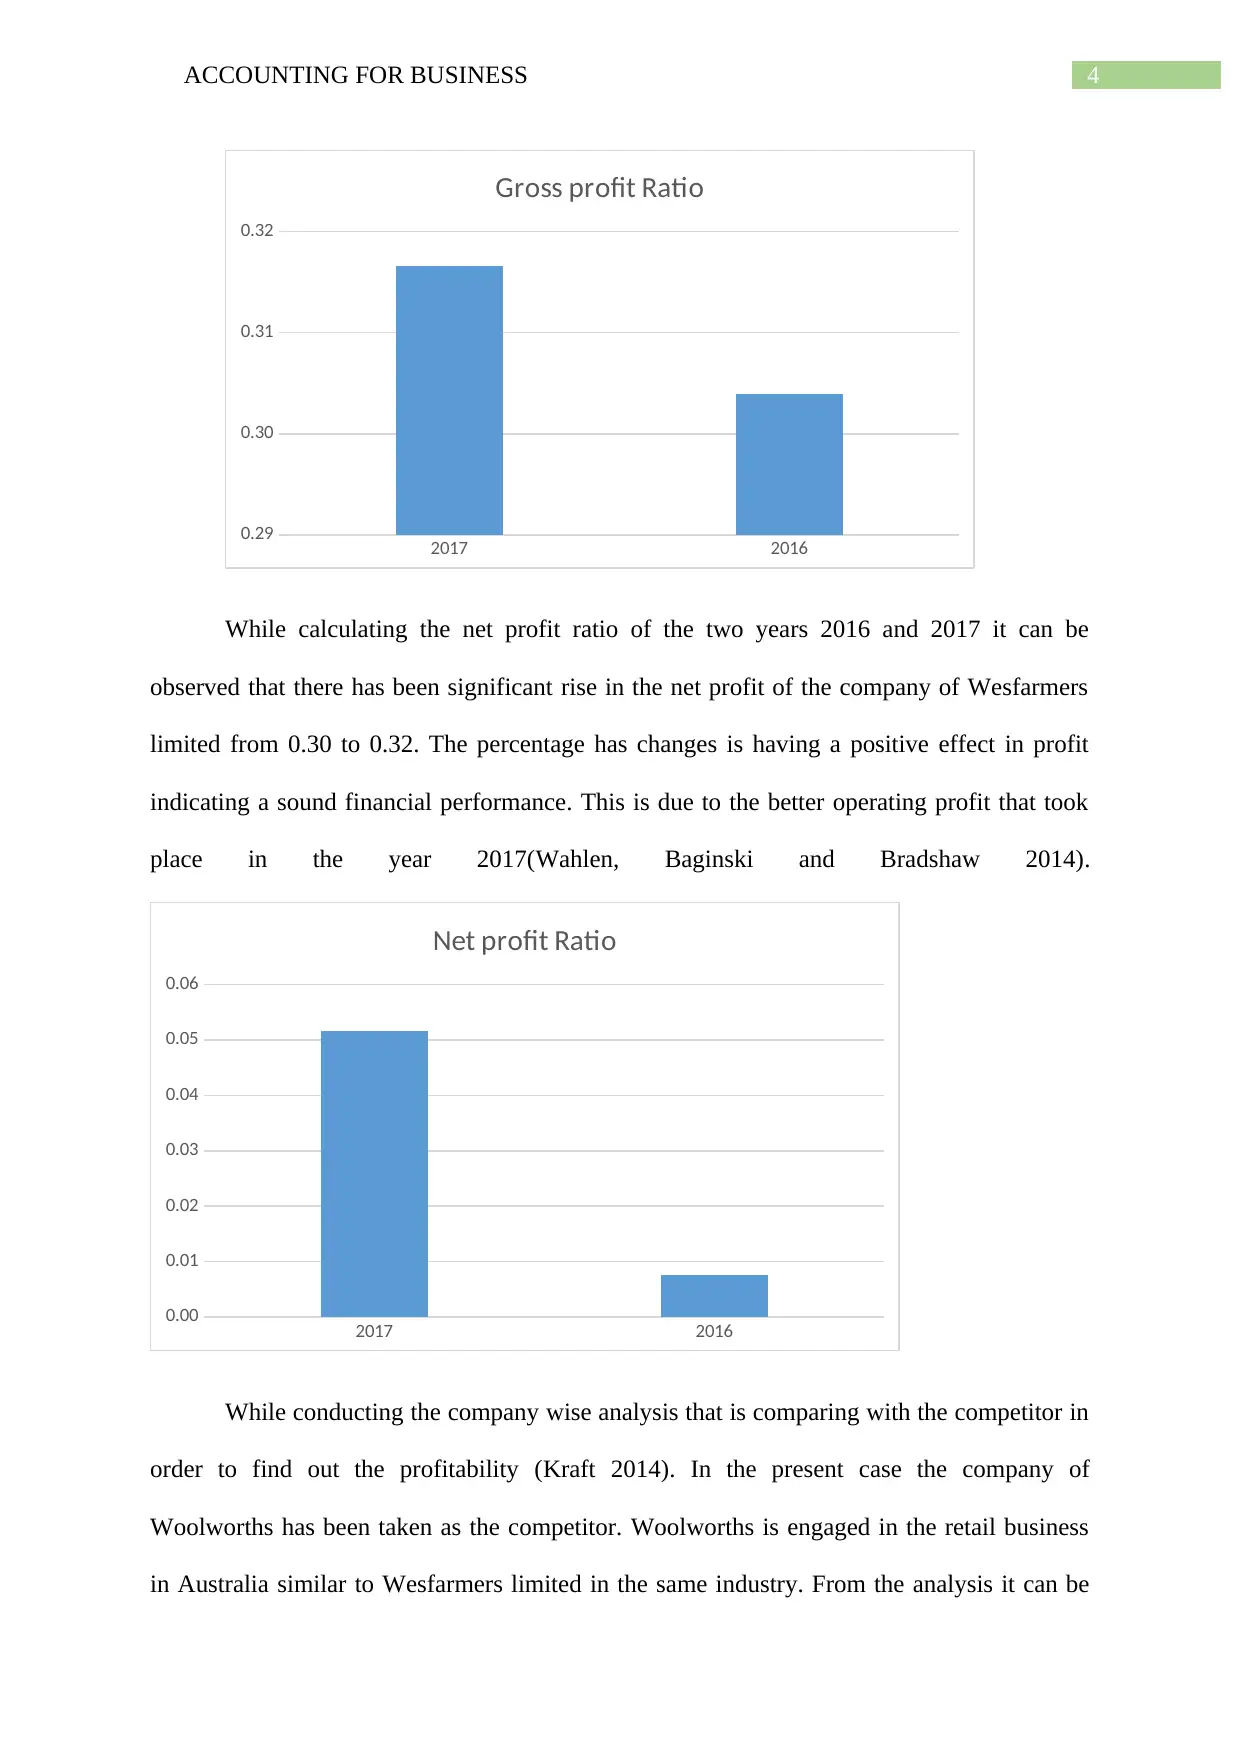
In order Analysis of the profitability of the chosen company of Wesfarmers limited of
recent two years the profitability ratios have been calculated. The two ratios gross profit ratio
and net profit ratio has been assessed (Haslam et al. 2015). The gross profit ratio of the
present year is 0.32 in 2017 which has increased from 0.30 in the year 2016, which is a very
nominal change. It can be said that there is positive change in the operational profit in the last
two years.
Introduction
For the purpose of analysis of the annual report the chosen company that is listed on
the Australian Stock exchange (ASX) is Wesfarmers limited which is the largest retail
business in Australia. It deals with the super market, mining, chemical, fertilizers and safety
products. The chosen company offers stable cash flows and comparatively low risks and it
facilitates payment to the investors along with the potential long-term growth. It seeks to
establish the diversified portfolio with regard to regulated utility infrastructure assets and
continuing to be in the lead position under the Australian infrastructure investment fund
(Gates, Prachyl and Sullivan 2016.). Moreover, the values upon which the company is
maintaining its growth are honesty, fairness, maximising the value of the security holder and
maintenance of the high corporate governance standards.
Discussion of the Report
Section 1
Profitability analysis both company wise and year wise
In order Analysis of the profitability of the chosen company of Wesfarmers limited of
recent two years the profitability ratios have been calculated. The two ratios gross profit ratio
and net profit ratio has been assessed (Haslam et al. 2015). The gross profit ratio of the
present year is 0.32 in 2017 which has increased from 0.30 in the year 2016, which is a very
nominal change. It can be said that there is positive change in the operational profit in the last
two years.
Paraphrase This Document
Need a fresh take? Get an instant paraphrase of this document with our AI Paraphraser
4ACCOUNTING FOR BUSINESS
2017 2016
0.29
0.30
0.31
0.32
Gross profit Ratio
While calculating the net profit ratio of the two years 2016 and 2017 it can be
observed that there has been significant rise in the net profit of the company of Wesfarmers
limited from 0.30 to 0.32. The percentage has changes is having a positive effect in profit
indicating a sound financial performance. This is due to the better operating profit that took
place in the year 2017(Wahlen, Baginski and Bradshaw 2014).
2017 2016
0.00
0.01
0.02
0.03
0.04
0.05
0.06
Net profit Ratio
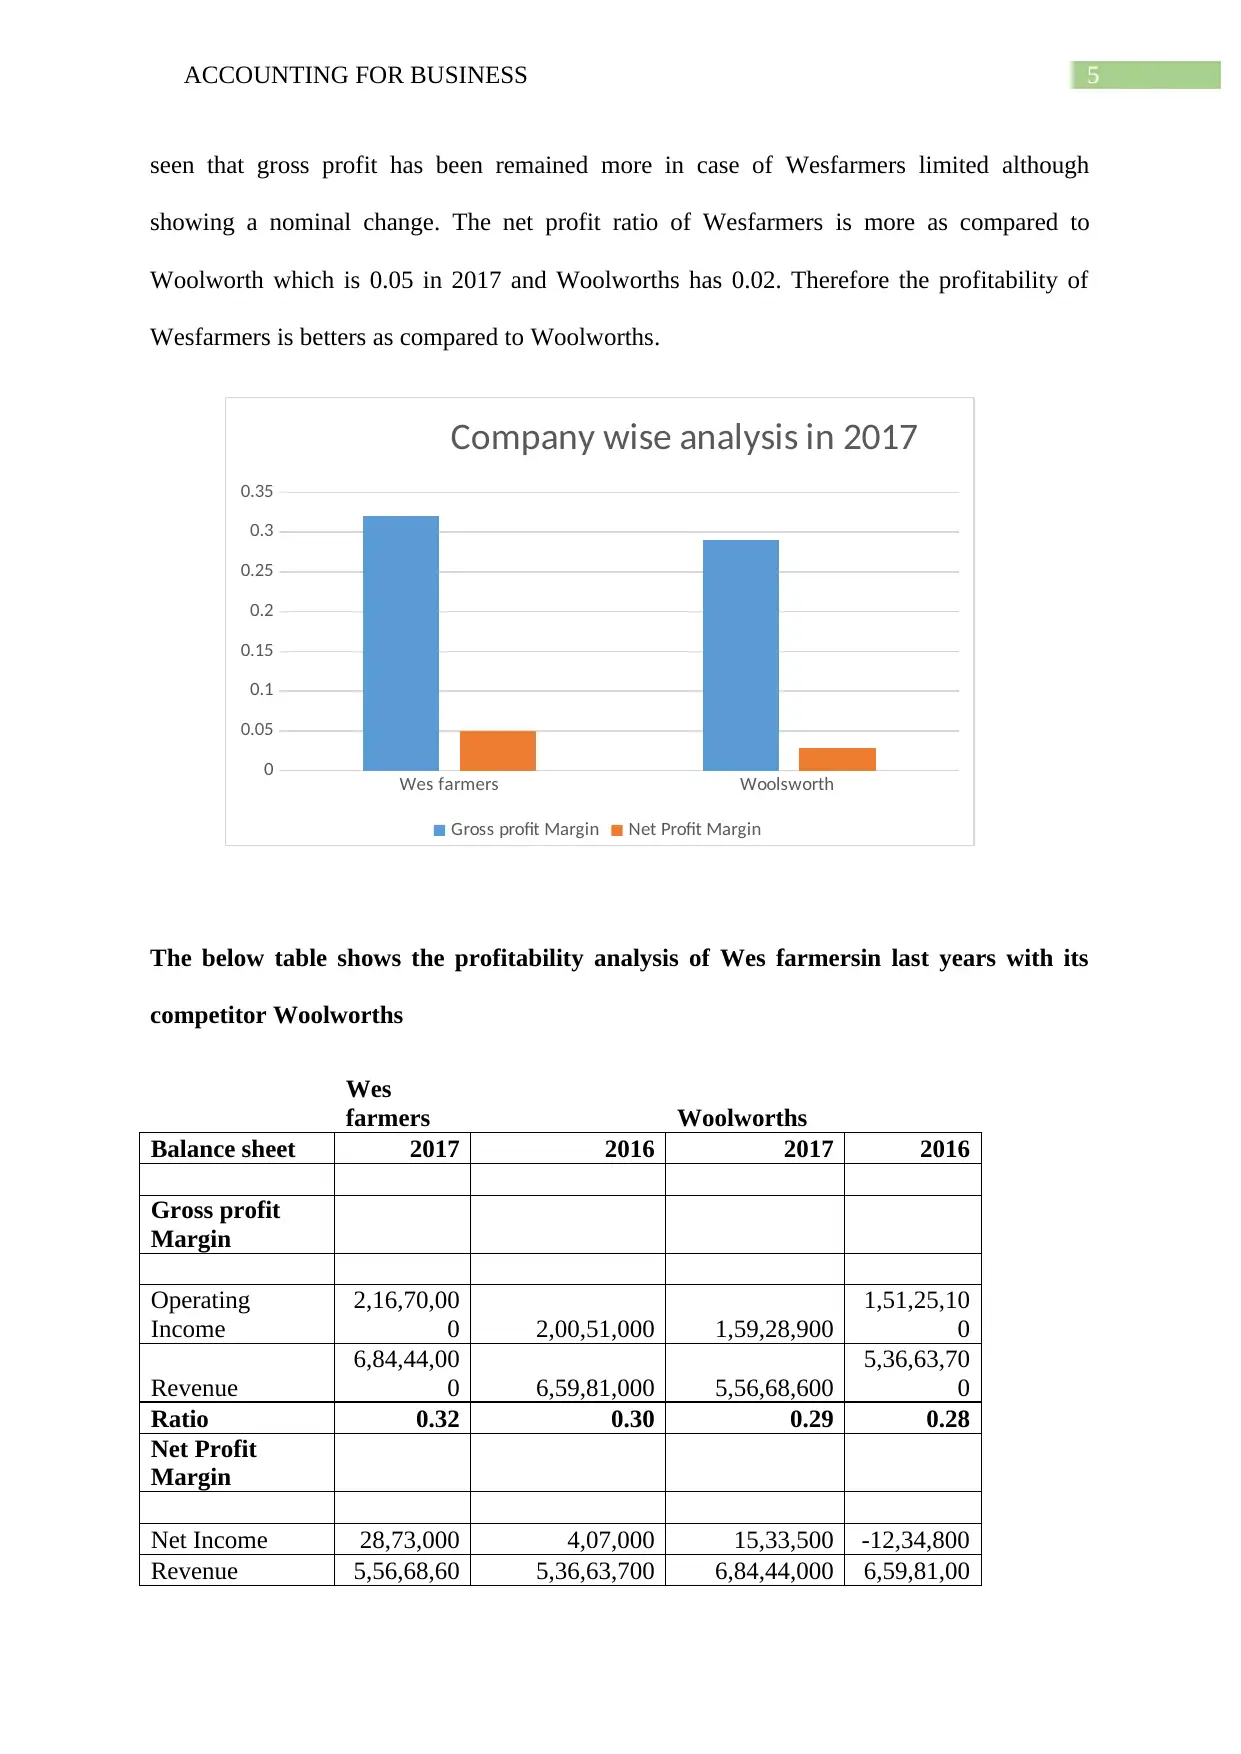
While conducting the company wise analysis that is comparing with the competitor in
order to find out the profitability (Kraft 2014). In the present case the company of
Woolworths has been taken as the competitor. Woolworths is engaged in the retail business
in Australia similar to Wesfarmers limited in the same industry. From the analysis it can be
2017 2016
0.29
0.30
0.31
0.32
Gross profit Ratio
While calculating the net profit ratio of the two years 2016 and 2017 it can be
observed that there has been significant rise in the net profit of the company of Wesfarmers
limited from 0.30 to 0.32. The percentage has changes is having a positive effect in profit
indicating a sound financial performance. This is due to the better operating profit that took
place in the year 2017(Wahlen, Baginski and Bradshaw 2014).
2017 2016
0.00
0.01
0.02
0.03
0.04
0.05
0.06
Net profit Ratio
While conducting the company wise analysis that is comparing with the competitor in
order to find out the profitability (Kraft 2014). In the present case the company of
Woolworths has been taken as the competitor. Woolworths is engaged in the retail business
in Australia similar to Wesfarmers limited in the same industry. From the analysis it can be
5ACCOUNTING FOR BUSINESS
seen that gross profit has been remained more in case of Wesfarmers limited although
showing a nominal change. The net profit ratio of Wesfarmers is more as compared to
Woolworth which is 0.05 in 2017 and Woolworths has 0.02. Therefore the profitability of
Wesfarmers is betters as compared to Woolworths.
Wes farmers Woolsworth
0
0.05
0.1
0.15
0.2
0.25
0.3
0.35
Company wise analysis in 2017
Gross profit Margin Net Profit Margin
The below table shows the profitability analysis of Wes farmersin last years with its
competitor Woolworths
Wes
farmers Woolworths
Balance sheet 2017 2016 2017 2016
Gross profit
Margin
Operating
Income
2,16,70,00
0 2,00,51,000 1,59,28,900
1,51,25,10
0
Revenue
6,84,44,00
0 6,59,81,000 5,56,68,600
5,36,63,70
0
Ratio 0.32 0.30 0.29 0.28
Net Profit
Margin
Net Income 28,73,000 4,07,000 15,33,500 -12,34,800
Revenue 5,56,68,60 5,36,63,700 6,84,44,000 6,59,81,00
⊘ This is a preview!⊘
Do you want full access?
Subscribe today to unlock all pages.
Trusted by 1+ million students worldwide
6ACCOUNTING FOR BUSINESS
0 0
Ratio 0.05 0.01 0.02 -0.02
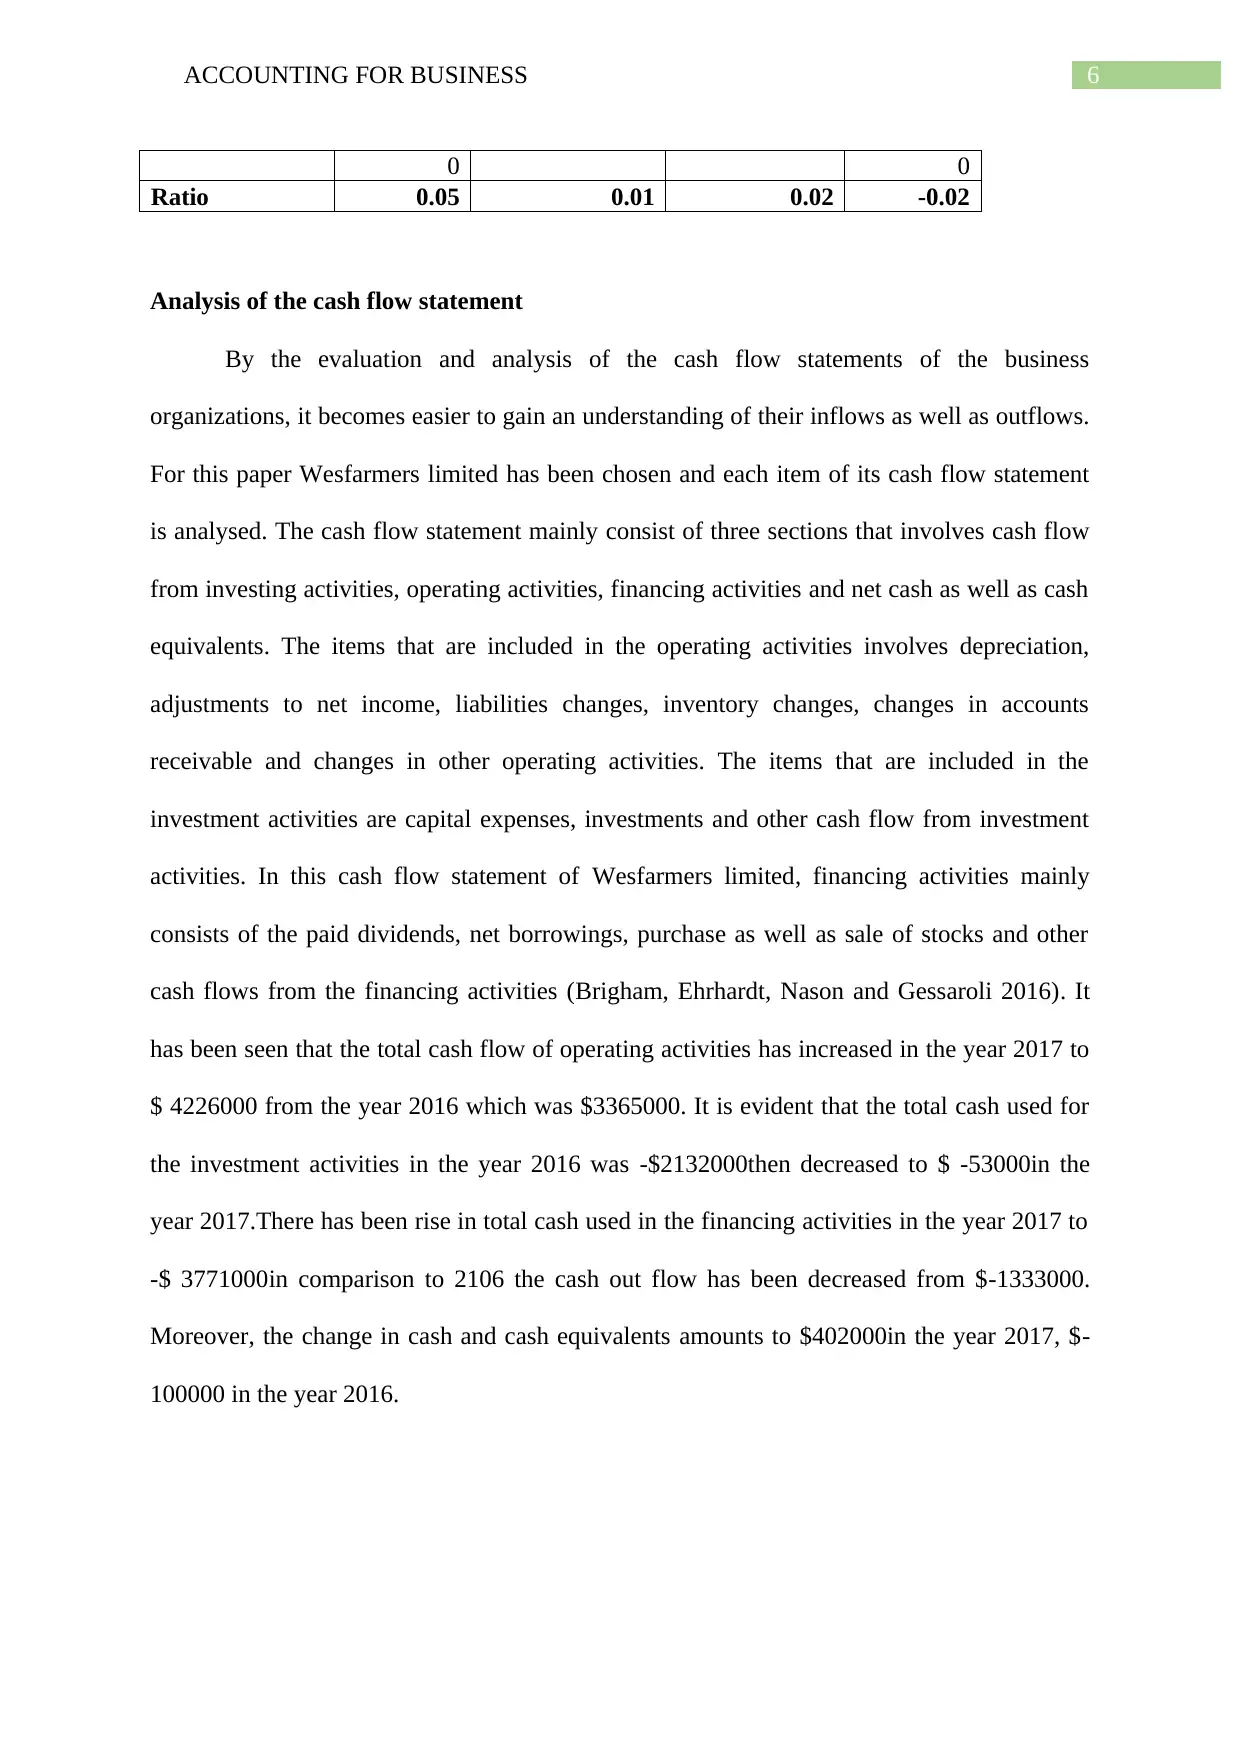
Analysis of the cash flow statement
By the evaluation and analysis of the cash flow statements of the business
organizations, it becomes easier to gain an understanding of their inflows as well as outflows.
For this paper Wesfarmers limited has been chosen and each item of its cash flow statement
is analysed. The cash flow statement mainly consist of three sections that involves cash flow
from investing activities, operating activities, financing activities and net cash as well as cash
equivalents. The items that are included in the operating activities involves depreciation,
adjustments to net income, liabilities changes, inventory changes, changes in accounts
receivable and changes in other operating activities. The items that are included in the
investment activities are capital expenses, investments and other cash flow from investment
activities. In this cash flow statement of Wesfarmers limited, financing activities mainly
consists of the paid dividends, net borrowings, purchase as well as sale of stocks and other
cash flows from the financing activities (Brigham, Ehrhardt, Nason and Gessaroli 2016). It
has been seen that the total cash flow of operating activities has increased in the year 2017 to
$ 4226000 from the year 2016 which was $3365000. It is evident that the total cash used for
the investment activities in the year 2016 was -$2132000then decreased to $ -53000in the
year 2017.There has been rise in total cash used in the financing activities in the year 2017 to
-$ 3771000in comparison to 2106 the cash out flow has been decreased from $-1333000.
Moreover, the change in cash and cash equivalents amounts to $402000in the year 2017, $-
100000 in the year 2016.
0 0
Ratio 0.05 0.01 0.02 -0.02
Analysis of the cash flow statement
By the evaluation and analysis of the cash flow statements of the business
organizations, it becomes easier to gain an understanding of their inflows as well as outflows.
For this paper Wesfarmers limited has been chosen and each item of its cash flow statement
is analysed. The cash flow statement mainly consist of three sections that involves cash flow
from investing activities, operating activities, financing activities and net cash as well as cash
equivalents. The items that are included in the operating activities involves depreciation,
adjustments to net income, liabilities changes, inventory changes, changes in accounts
receivable and changes in other operating activities. The items that are included in the
investment activities are capital expenses, investments and other cash flow from investment
activities. In this cash flow statement of Wesfarmers limited, financing activities mainly
consists of the paid dividends, net borrowings, purchase as well as sale of stocks and other
cash flows from the financing activities (Brigham, Ehrhardt, Nason and Gessaroli 2016). It
has been seen that the total cash flow of operating activities has increased in the year 2017 to
$ 4226000 from the year 2016 which was $3365000. It is evident that the total cash used for
the investment activities in the year 2016 was -$2132000then decreased to $ -53000in the
year 2017.There has been rise in total cash used in the financing activities in the year 2017 to
-$ 3771000in comparison to 2106 the cash out flow has been decreased from $-1333000.
Moreover, the change in cash and cash equivalents amounts to $402000in the year 2017, $-
100000 in the year 2016.
Paraphrase This Document
Need a fresh take? Get an instant paraphrase of this document with our AI Paraphraser
7ACCOUNTING FOR BUSINESS
Net cash flow from
operating activities Net cash flow from
investing activities Net cash flow from
financing activities
-4,000,000
-3,000,000
-2,000,000
-1,000,000
0
1,000,000
2,000,000
3,000,000
4,000,000
5,000,000
Cash flow analysis
2017 in $m 2016 in $m
Particular
2017 in
$m
2016 in
$m
Net cash flow from operating
activities
42,26,00
0
33,65,00
0
Net cash flow from investing
activities -53,000
-
21,32,00
0
Net cash flow from financing
activities
-
37,71,00
0
-
13,33,00
0
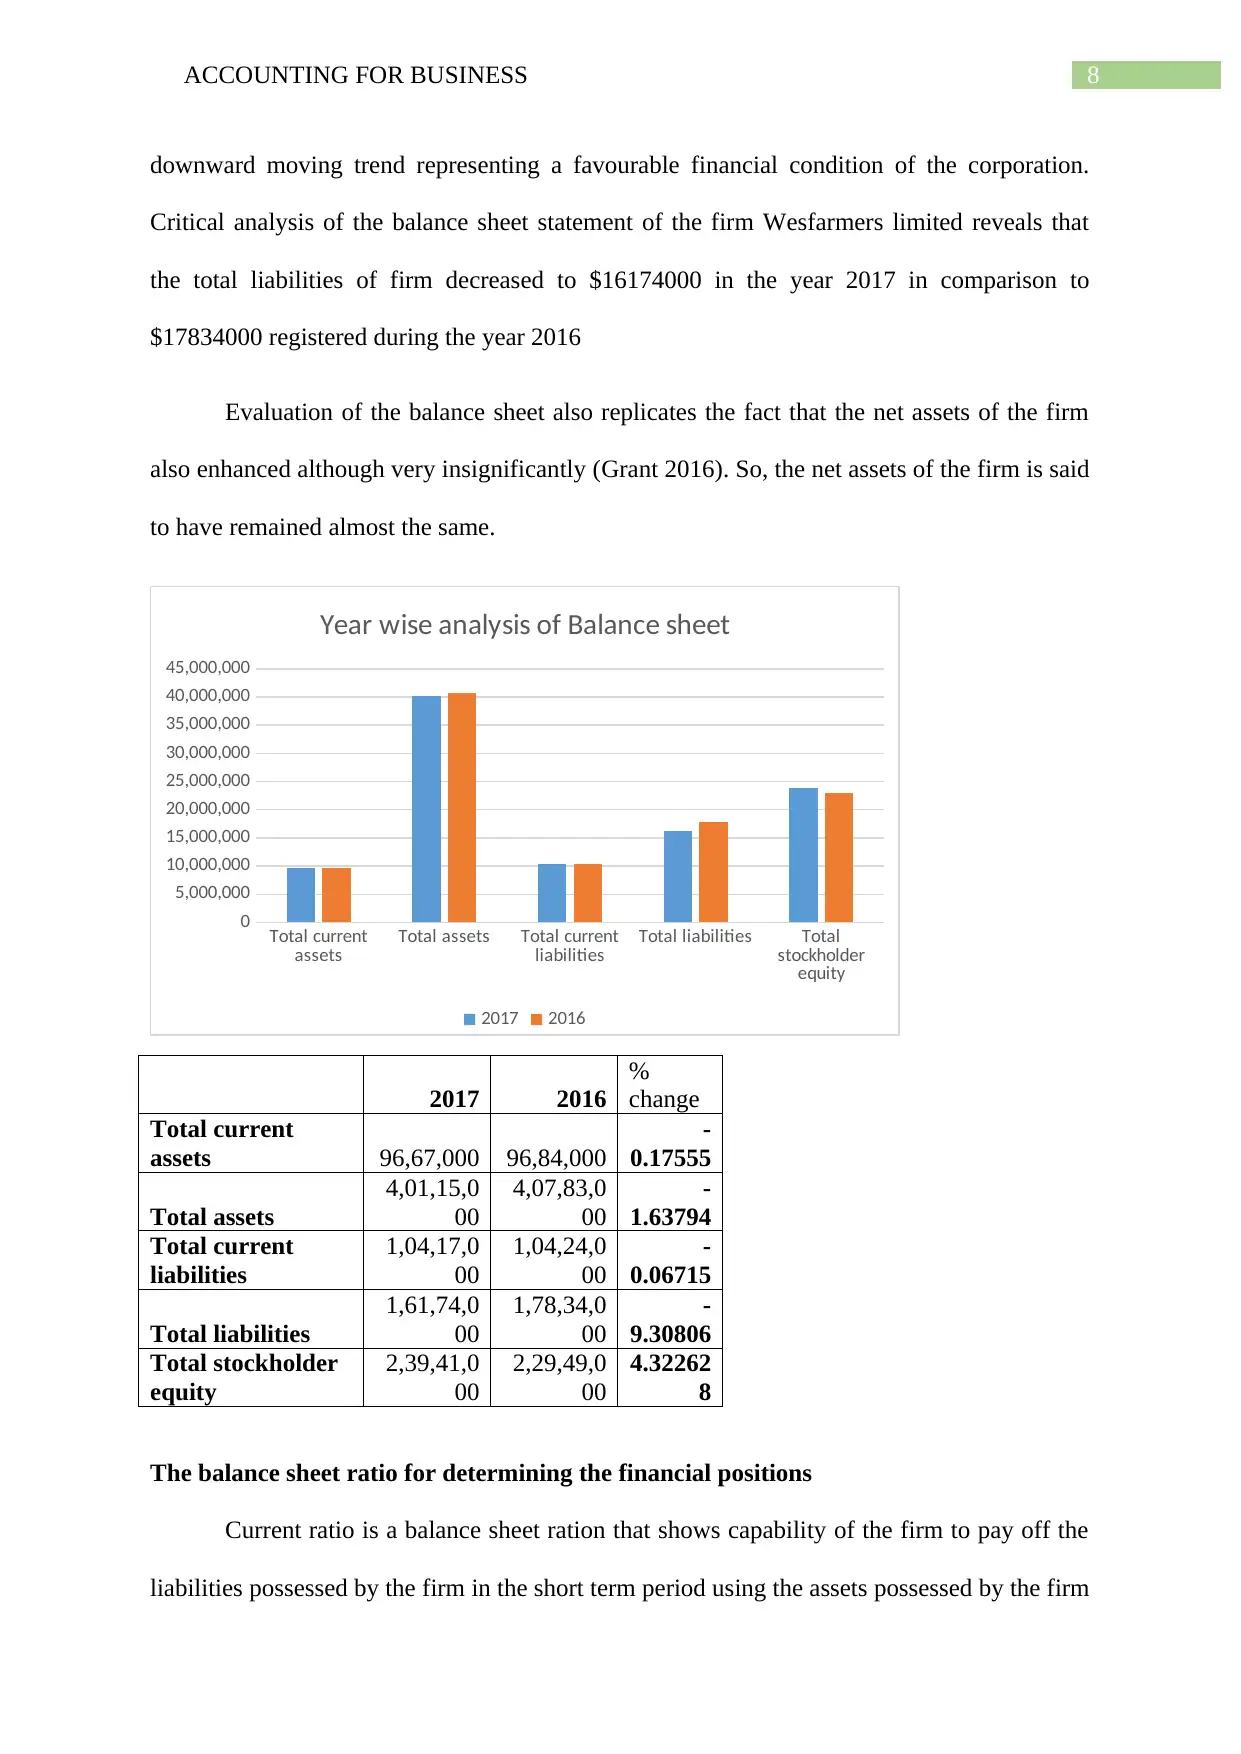
Analysis of the balance sheet
Critical analysis of the balance sheet statement of the firm Wesfarmers limited reveals
that the total assets of firm decreased to $40115000 in the year 2017 in comparison to
$40783000 registered during the year 2016. The decrease in total assets of the firm is mainly
due to relative decrease in quick assets, loans as well as advances, goodwill along with
different intangible assets (Kozlowski, Searcy and Bardecki 2015). The decrease in assets of
the firm during the current period in comparison to the year ago period can be considered to
not desirable financial condition of the organisation.
Again, liabilities of the firm are also observed to have decreased during the period
2017 as compared to the year ago period. In essence, the liabilities of the firm reflecting and
Net cash flow from
operating activities Net cash flow from
investing activities Net cash flow from
financing activities
-4,000,000
-3,000,000
-2,000,000
-1,000,000
0
1,000,000
2,000,000
3,000,000
4,000,000
5,000,000
Cash flow analysis
2017 in $m 2016 in $m
Particular
2017 in
$m
2016 in
$m
Net cash flow from operating
activities
42,26,00
0
33,65,00
0
Net cash flow from investing
activities -53,000
-
21,32,00
0
Net cash flow from financing
activities
-
37,71,00
0
-
13,33,00
0
Analysis of the balance sheet
Critical analysis of the balance sheet statement of the firm Wesfarmers limited reveals
that the total assets of firm decreased to $40115000 in the year 2017 in comparison to
$40783000 registered during the year 2016. The decrease in total assets of the firm is mainly
due to relative decrease in quick assets, loans as well as advances, goodwill along with
different intangible assets (Kozlowski, Searcy and Bardecki 2015). The decrease in assets of
the firm during the current period in comparison to the year ago period can be considered to
not desirable financial condition of the organisation.
Again, liabilities of the firm are also observed to have decreased during the period
2017 as compared to the year ago period. In essence, the liabilities of the firm reflecting and
8ACCOUNTING FOR BUSINESS
downward moving trend representing a favourable financial condition of the corporation.
Critical analysis of the balance sheet statement of the firm Wesfarmers limited reveals that
the total liabilities of firm decreased to $16174000 in the year 2017 in comparison to
$17834000 registered during the year 2016
Evaluation of the balance sheet also replicates the fact that the net assets of the firm
also enhanced although very insignificantly (Grant 2016). So, the net assets of the firm is said
to have remained almost the same.
Total current
assets Total assets Total current
liabilities Total liabilities Total
stockholder
equity
0
5,000,000
10,000,000
15,000,000
20,000,000
25,000,000
30,000,000
35,000,000
40,000,000
45,000,000
Year wise analysis of Balance sheet
2017 2016
2017 2016
%
change
Total current
assets 96,67,000 96,84,000
-
0.17555
Total assets
4,01,15,0
00
4,07,83,0
00
-
1.63794
Total current
liabilities
1,04,17,0
00
1,04,24,0
00
-
0.06715
Total liabilities
1,61,74,0
00
1,78,34,0
00
-
9.30806
Total stockholder
equity
2,39,41,0
00
2,29,49,0
00
4.32262
8
The balance sheet ratio for determining the financial positions
Current ratio is a balance sheet ration that shows capability of the firm to pay off the
liabilities possessed by the firm in the short term period using the assets possessed by the firm
⊘ This is a preview!⊘
Do you want full access?
Subscribe today to unlock all pages.
Trusted by 1+ million students worldwide
9ACCOUNTING FOR BUSINESS
(Wilson 2015). Current ratio which is found out by dividing the total current assets with the
total liabilities of the firm has remained same throughout the period 2017 in comparison to
the period 2016 (Zietlow, et al. 2018). The constant current ratio is said to be have no effect
for change in the present two financial condition as lower ratio indicates an unfavourable
condition and higher represents good condition.
Balance sheet
ratio Formula 2017 2016
Current ratio
Total current assets / total current
liabilities 0.928 0.93
Quick Ratio Quick assets/ Quick ,liabilities 0.30 0.33
Quick Ratio is a balance sheet ratio that where liquid assets of the firm are used for
repaying current assets of the firm. The quick ratio of the firm has decreased in 2017 in
comparison to year ago period, representing a comparatively worse financial condition of the
corporation (Shin and Eksioglu, 2015).
Section 2
Ratio analysis
Ratio analysis is the process analysis of the financial statements of the company to
evaluate the aspects of the operating and the financial performance of the company with the
help of the efficiency, liquidity, profitability and solvency ratio (Warren and Jones, 2018).
The following ratios for three financial years based on the information from annual Report of
Wesfarmers limited for the year 2017 gas been calculated. The ratios analysis of Wesfarmers
limited includes:
Ratio
Amount
(US$M)
Amount
(US$M)
Quick Ratio 2017 2016
Quick Assets 31,37,000 34,24,000
Current Liabilities 1,04,17,000 1,04,24,000
Paraphrase This Document
Need a fresh take? Get an instant paraphrase of this document with our AI Paraphraser
10ACCOUNTING FOR BUSINESS
Ratio 0.30 0.33
Inventory Turnover
Revenue 5,56,68,600 5,36,63,700
Inventories 65,30,000 62,60,000
Ratio 8.53 8.57
Return on Assets
Net Profit 28,73,000 4,07,000
Total assets 4,01,15,000 4,07,83,000
Ratio 0.07 0.01
Price earnings
ratio(P/E)
Market value per share 25.84 20.89
Earnings per share 110.8 116.8
Ratio 0.23 0.18
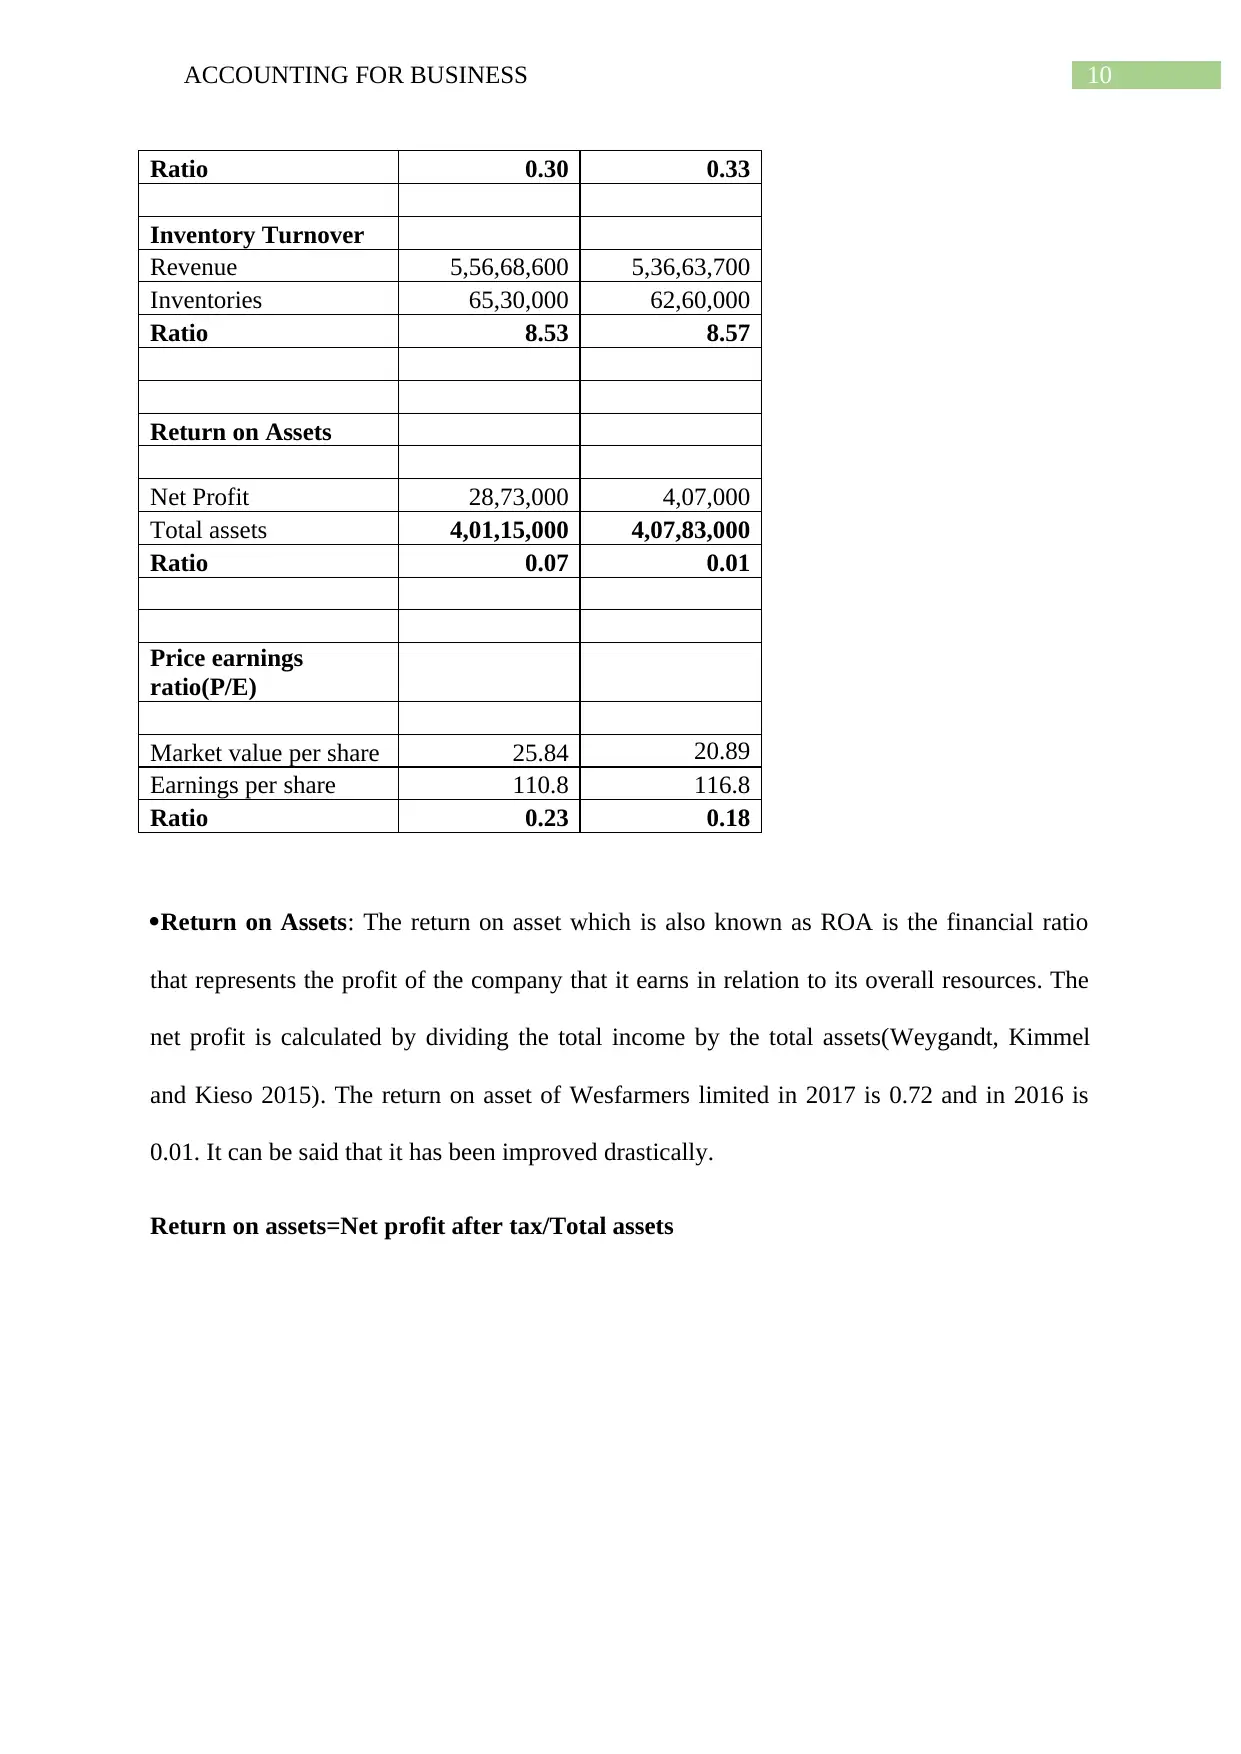
Return on Assets: The return on asset which is also known as ROA is the financial ratio
that represents the profit of the company that it earns in relation to its overall resources. The
net profit is calculated by dividing the total income by the total assets(Weygandt, Kimmel
and Kieso 2015). The return on asset of Wesfarmers limited in 2017 is 0.72 and in 2016 is
0.01. It can be said that it has been improved drastically.
Return on assets=Net profit after tax/Total assets
Ratio 0.30 0.33
Inventory Turnover
Revenue 5,56,68,600 5,36,63,700
Inventories 65,30,000 62,60,000
Ratio 8.53 8.57
Return on Assets
Net Profit 28,73,000 4,07,000
Total assets 4,01,15,000 4,07,83,000
Ratio 0.07 0.01
Price earnings
ratio(P/E)
Market value per share 25.84 20.89
Earnings per share 110.8 116.8
Ratio 0.23 0.18
Return on Assets: The return on asset which is also known as ROA is the financial ratio
that represents the profit of the company that it earns in relation to its overall resources. The
net profit is calculated by dividing the total income by the total assets(Weygandt, Kimmel
and Kieso 2015). The return on asset of Wesfarmers limited in 2017 is 0.72 and in 2016 is
0.01. It can be said that it has been improved drastically.
Return on assets=Net profit after tax/Total assets
11ACCOUNTING FOR BUSINESS
2017 2016
0.000
0.010
0.020
0.030
0.040
0.050
0.060
0.070
0.080
Return on asset Ratio
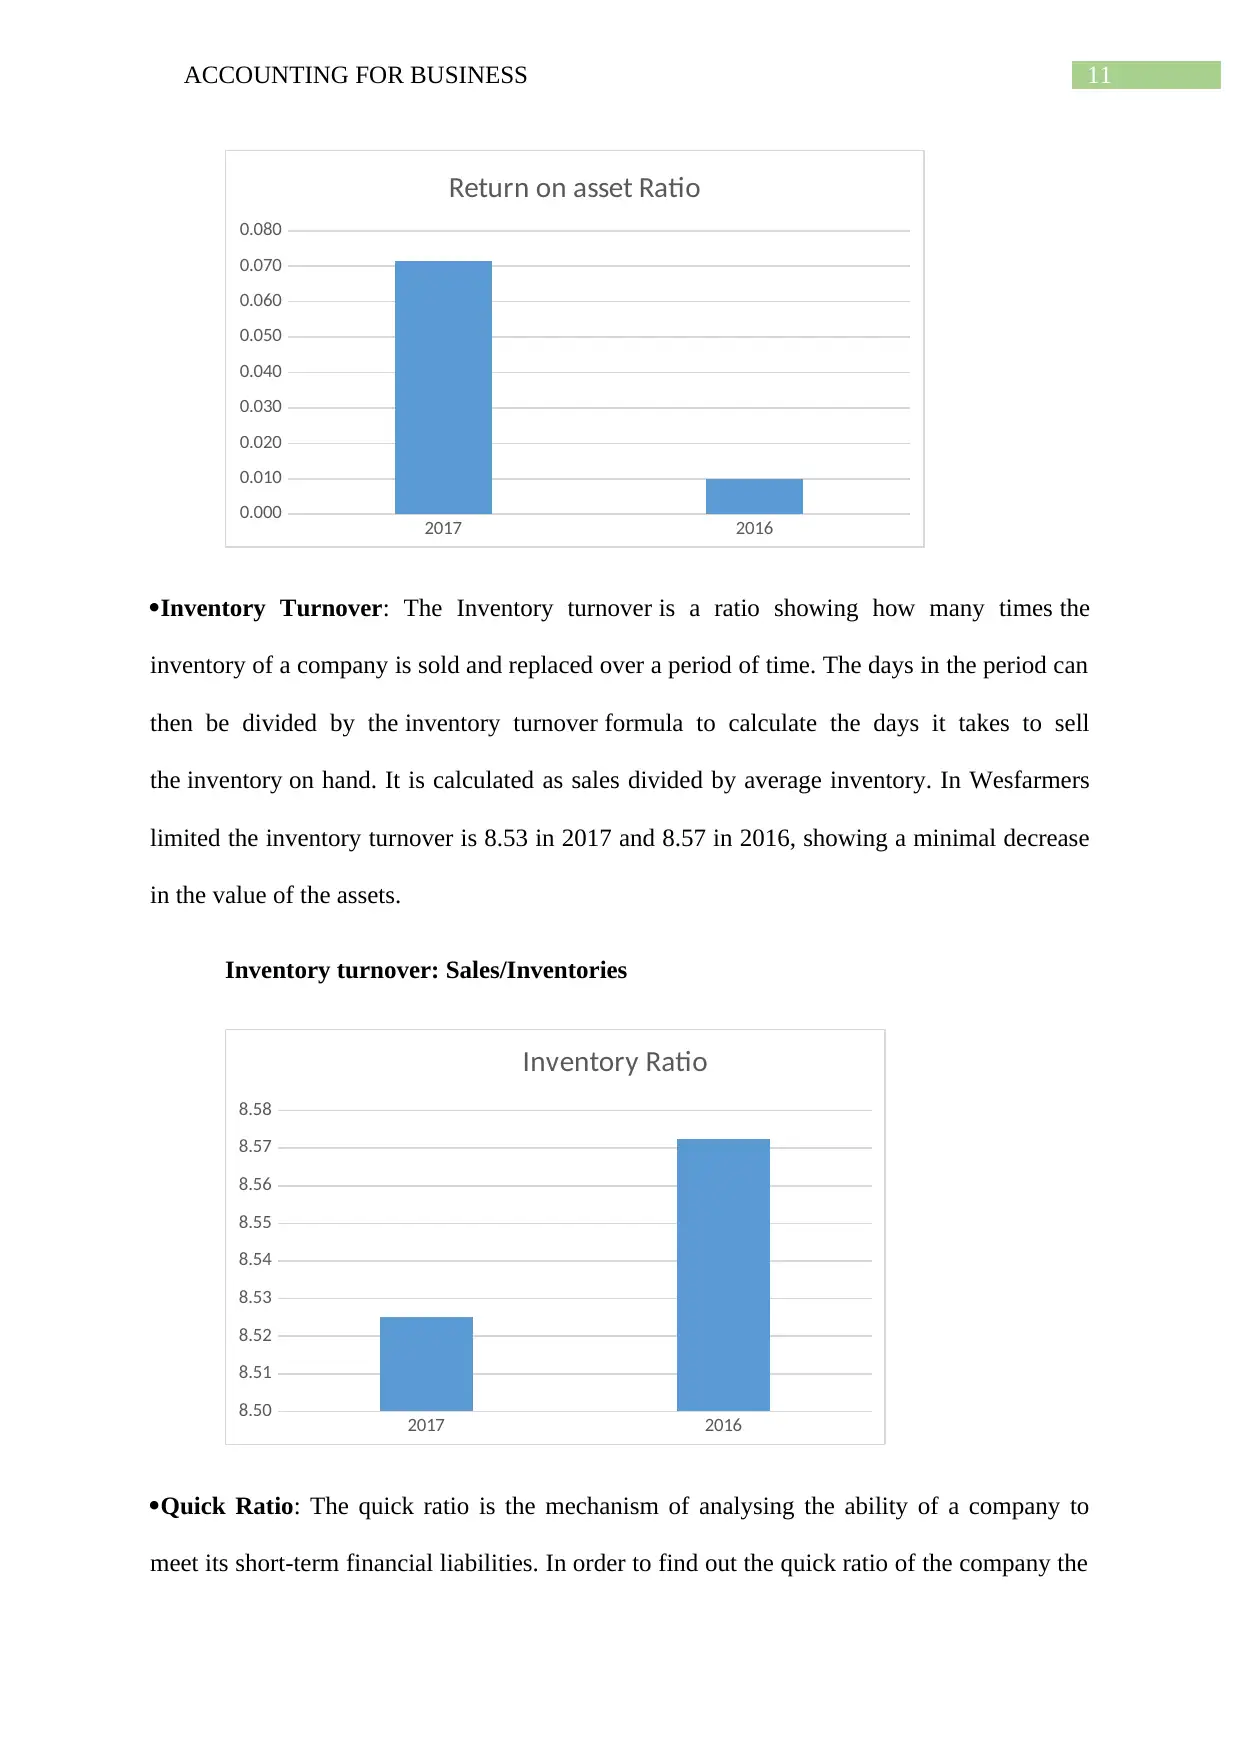
Inventory Turnover: The Inventory turnover is a ratio showing how many times the
inventory of a company is sold and replaced over a period of time. The days in the period can
then be divided by the inventory turnover formula to calculate the days it takes to sell
the inventory on hand. It is calculated as sales divided by average inventory. In Wesfarmers
limited the inventory turnover is 8.53 in 2017 and 8.57 in 2016, showing a minimal decrease
in the value of the assets.
Inventory turnover: Sales/Inventories
2017 2016
8.50
8.51
8.52
8.53
8.54
8.55
8.56
8.57
8.58
Inventory Ratio
Quick Ratio: The quick ratio is the mechanism of analysing the ability of a company to
meet its short-term financial liabilities. In order to find out the quick ratio of the company the
2017 2016
0.000
0.010
0.020
0.030
0.040
0.050
0.060
0.070
0.080
Return on asset Ratio
Inventory Turnover: The Inventory turnover is a ratio showing how many times the
inventory of a company is sold and replaced over a period of time. The days in the period can
then be divided by the inventory turnover formula to calculate the days it takes to sell
the inventory on hand. It is calculated as sales divided by average inventory. In Wesfarmers
limited the inventory turnover is 8.53 in 2017 and 8.57 in 2016, showing a minimal decrease
in the value of the assets.
Inventory turnover: Sales/Inventories
2017 2016
8.50
8.51
8.52
8.53
8.54
8.55
8.56
8.57
8.58
Inventory Ratio
Quick Ratio: The quick ratio is the mechanism of analysing the ability of a company to
meet its short-term financial liabilities. In order to find out the quick ratio of the company the
⊘ This is a preview!⊘
Do you want full access?
Subscribe today to unlock all pages.
Trusted by 1+ million students worldwide
1 out of 21
Related Documents


Your All-in-One AI-Powered Toolkit for Academic Success.
+13062052269
info@desklib.com
Available 24*7 on WhatsApp / Email
![[object Object]](/_next/static/media/star-bottom.7253800d.svg)
Unlock your academic potential
Copyright © 2020–2026 A2Z Services. All Rights Reserved. Developed and managed by ZUCOL.