Financial Analysis of Wesfarmers Ltd: A Comprehensive Report

Verified

Added on  2020/07/23

|10
|2117
|379
Report
AI Summary
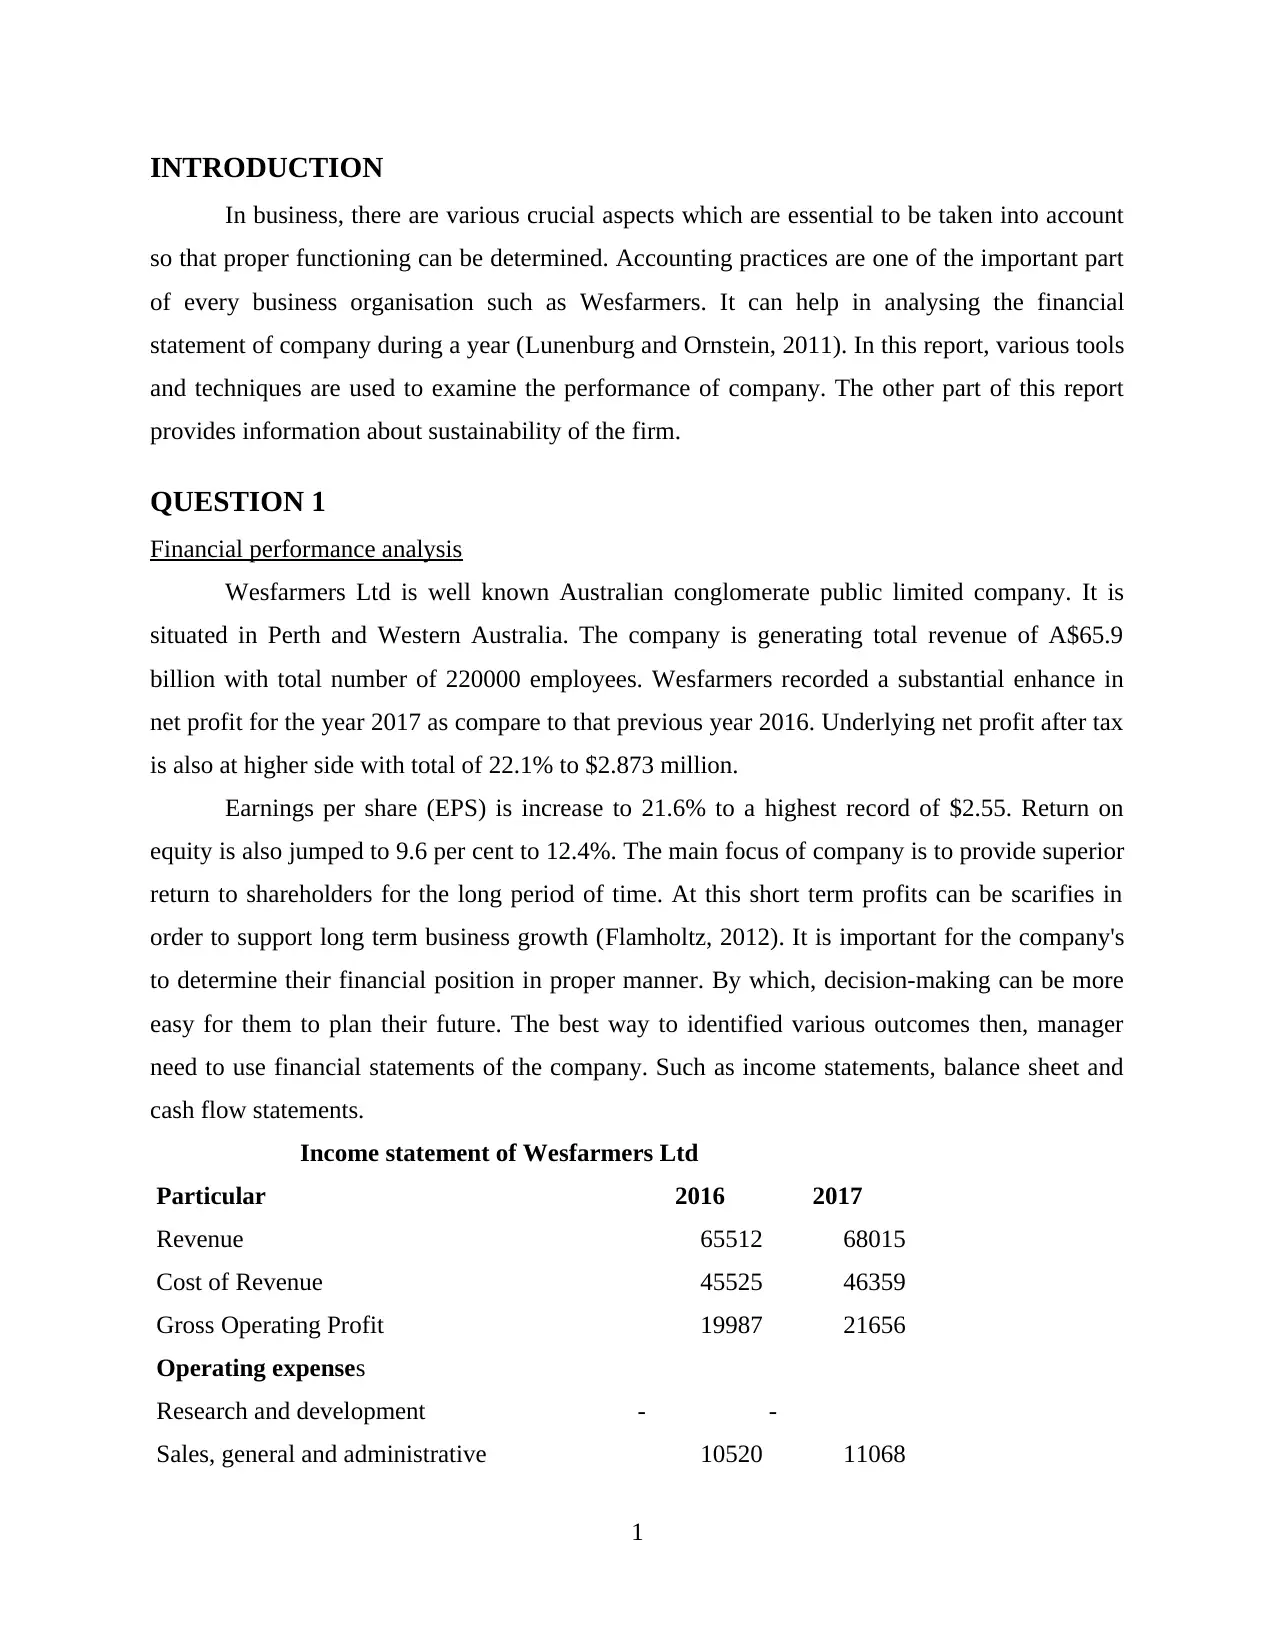
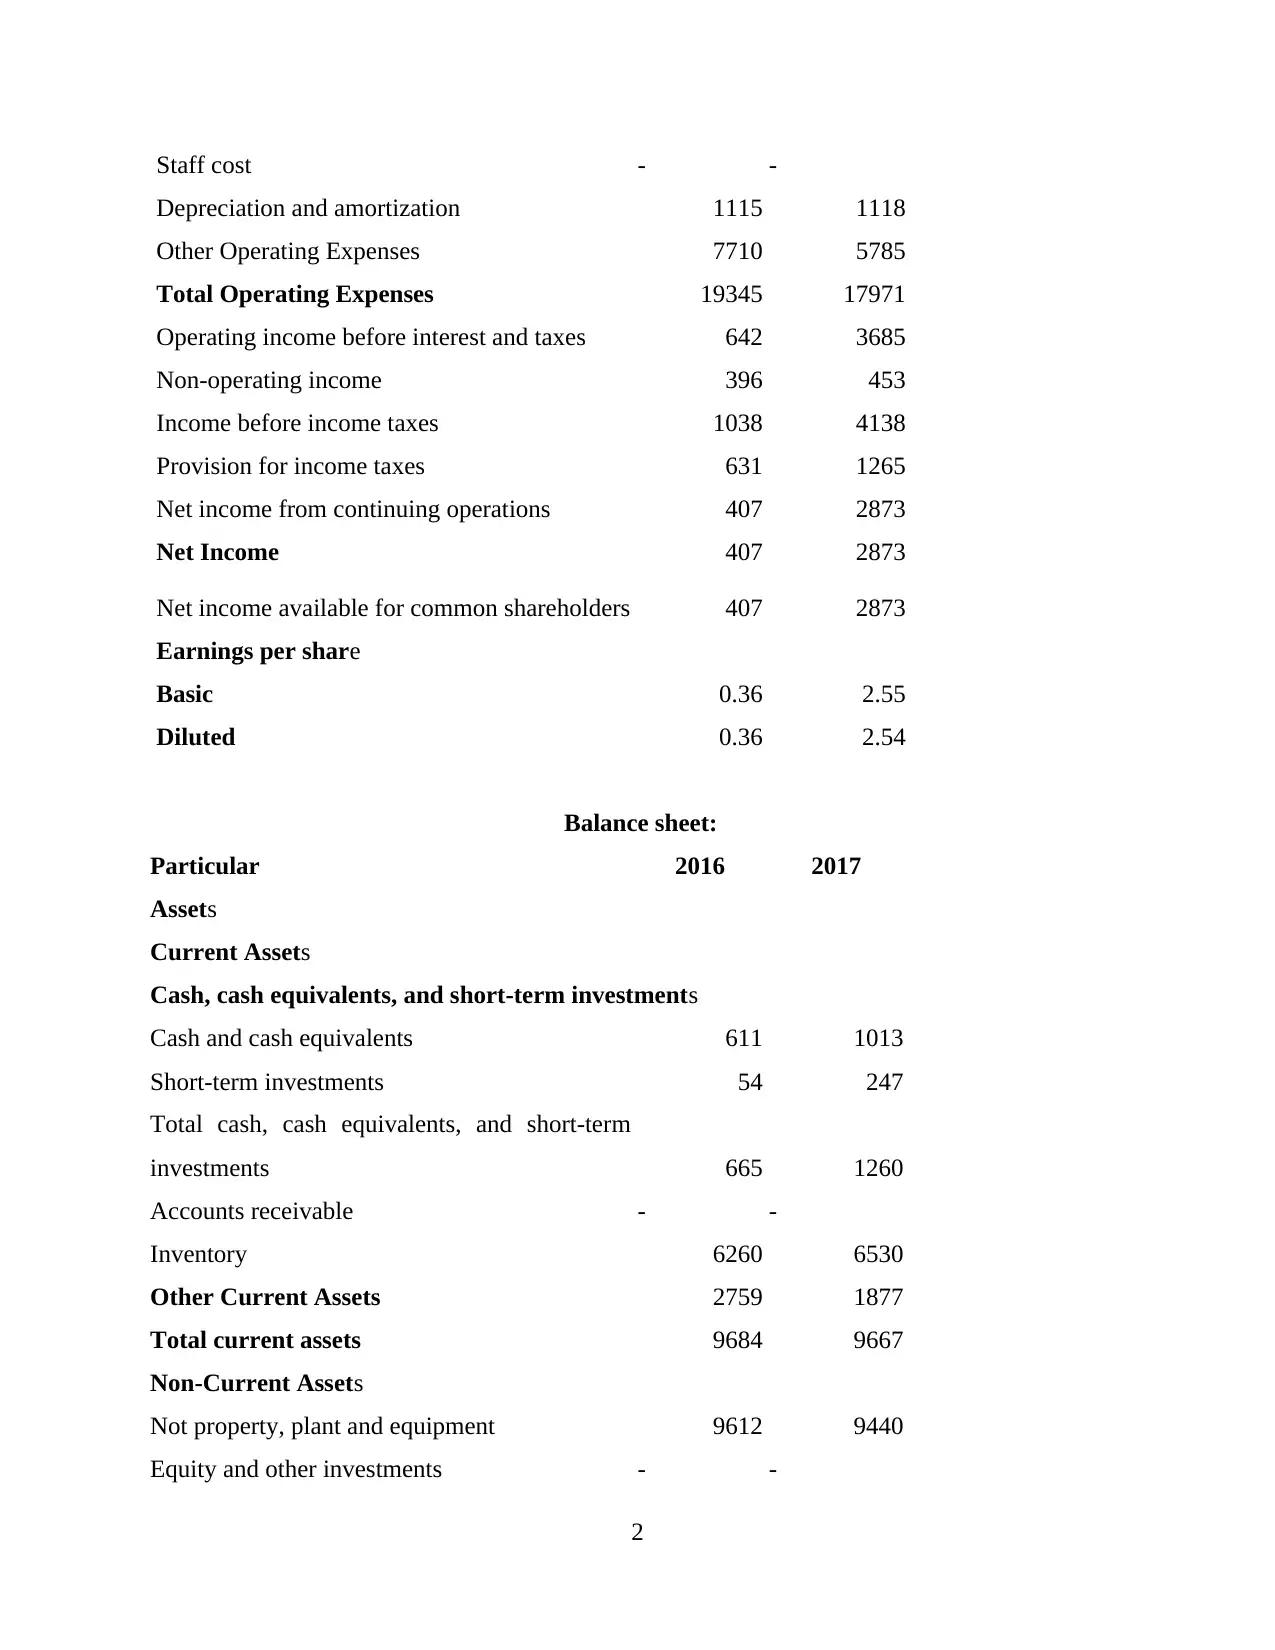
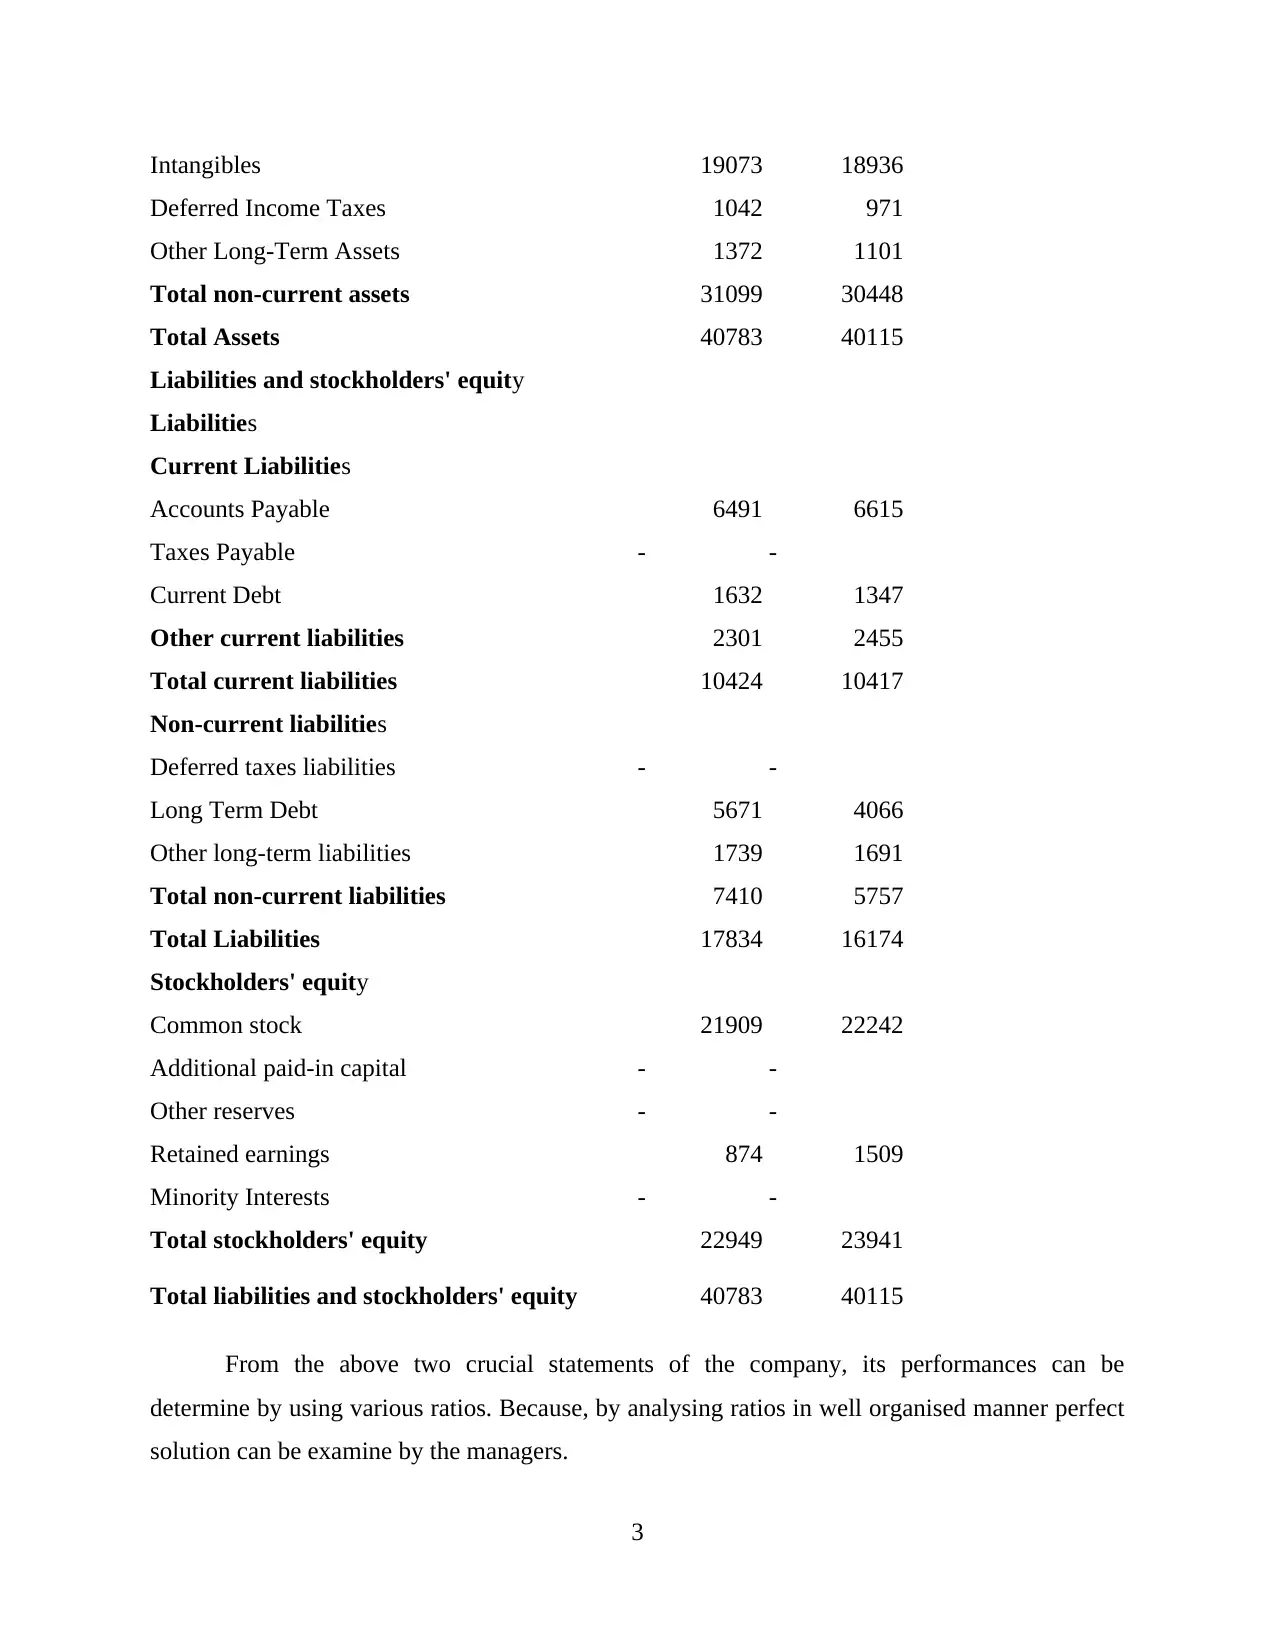
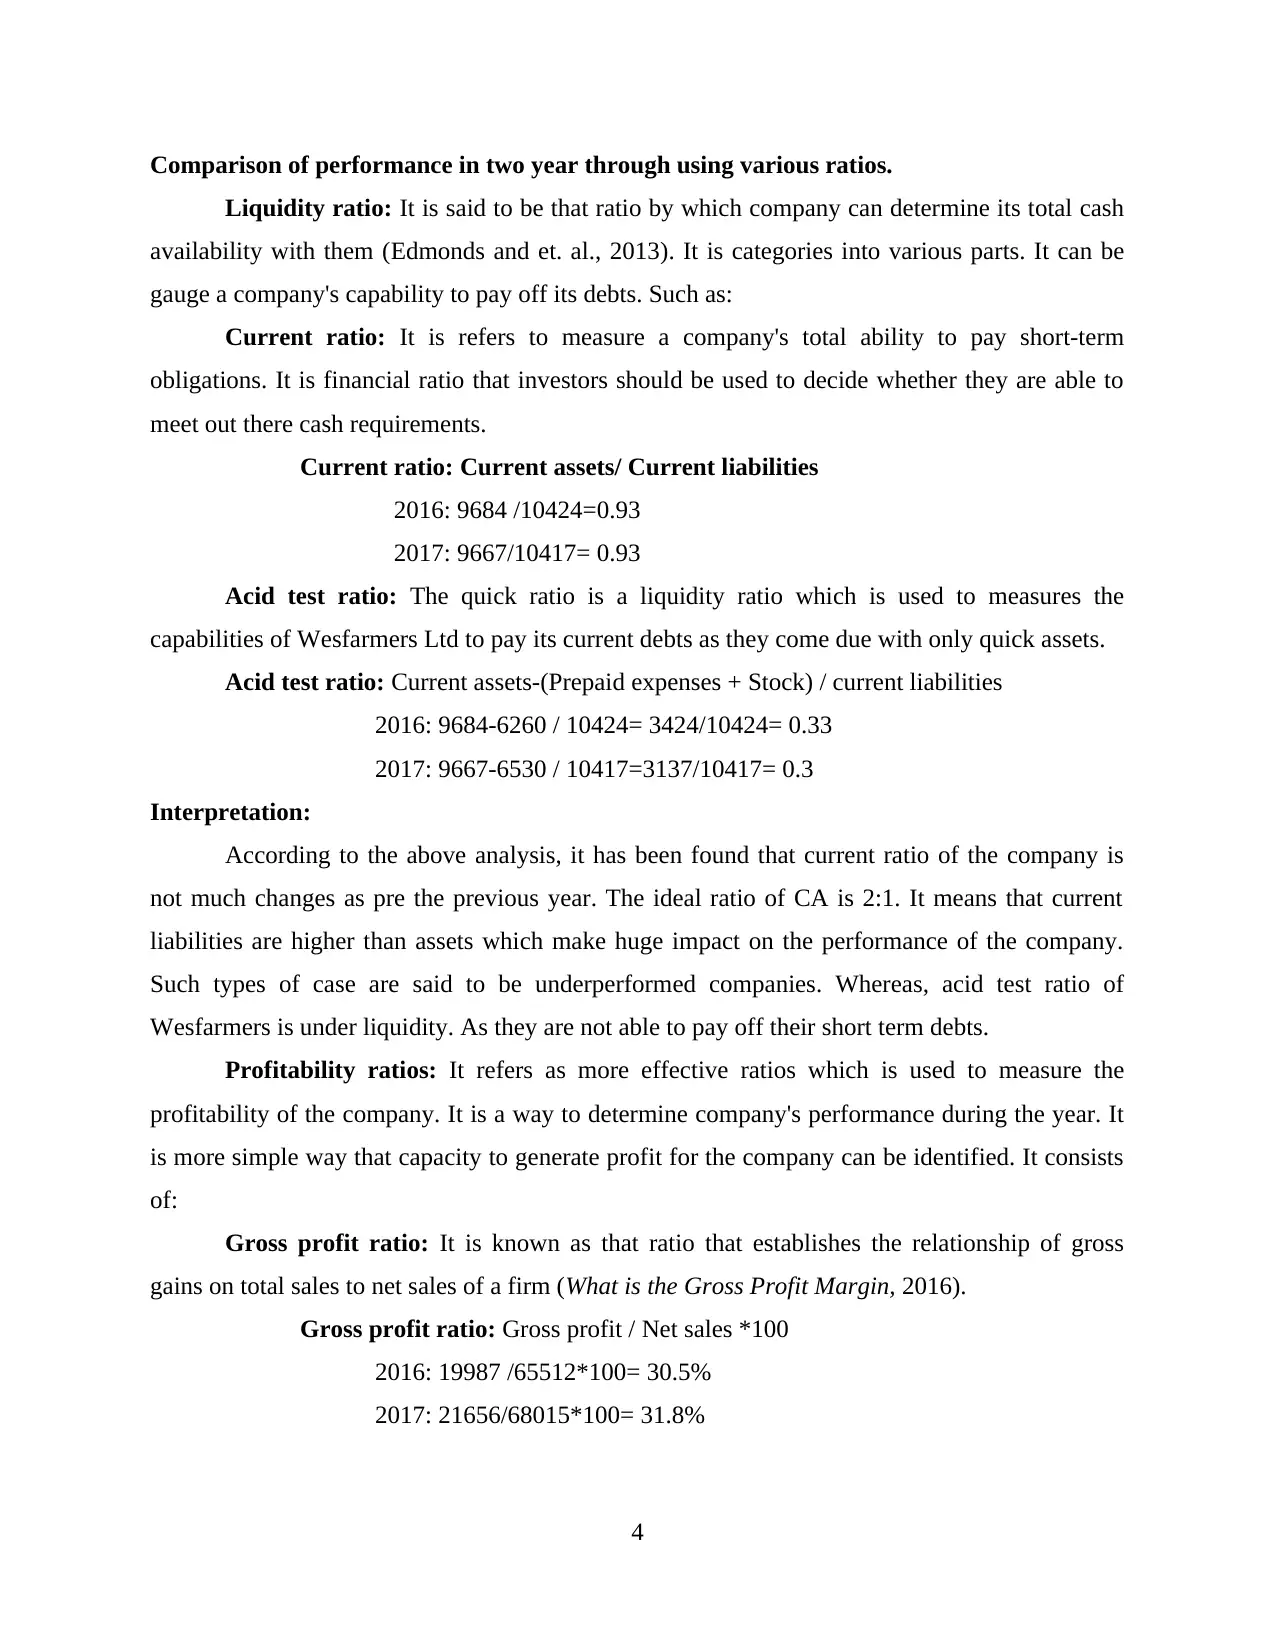
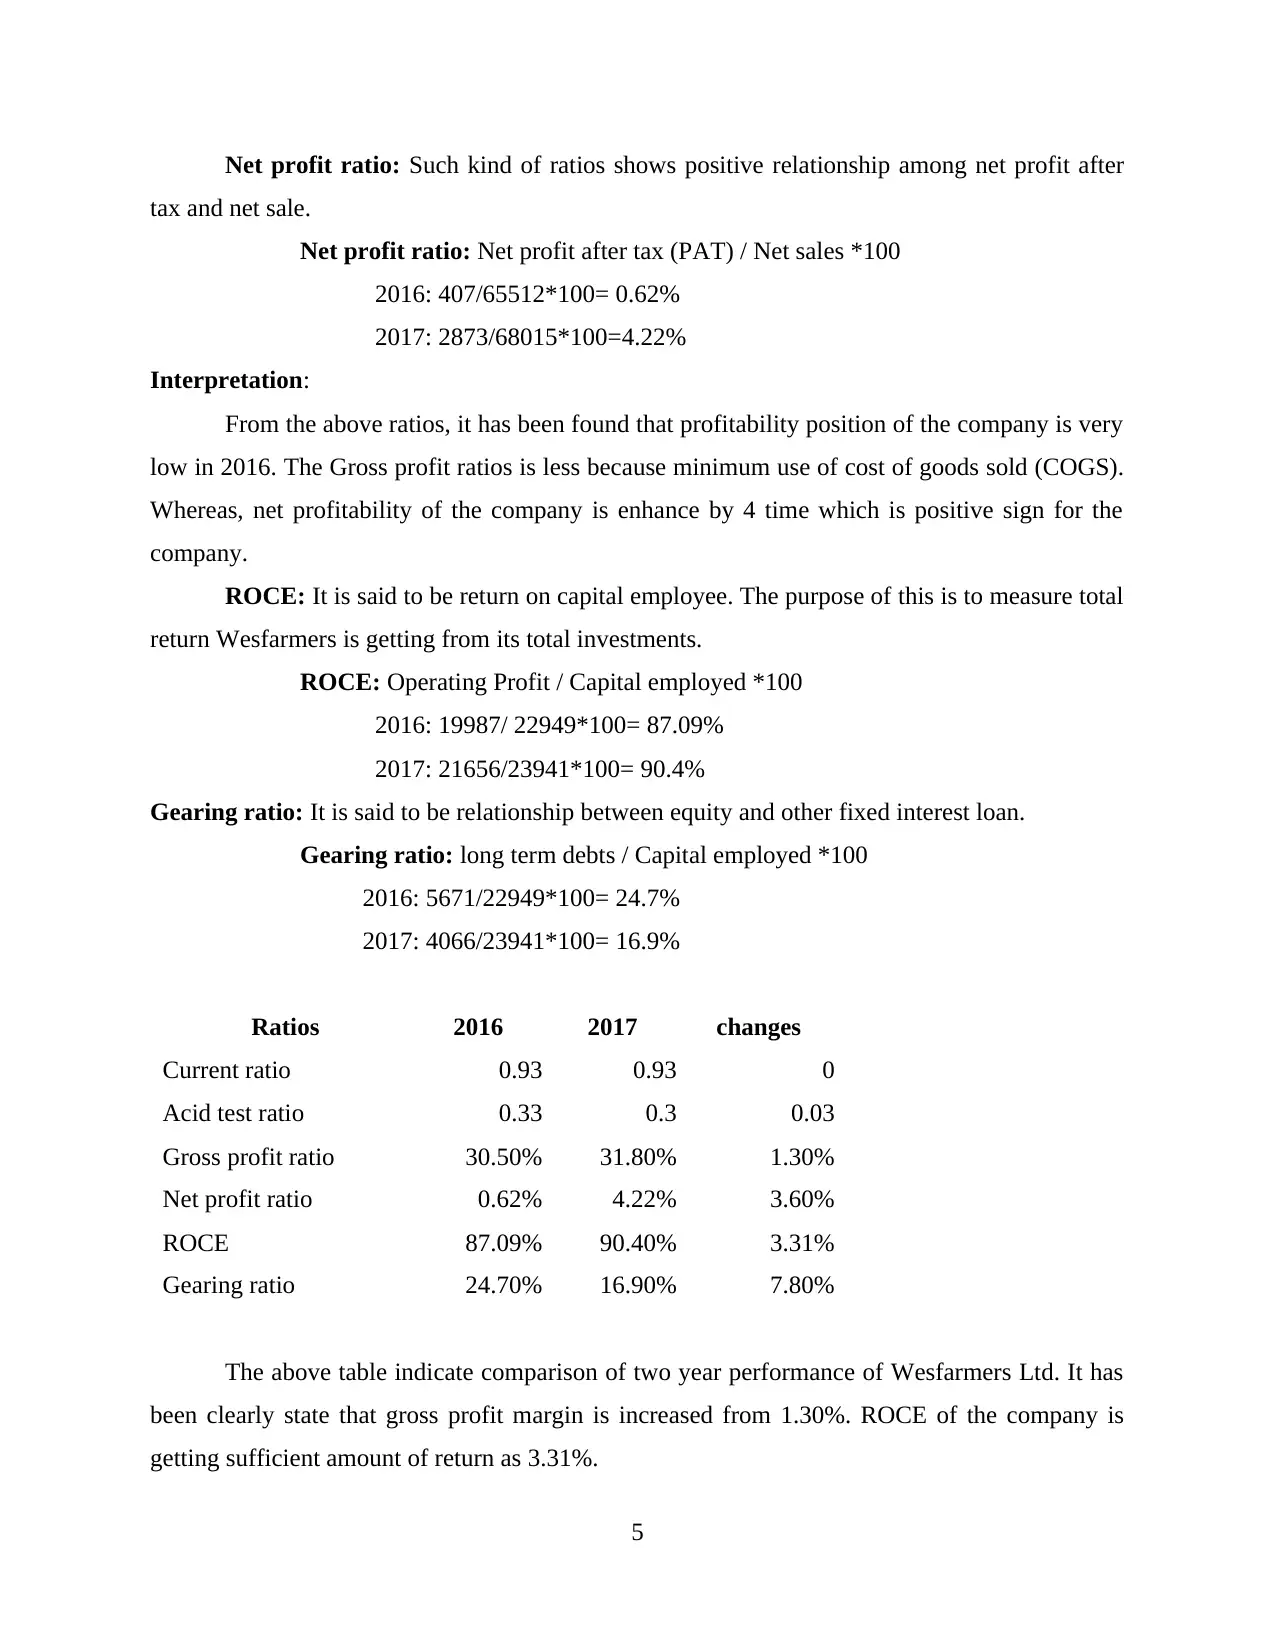
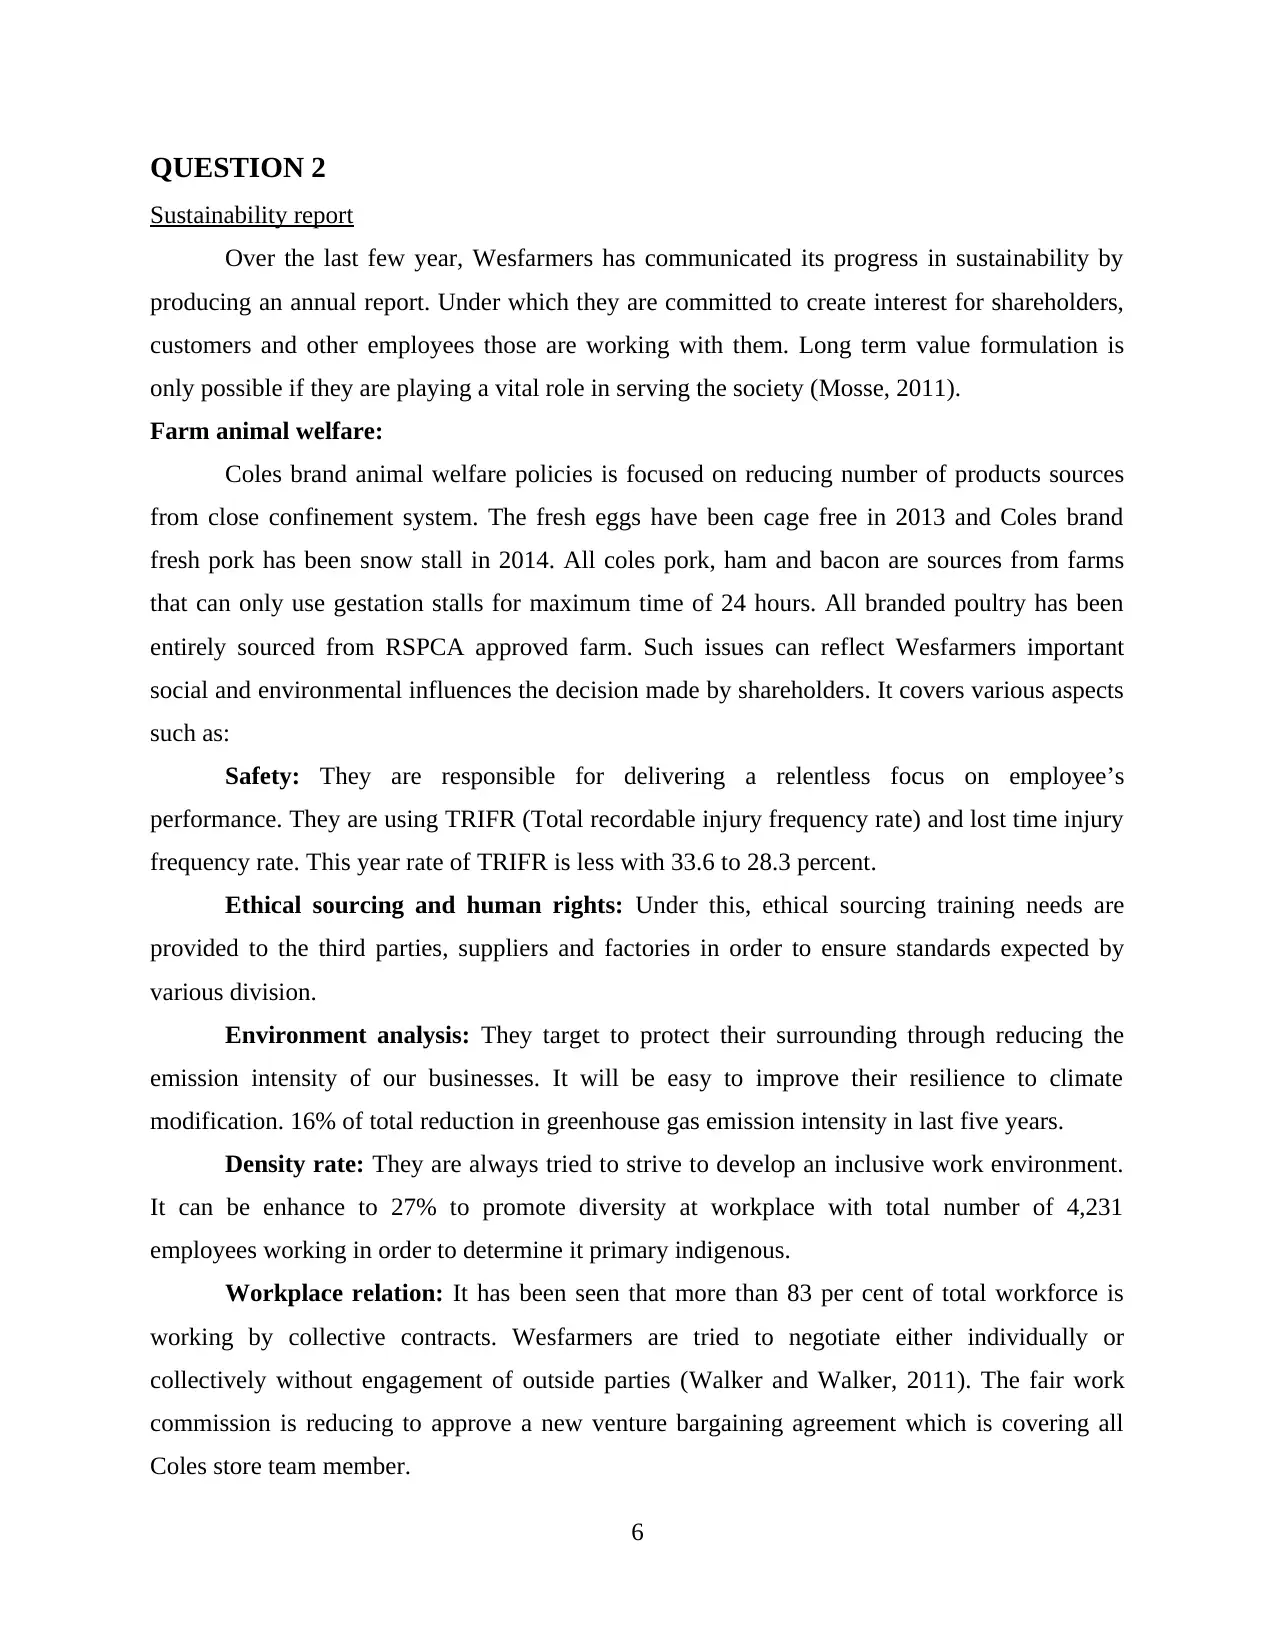
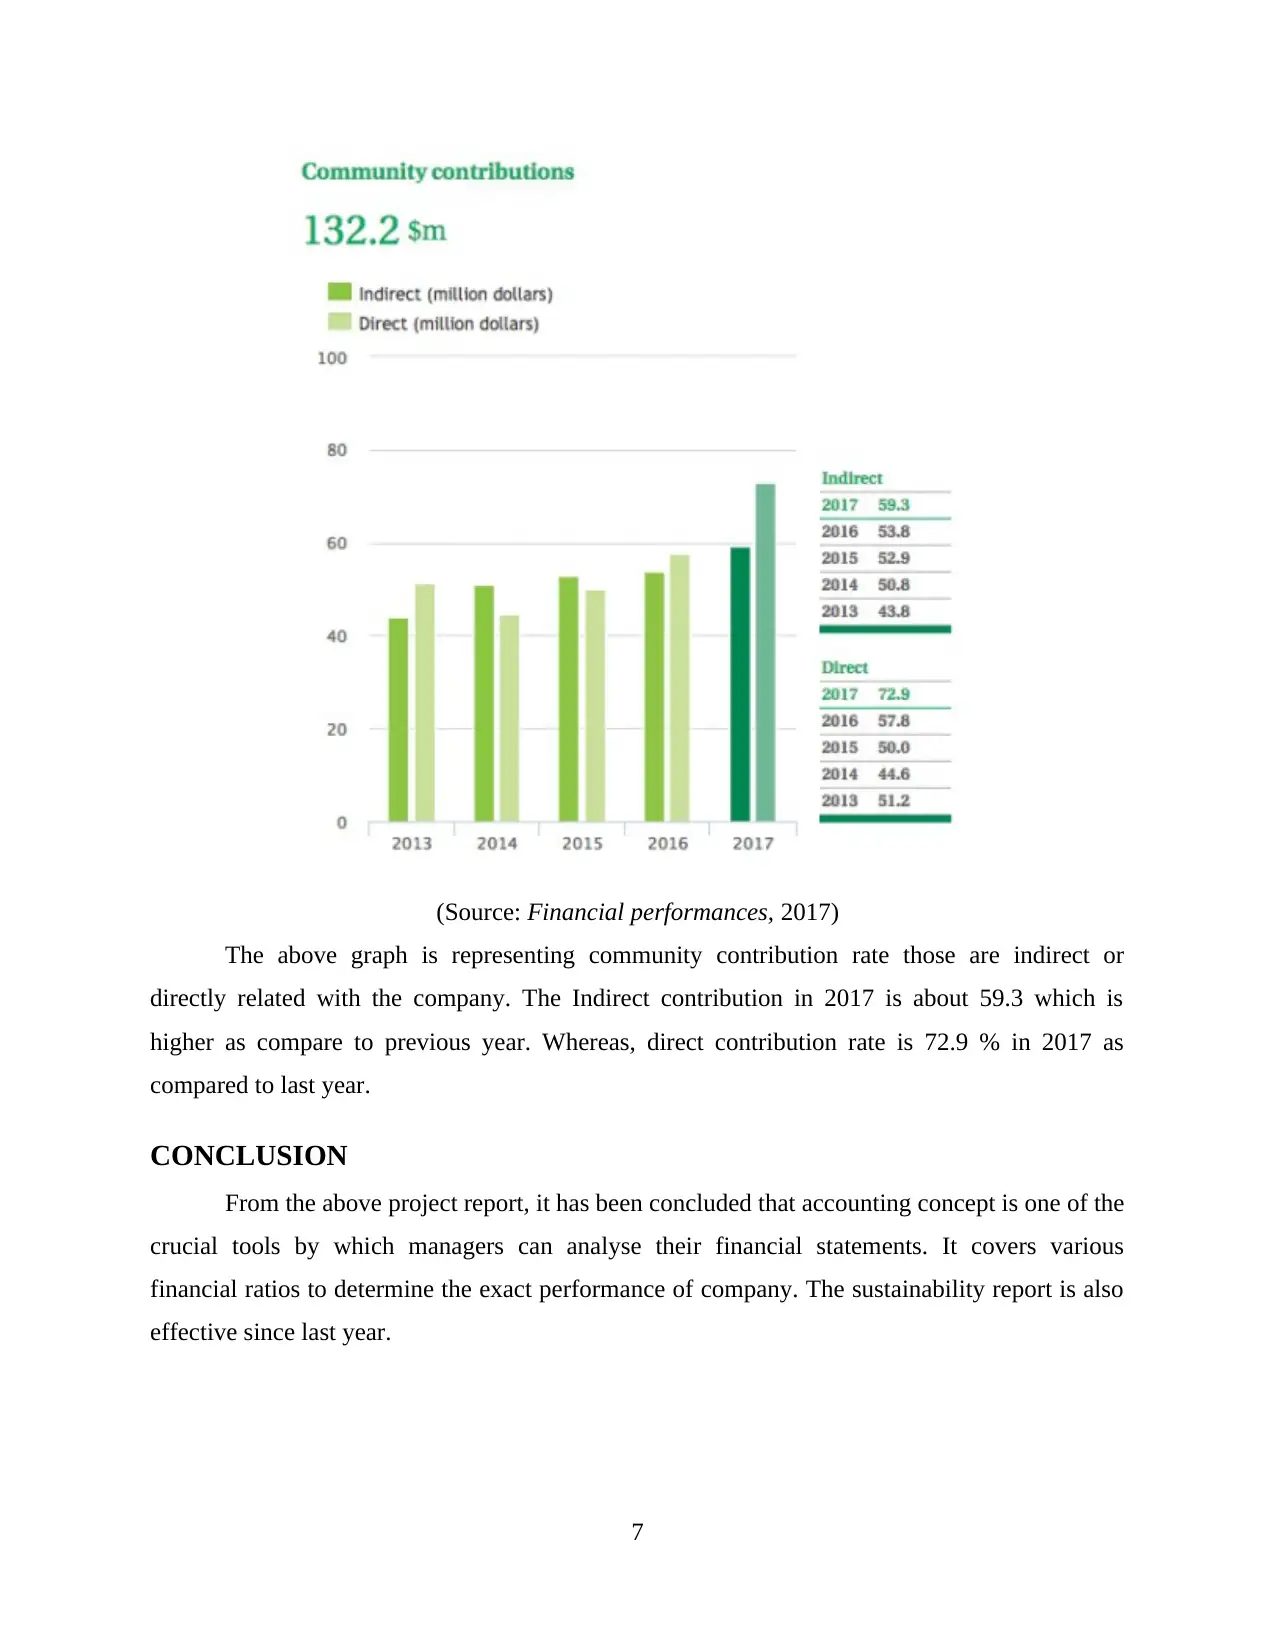
This report presents a detailed financial analysis of Wesfarmers Ltd, a prominent Australian conglomerate. The analysis utilizes various financial ratios, including liquidity, profitability, and gearing ratios, to evaluate the company's performance between 2016 and 2017. The report examines the income statement and balance sheet to derive insights into the company's financial health. The analysis covers key metrics such as current ratio, acid test ratio, gross profit ratio, net profit ratio, ROCE, and gearing ratio. In addition to financial performance, the report also includes a sustainability report, highlighting Wesfarmers' initiatives in areas such as animal welfare, safety, ethical sourcing, environmental analysis, and workplace relations, providing a holistic view of the company's operations and its commitment to various stakeholders. The report concludes with a summary of the key findings and references supporting the analysis.
tabler-icon-diamond-filled.svg

Contribute Materials

Your contribution can guide someone’s learning journey. Share your documents today.
Document Page
Accounting Concepts and
Practices
tabler-icon-diamond-filled.svg

Secure Best Marks with AI Grader

Need help grading? Try our AI Grader for instant feedback on your assignments.
Document Page
TABLE OF CONTENTS
INTRODUCTION...........................................................................................................................1
QUESTION 1...................................................................................................................................1
Financial performance analysis...................................................................................................1
QUESTION 2...................................................................................................................................5
Sustainability report....................................................................................................................5
CONCLUSION................................................................................................................................7
REFERENCES................................................................................................................................8
Document Page
INTRODUCTION
In business, there are various crucial aspects which are essential to be taken into account
so that proper functioning can be determined. Accounting practices are one of the important part
of every business organisation such as Wesfarmers. It can help in analysing the financial
statement of company during a year (Lunenburg and Ornstein, 2011). In this report, various tools
and techniques are used to examine the performance of company. The other part of this report
provides information about sustainability of the firm.
QUESTION 1
Financial performance analysis
Wesfarmers Ltd is well known Australian conglomerate public limited company. It is
situated in Perth and Western Australia. The company is generating total revenue of A$65.9
billion with total number of 220000 employees. Wesfarmers recorded a substantial enhance in
net profit for the year 2017 as compare to that previous year 2016. Underlying net profit after tax
is also at higher side with total of 22.1% to $2.873 million.
Earnings per share (EPS) is increase to 21.6% to a highest record of $2.55. Return on
equity is also jumped to 9.6 per cent to 12.4%. The main focus of company is to provide superior
return to shareholders for the long period of time. At this short term profits can be scarifies in
order to support long term business growth (Flamholtz, 2012). It is important for the company's
to determine their financial position in proper manner. By which, decision-making can be more
easy for them to plan their future. The best way to identified various outcomes then, manager
need to use financial statements of the company. Such as income statements, balance sheet and
cash flow statements.
Income statement of Wesfarmers Ltd
Particular 2016 2017
Revenue 65512 68015
Cost of Revenue 45525 46359
Gross Operating Profit 19987 21656
Operating expenses
Research and development - -
Sales, general and administrative 10520 11068
1
Document Page
Staff cost - -
Depreciation and amortization 1115 1118
Other Operating Expenses 7710 5785
Total Operating Expenses 19345 17971
Operating income before interest and taxes 642 3685
Non-operating income 396 453
Income before income taxes 1038 4138
Provision for income taxes 631 1265
Net income from continuing operations 407 2873
Net Income 407 2873
Net income available for common shareholders 407 2873
Earnings per share
Basic 0.36 2.55
Diluted 0.36 2.54
Balance sheet:
Particular 2016 2017
Assets
Current Assets
Cash, cash equivalents, and short-term investments
Cash and cash equivalents 611 1013
Short-term investments 54 247
Total cash, cash equivalents, and short-term
investments 665 1260
Accounts receivable - -
Inventory 6260 6530
Other Current Assets 2759 1877
Total current assets 9684 9667
Non-Current Assets
Not property, plant and equipment 9612 9440
Equity and other investments - -
2
tabler-icon-diamond-filled.svg

Secure Best Marks with AI Grader

Need help grading? Try our AI Grader for instant feedback on your assignments.
Document Page
Intangibles 19073 18936
Deferred Income Taxes 1042 971
Other Long-Term Assets 1372 1101
Total non-current assets 31099 30448
Total Assets 40783 40115
Liabilities and stockholders' equity
Liabilities
Current Liabilities
Accounts Payable 6491 6615
Taxes Payable - -
Current Debt 1632 1347
Other current liabilities 2301 2455
Total current liabilities 10424 10417
Non-current liabilities
Deferred taxes liabilities - -
Long Term Debt 5671 4066
Other long-term liabilities 1739 1691
Total non-current liabilities 7410 5757
Total Liabilities 17834 16174
Stockholders' equity
Common stock 21909 22242
Additional paid-in capital - -
Other reserves - -
Retained earnings 874 1509
Minority Interests - -
Total stockholders' equity 22949 23941
Total liabilities and stockholders' equity 40783 40115
From the above two crucial statements of the company, its performances can be
determine by using various ratios. Because, by analysing ratios in well organised manner perfect
solution can be examine by the managers.
3
Document Page
Comparison of performance in two year through using various ratios.
Liquidity ratio: It is said to be that ratio by which company can determine its total cash
availability with them (Edmonds and et. al., 2013). It is categories into various parts. It can be
gauge a company's capability to pay off its debts. Such as:
Current ratio: It is refers to measure a company's total ability to pay short-term
obligations. It is financial ratio that investors should be used to decide whether they are able to
meet out there cash requirements.
Current ratio: Current assets/ Current liabilities
2016: 9684 /10424=0.93
2017: 9667/10417= 0.93
Acid test ratio: The quick ratio is a liquidity ratio which is used to measures the
capabilities of Wesfarmers Ltd to pay its current debts as they come due with only quick assets.
Acid test ratio: Current assets-(Prepaid expenses + Stock) / current liabilities
2016: 9684-6260 / 10424= 3424/10424= 0.33
2017: 9667-6530 / 10417=3137/10417= 0.3
Interpretation:
According to the above analysis, it has been found that current ratio of the company is
not much changes as pre the previous year. The ideal ratio of CA is 2:1. It means that current
liabilities are higher than assets which make huge impact on the performance of the company.
Such types of case are said to be underperformed companies. Whereas, acid test ratio of
Wesfarmers is under liquidity. As they are not able to pay off their short term debts.
Profitability ratios: It refers as more effective ratios which is used to measure the
profitability of the company. It is a way to determine company's performance during the year. It
is more simple way that capacity to generate profit for the company can be identified. It consists
of:
Gross profit ratio: It is known as that ratio that establishes the relationship of gross
gains on total sales to net sales of a firm (What is the Gross Profit Margin, 2016).
Gross profit ratio: Gross profit / Net sales *100
2016: 19987 /65512*100= 30.5%
2017: 21656/68015*100= 31.8%
4
Document Page
Net profit ratio: Such kind of ratios shows positive relationship among net profit after
tax and net sale.
Net profit ratio: Net profit after tax (PAT) / Net sales *100
2016: 407/65512*100= 0.62%
2017: 2873/68015*100=4.22%
Interpretation:
From the above ratios, it has been found that profitability position of the company is very
low in 2016. The Gross profit ratios is less because minimum use of cost of goods sold (COGS).
Whereas, net profitability of the company is enhance by 4 time which is positive sign for the
company.
ROCE: It is said to be return on capital employee. The purpose of this is to measure total
return Wesfarmers is getting from its total investments.
ROCE: Operating Profit / Capital employed *100
2016: 19987/ 22949*100= 87.09%
2017: 21656/23941*100= 90.4%
Gearing ratio: It is said to be relationship between equity and other fixed interest loan.
Gearing ratio: long term debts / Capital employed *100
2016: 5671/22949*100= 24.7%
2017: 4066/23941*100= 16.9%
Ratios 2016 2017 changes
Current ratio 0.93 0.93 0
Acid test ratio 0.33 0.3 0.03
Gross profit ratio 30.50% 31.80% 1.30%
Net profit ratio 0.62% 4.22% 3.60%
ROCE 87.09% 90.40% 3.31%
Gearing ratio 24.70% 16.90% 7.80%
The above table indicate comparison of two year performance of Wesfarmers Ltd. It has
been clearly state that gross profit margin is increased from 1.30%. ROCE of the company is
getting sufficient amount of return as 3.31%.
5
tabler-icon-diamond-filled.svg

Paraphrase This Document

Need a fresh take? Get an instant paraphrase of this document with our AI Paraphraser
Document Page
QUESTION 2
Sustainability report
Over the last few year, Wesfarmers has communicated its progress in sustainability by
producing an annual report. Under which they are committed to create interest for shareholders,
customers and other employees those are working with them. Long term value formulation is
only possible if they are playing a vital role in serving the society (Mosse, 2011).
Farm animal welfare:
Coles brand animal welfare policies is focused on reducing number of products sources
from close confinement system. The fresh eggs have been cage free in 2013 and Coles brand
fresh pork has been snow stall in 2014. All coles pork, ham and bacon are sources from farms
that can only use gestation stalls for maximum time of 24 hours. All branded poultry has been
entirely sourced from RSPCA approved farm. Such issues can reflect Wesfarmers important
social and environmental influences the decision made by shareholders. It covers various aspects
such as:
Safety: They are responsible for delivering a relentless focus on employee’s
performance. They are using TRIFR (Total recordable injury frequency rate) and lost time injury
frequency rate. This year rate of TRIFR is less with 33.6 to 28.3 percent.
Ethical sourcing and human rights: Under this, ethical sourcing training needs are
provided to the third parties, suppliers and factories in order to ensure standards expected by
various division.
Environment analysis: They target to protect their surrounding through reducing the
emission intensity of our businesses. It will be easy to improve their resilience to climate
modification. 16% of total reduction in greenhouse gas emission intensity in last five years.
Density rate: They are always tried to strive to develop an inclusive work environment.
It can be enhance to 27% to promote diversity at workplace with total number of 4,231
employees working in order to determine it primary indigenous.
Workplace relation: It has been seen that more than 83 per cent of total workforce is
working by collective contracts. Wesfarmers are tried to negotiate either individually or
collectively without engagement of outside parties (Walker and Walker, 2011). The fair work
commission is reducing to approve a new venture bargaining agreement which is covering all
Coles store team member.
6
Document Page
(Source: Financial performances, 2017)
The above graph is representing community contribution rate those are indirect or
directly related with the company. The Indirect contribution in 2017 is about 59.3 which is
higher as compare to previous year. Whereas, direct contribution rate is 72.9 % in 2017 as
compared to last year.
CONCLUSION
From the above project report, it has been concluded that accounting concept is one of the
crucial tools by which managers can analyse their financial statements. It covers various
financial ratios to determine the exact performance of company. The sustainability report is also
effective since last year.
7
Document Page
REFERENCES
Books and Journals:
Edmonds, T. P. & et. al. (2013). Fundamental financial accounting concepts. New York, NY:
McGraw-Hill Irwin.
Flamholtz, E. G. (2012). Human resource accounting: Advances in concepts, methods and
applications. Springer Science & Business Media.
Lunenburg, F. C. & Ornstein, A. C. (2011). Educational administration: Concepts and practices.
Cengage Learning.
Mosse, D. (Ed.). (2011). Adventures in Aidland: The anthropology of professionals in
international development (Vol. 6). Berghahn Books.
Walker, J. R. & Walker, J. T. (2011). Tourism concepts and practices. Pearson Education India.
Online
What is the Gross Profit Margin?. 2016. [Online] Available through:
<https://www.thebalance.com/what-is-the-gross-profit-margin-393201>.
Financial performances. 2017. [Online] Available through:
<http://financials.morningstar.com/ratios/r.html?t=WES&region=aus&culture=en-US>.
8
chevron_up_icon
1 out of 10
circle_padding
hide_on_mobile
zoom_out_icon
logo.png

Your All-in-One AI-Powered Toolkit for Academic Success.

Available 24*7 on WhatsApp / Email

[object Object]