Financial Analysis and Peer Comparison: Wesfarmers Limited Report
VerifiedAdded on 2022/08/18
|14
|2783
|13
Report
AI Summary
This report provides a comprehensive financial analysis of Wesfarmers Limited, an Australian conglomerate, examining its performance over a five-year period. The analysis employs various ratio analysis techniques, including profitability (Return on Equity), liquidity, efficiency (Total Asset Turnover), and capital structure (Debt Ratio) to assess the company's financial health. Furthermore, the report utilizes the Du Pont analysis to evaluate the factors driving Wesfarmers' Return on Equity. A crucial aspect of the report involves a peer comparison between Wesfarmers and Wal-Mart, evaluating their financial performance across key metrics. The report concludes with recommendations for Wesfarmers to improve its financial standing and provides insights for potential investors, highlighting Wesfarmers' strengths and areas for improvement. The reflection section discusses the importance of ethical financial reporting and the role of financial managers.
Running head: Wesfarmers Limited 1
Wesfarmers Limited
Wesfarmers Limited
Paraphrase This Document
Need a fresh take? Get an instant paraphrase of this document with our AI Paraphraser
Wesfarmers Limited
Executive Summary
Wesfarmers is one of the most trusted brands of Australia in retail business and in this report a
detailed analysis of the financial statements has been carried out to understand the performance
with respect to each area. The ratio analysis techniques have been implemented individually for
the period of 5 years as well as alongside one of the most competitive company Wal-Mart. Each
are has been scrutinized carefully and Wesfarmers is a good buy from the point of view of the
investors and the shareholders due to higher return on equity. The entire report answers
Wesfarmers to be a good buy for short term duration and adopt strategies and recommendations
to hold shares for longer duration.
Wesfarmers Limited
Contents
Executive Summary.....................................................................................................................................2
Part 1: Analysis of Wesfarmers...................................................................................................................4
Wesfarmers Limited Overview................................................................................................................4
Ratio Analysis.........................................................................................................................................4
Profitability..........................................................................................................................................4
Liquidity..............................................................................................................................................5
Efficiency............................................................................................................................................5
Capital Structure..................................................................................................................................6
Du Pont Analysis.....................................................................................................................................7
Peer Comparisons....................................................................................................................................8
Recommendations and Conclusions......................................................................................................11
Part 2: Reflection.......................................................................................................................................11
References.................................................................................................................................................13
⊘ This is a preview!⊘
Do you want full access?
Subscribe today to unlock all pages.
Trusted by 1+ million students worldwide
Wesfarmers Limited
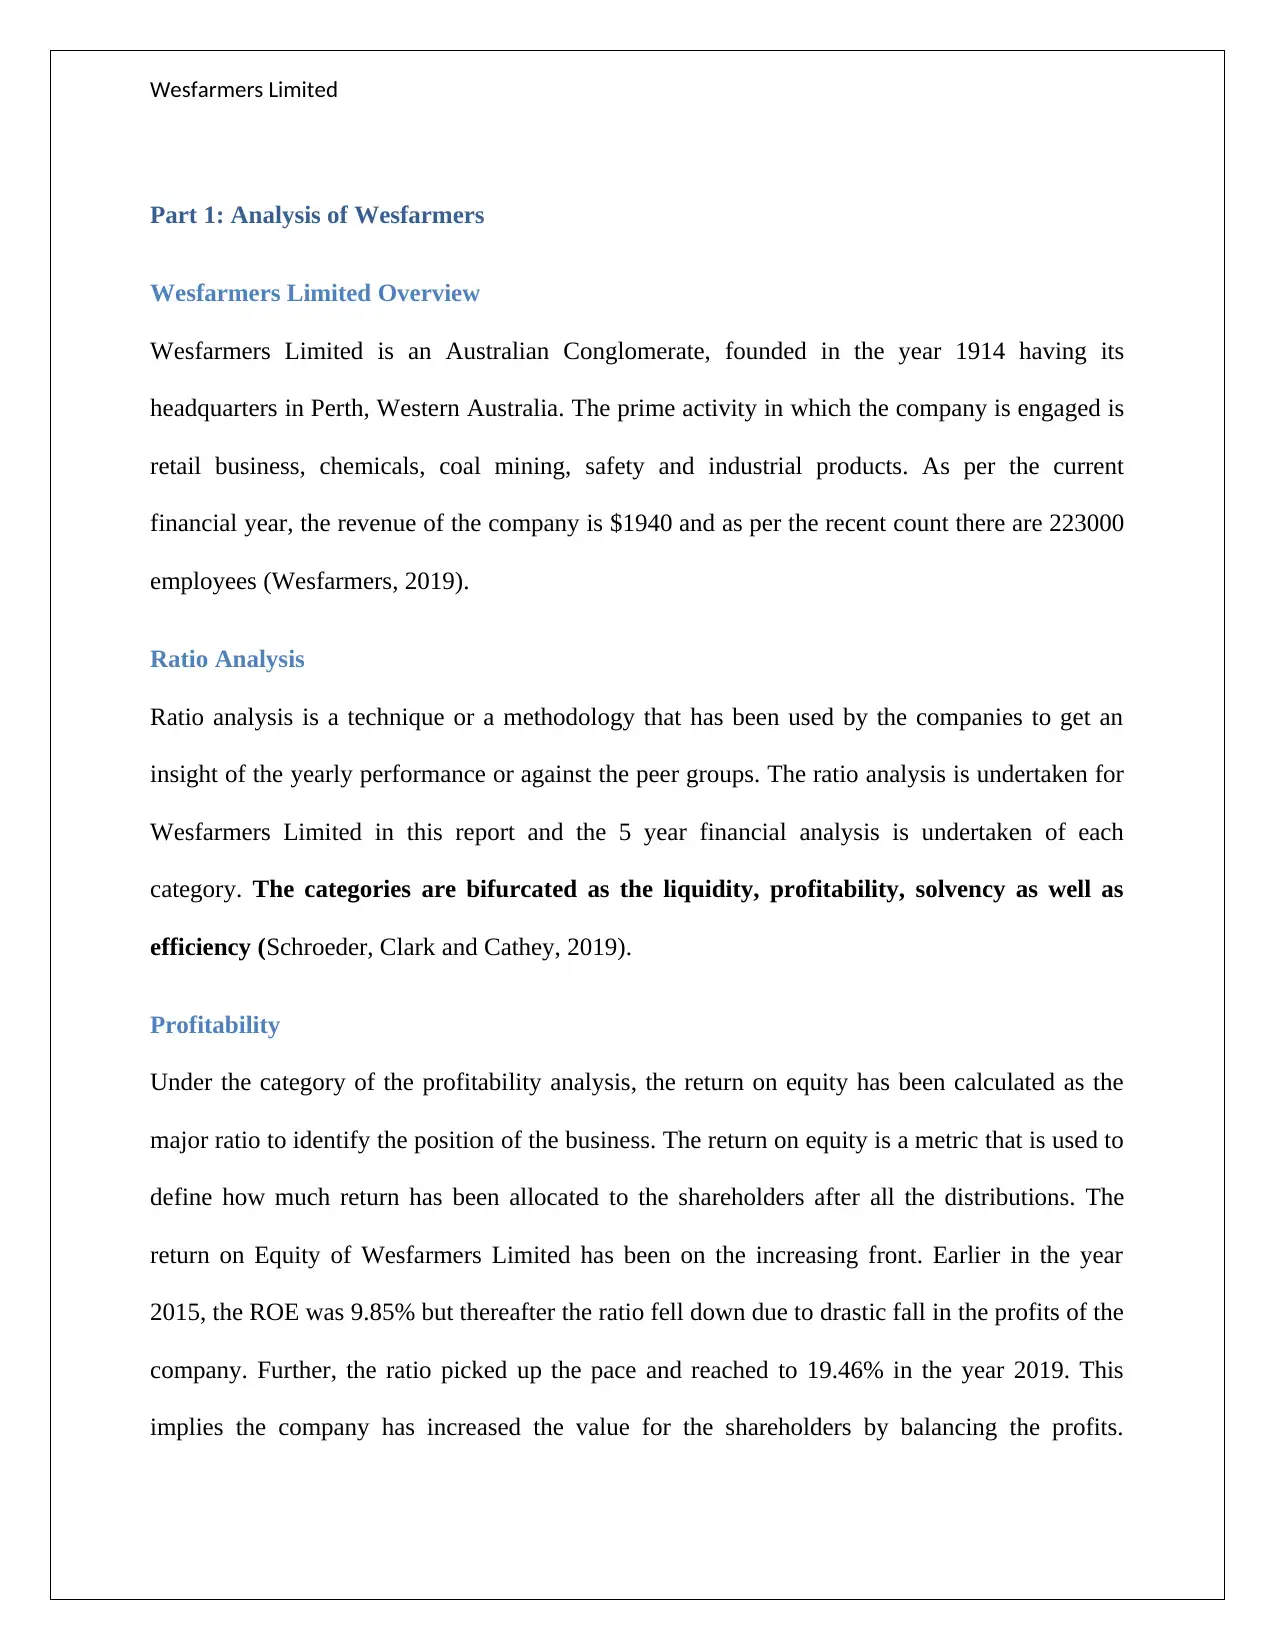
Part 1: Analysis of Wesfarmers
Wesfarmers Limited Overview
Wesfarmers Limited is an Australian Conglomerate, founded in the year 1914 having its
headquarters in Perth, Western Australia. The prime activity in which the company is engaged is
retail business, chemicals, coal mining, safety and industrial products. As per the current
financial year, the revenue of the company is $1940 and as per the recent count there are 223000
employees (Wesfarmers, 2019).
Ratio Analysis
Ratio analysis is a technique or a methodology that has been used by the companies to get an
insight of the yearly performance or against the peer groups. The ratio analysis is undertaken for
Wesfarmers Limited in this report and the 5 year financial analysis is undertaken of each
category. The categories are bifurcated as the liquidity, profitability, solvency as well as
efficiency (Schroeder, Clark and Cathey, 2019).
Profitability
Under the category of the profitability analysis, the return on equity has been calculated as the
major ratio to identify the position of the business. The return on equity is a metric that is used to
define how much return has been allocated to the shareholders after all the distributions. The
return on Equity of Wesfarmers Limited has been on the increasing front. Earlier in the year
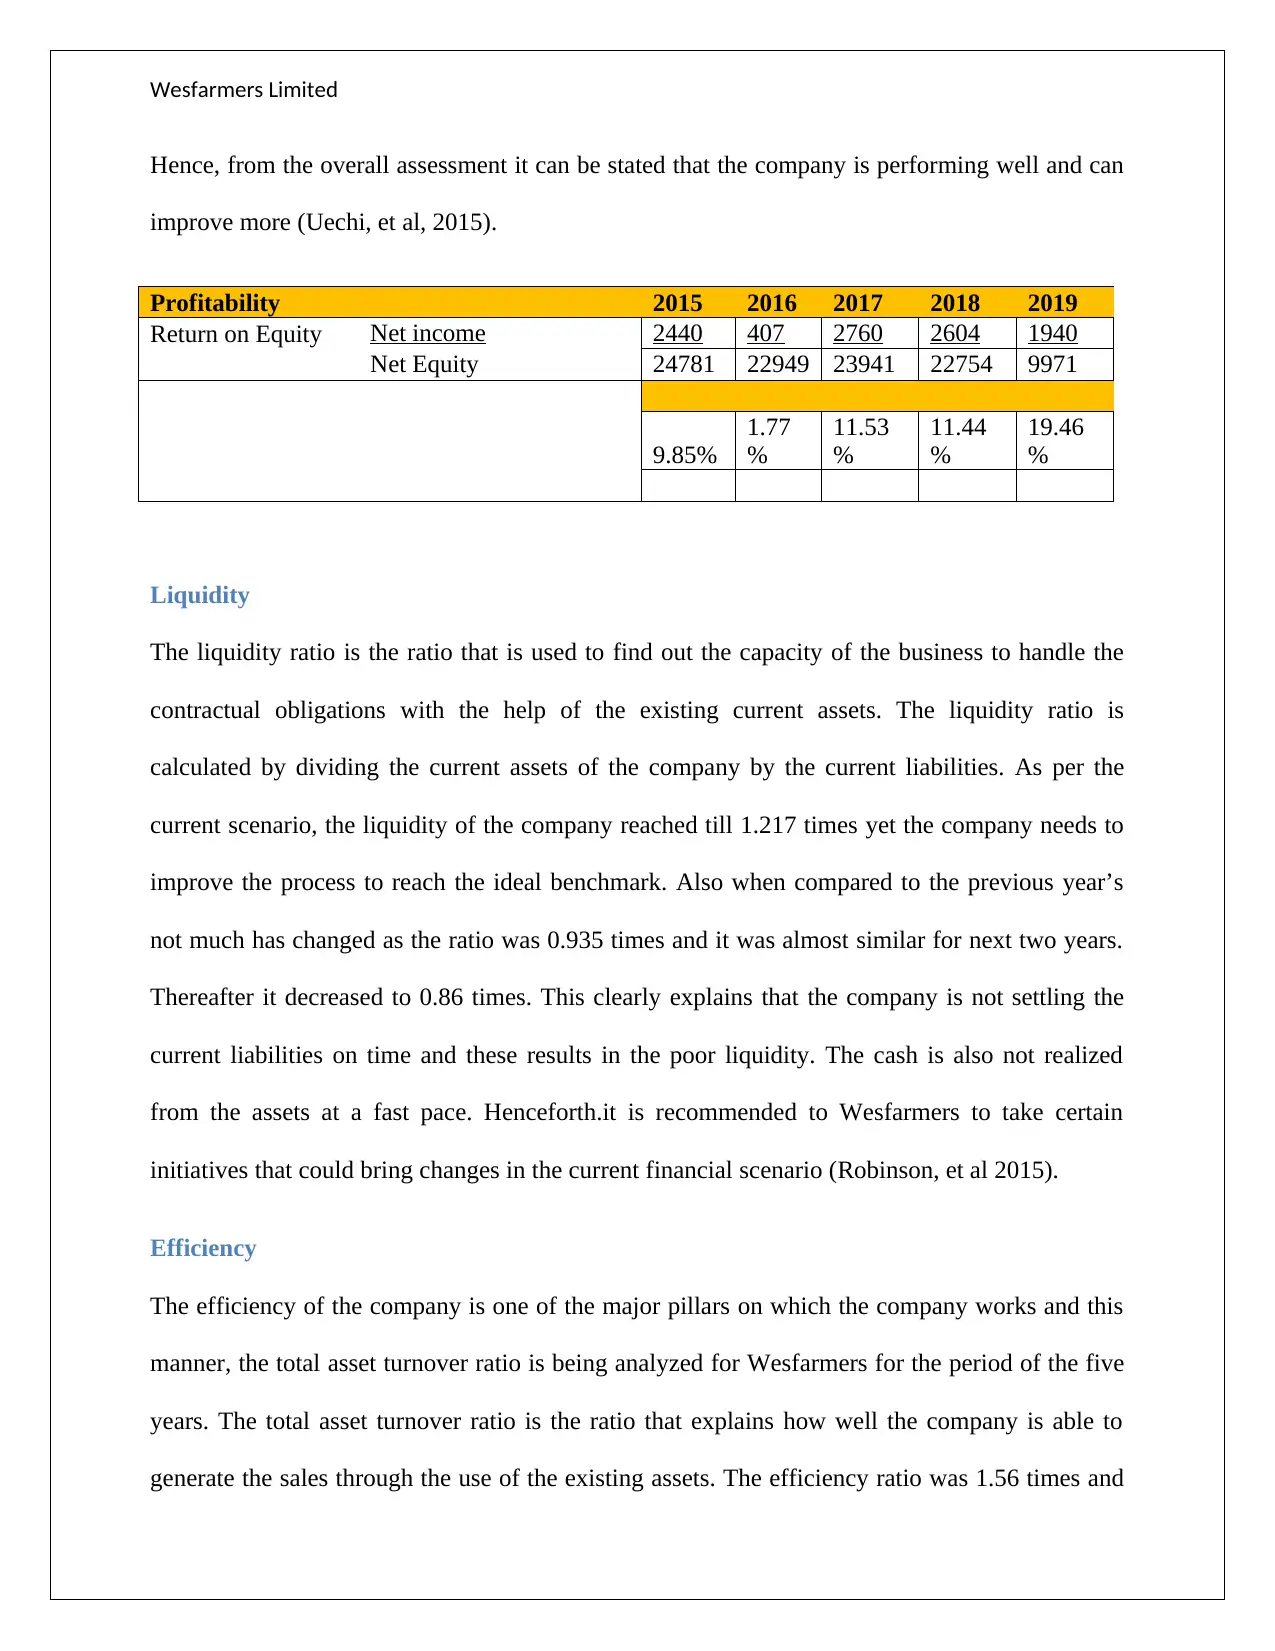
2015, the ROE was 9.85% but thereafter the ratio fell down due to drastic fall in the profits of the
company. Further, the ratio picked up the pace and reached to 19.46% in the year 2019. This
implies the company has increased the value for the shareholders by balancing the profits.
Part 1: Analysis of Wesfarmers
Wesfarmers Limited Overview
Wesfarmers Limited is an Australian Conglomerate, founded in the year 1914 having its
headquarters in Perth, Western Australia. The prime activity in which the company is engaged is
retail business, chemicals, coal mining, safety and industrial products. As per the current
financial year, the revenue of the company is $1940 and as per the recent count there are 223000
employees (Wesfarmers, 2019).
Ratio Analysis
Ratio analysis is a technique or a methodology that has been used by the companies to get an
insight of the yearly performance or against the peer groups. The ratio analysis is undertaken for
Wesfarmers Limited in this report and the 5 year financial analysis is undertaken of each
category. The categories are bifurcated as the liquidity, profitability, solvency as well as
efficiency (Schroeder, Clark and Cathey, 2019).
Profitability
Under the category of the profitability analysis, the return on equity has been calculated as the
major ratio to identify the position of the business. The return on equity is a metric that is used to
define how much return has been allocated to the shareholders after all the distributions. The
return on Equity of Wesfarmers Limited has been on the increasing front. Earlier in the year
2015, the ROE was 9.85% but thereafter the ratio fell down due to drastic fall in the profits of the
company. Further, the ratio picked up the pace and reached to 19.46% in the year 2019. This
implies the company has increased the value for the shareholders by balancing the profits.
Paraphrase This Document
Need a fresh take? Get an instant paraphrase of this document with our AI Paraphraser
Wesfarmers Limited
Hence, from the overall assessment it can be stated that the company is performing well and can
improve more (Uechi, et al, 2015).
Profitability 2015 2016 2017 2018 2019
Return on Equity Net income 2440 407 2760 2604 1940
Net Equity 24781 22949 23941 22754 9971
9.85%
1.77
%
11.53
%
11.44
%
19.46
%
Liquidity
The liquidity ratio is the ratio that is used to find out the capacity of the business to handle the
contractual obligations with the help of the existing current assets. The liquidity ratio is
calculated by dividing the current assets of the company by the current liabilities. As per the
current scenario, the liquidity of the company reached till 1.217 times yet the company needs to
improve the process to reach the ideal benchmark. Also when compared to the previous year’s
not much has changed as the ratio was 0.935 times and it was almost similar for next two years.
Thereafter it decreased to 0.86 times. This clearly explains that the company is not settling the
current liabilities on time and these results in the poor liquidity. The cash is also not realized
from the assets at a fast pace. Henceforth.it is recommended to Wesfarmers to take certain
initiatives that could bring changes in the current financial scenario (Robinson, et al 2015).
Efficiency
The efficiency of the company is one of the major pillars on which the company works and this
manner, the total asset turnover ratio is being analyzed for Wesfarmers for the period of the five
years. The total asset turnover ratio is the ratio that explains how well the company is able to
generate the sales through the use of the existing assets. The efficiency ratio was 1.56 times and
Wesfarmers Limited
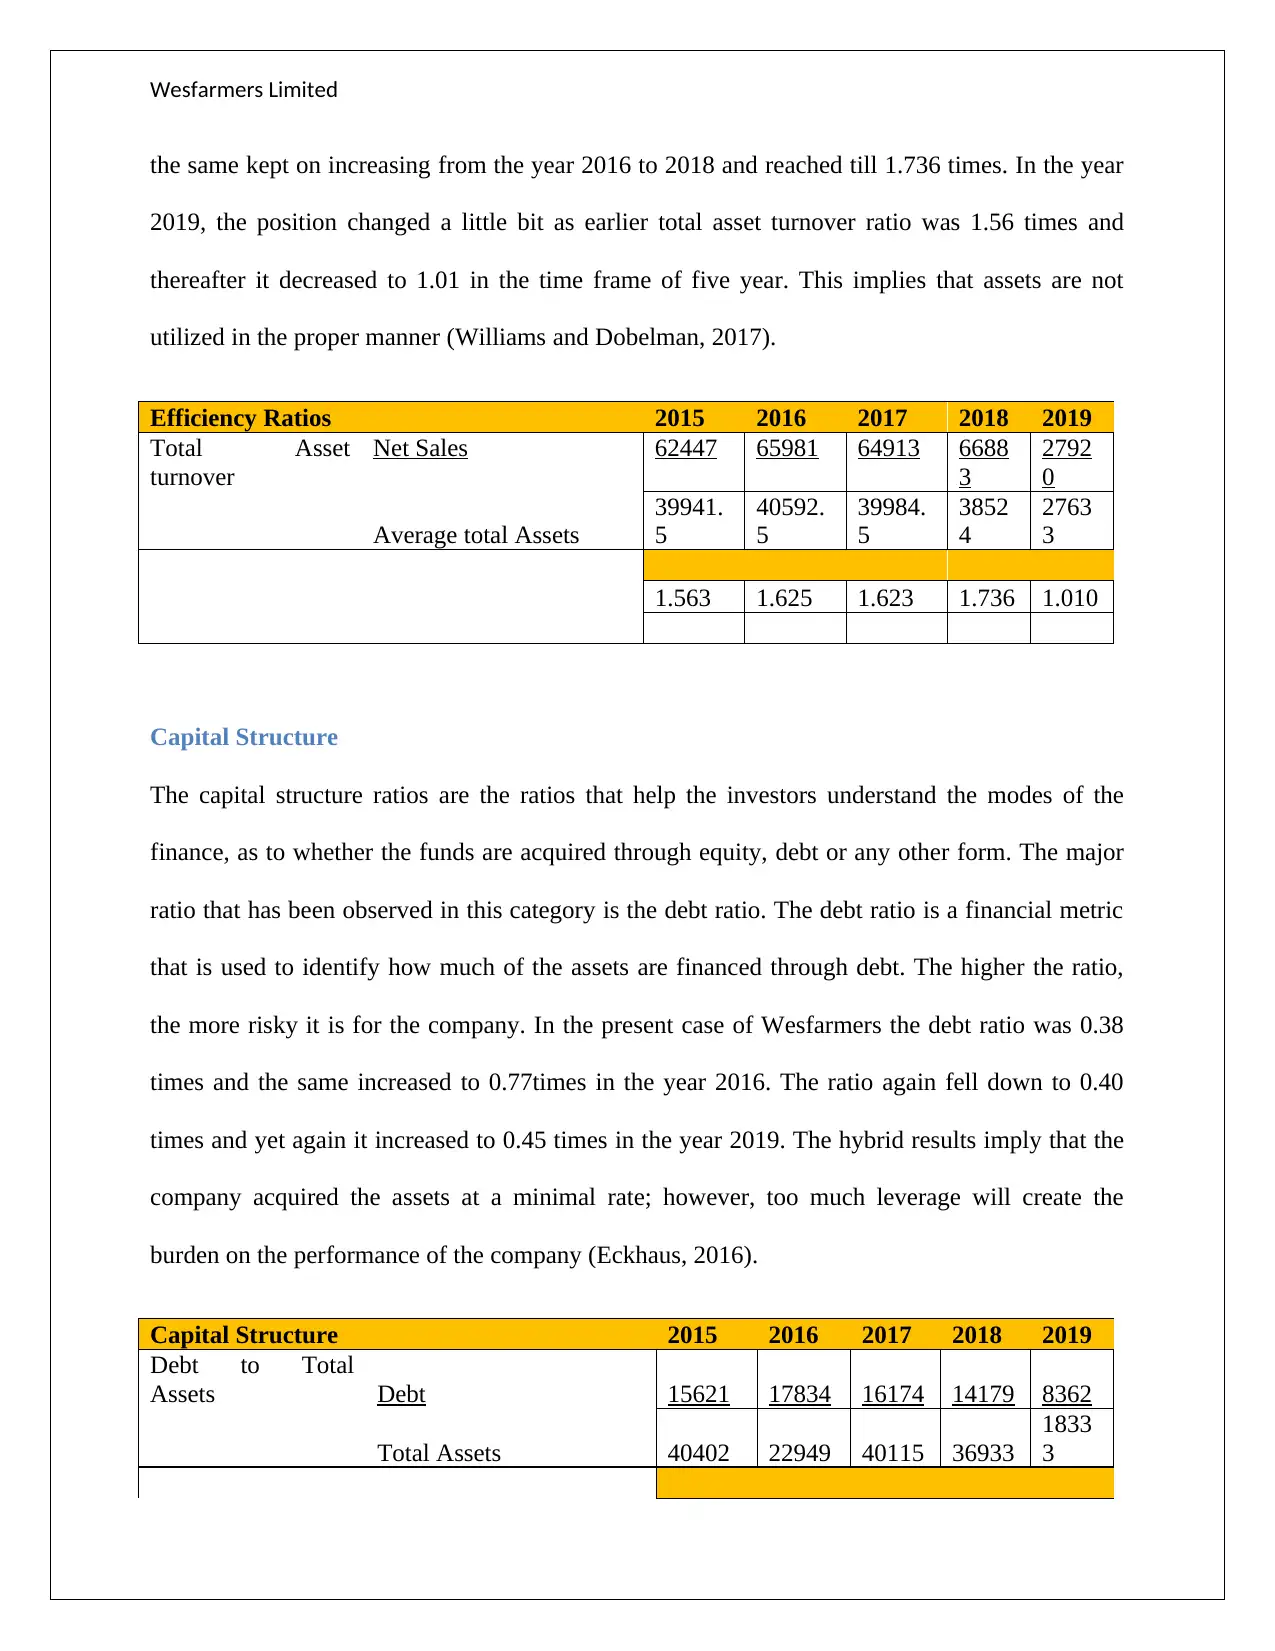
the same kept on increasing from the year 2016 to 2018 and reached till 1.736 times. In the year
2019, the position changed a little bit as earlier total asset turnover ratio was 1.56 times and
thereafter it decreased to 1.01 in the time frame of five year. This implies that assets are not
utilized in the proper manner (Williams and Dobelman, 2017).
Efficiency Ratios 2015 2016 2017 2018 2019
Total Asset
turnover
Net Sales 62447 65981 64913 6688
3
2792
0
Average total Assets
39941.
5
40592.
5
39984.
5
3852
4
2763
3
1.563 1.625 1.623 1.736 1.010
Capital Structure
The capital structure ratios are the ratios that help the investors understand the modes of the
finance, as to whether the funds are acquired through equity, debt or any other form. The major
ratio that has been observed in this category is the debt ratio. The debt ratio is a financial metric
that is used to identify how much of the assets are financed through debt. The higher the ratio,
the more risky it is for the company. In the present case of Wesfarmers the debt ratio was 0.38
times and the same increased to 0.77times in the year 2016. The ratio again fell down to 0.40
times and yet again it increased to 0.45 times in the year 2019. The hybrid results imply that the
company acquired the assets at a minimal rate; however, too much leverage will create the
burden on the performance of the company (Eckhaus, 2016).
Capital Structure 2015 2016 2017 2018 2019
Debt to Total
Assets Debt 15621 17834 16174 14179 8362
Total Assets 40402 22949 40115 36933
1833
3
⊘ This is a preview!⊘
Do you want full access?
Subscribe today to unlock all pages.
Trusted by 1+ million students worldwide
Wesfarmers Limited
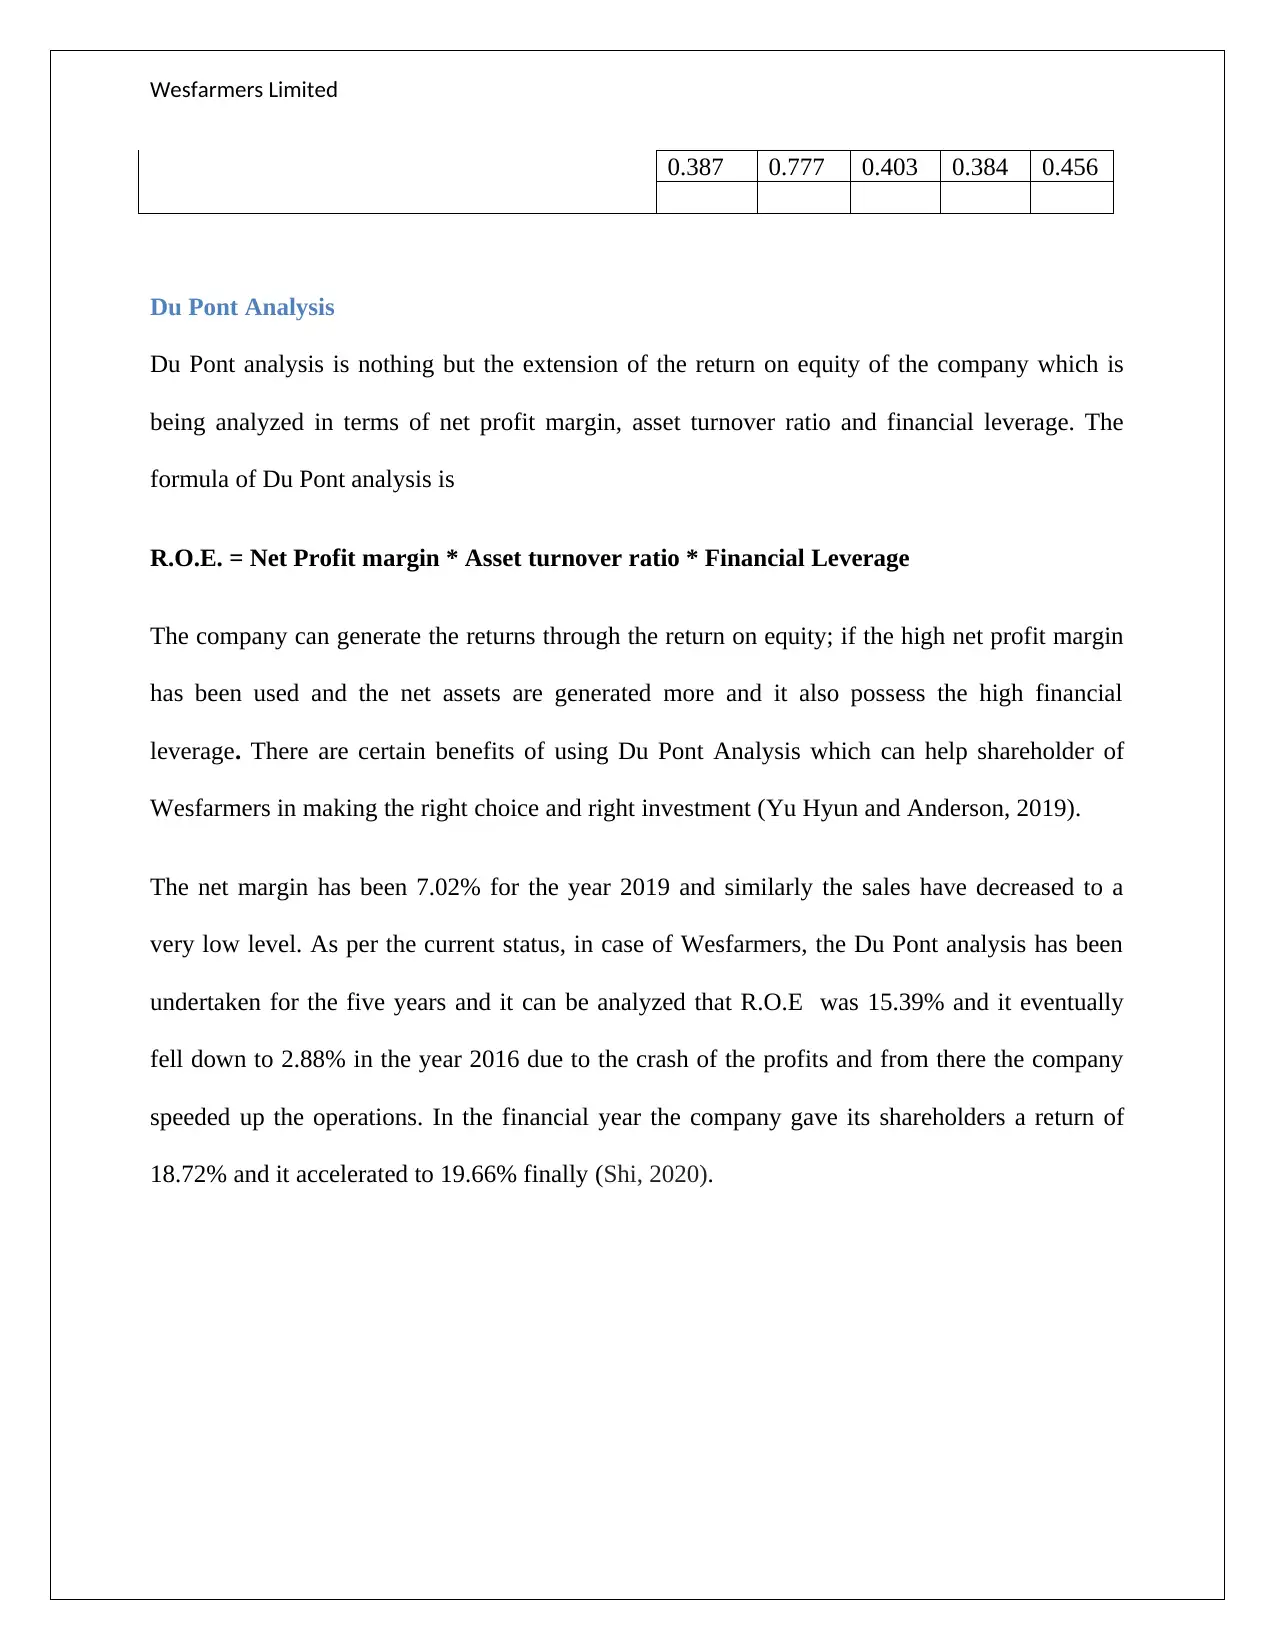
0.387 0.777 0.403 0.384 0.456
Du Pont Analysis
Du Pont analysis is nothing but the extension of the return on equity of the company which is
being analyzed in terms of net profit margin, asset turnover ratio and financial leverage. The
formula of Du Pont analysis is
R.O.E. = Net Profit margin * Asset turnover ratio * Financial Leverage
The company can generate the returns through the return on equity; if the high net profit margin
has been used and the net assets are generated more and it also possess the high financial
leverage. There are certain benefits of using Du Pont Analysis which can help shareholder of
Wesfarmers in making the right choice and right investment (Yu Hyun and Anderson, 2019).
The net margin has been 7.02% for the year 2019 and similarly the sales have decreased to a
very low level. As per the current status, in case of Wesfarmers, the Du Pont analysis has been
undertaken for the five years and it can be analyzed that R.O.E was 15.39% and it eventually
fell down to 2.88% in the year 2016 due to the crash of the profits and from there the company
speeded up the operations. In the financial year the company gave its shareholders a return of
18.72% and it accelerated to 19.66% finally (Shi, 2020).
Paraphrase This Document
Need a fresh take? Get an instant paraphrase of this document with our AI Paraphraser
Wesfarmers Limited
DuPont Analysis 2015 2016 2017 2018 2019
ROE Net Profit 2440 407 2760 2604 1940
Sales 39941.5 40592.5 39984.5 38524 27633
Net sales 62447 65981 64913 66883 27920
Total Assets 40402 22949 40115 36933 18333
Assets 40402 22949 40115 36933 18333
Equity 24781 22949 23941 22754 9971
6.11% 1.00% 6.90% 6.76% 7.02%
154.56% 287.51% 161.82% 181.09% 152.29%
163.04% 100.00% 167.56% 162.31% 183.86%
ROE 15.39% 2.88% 18.72% 19.87% 19.66%
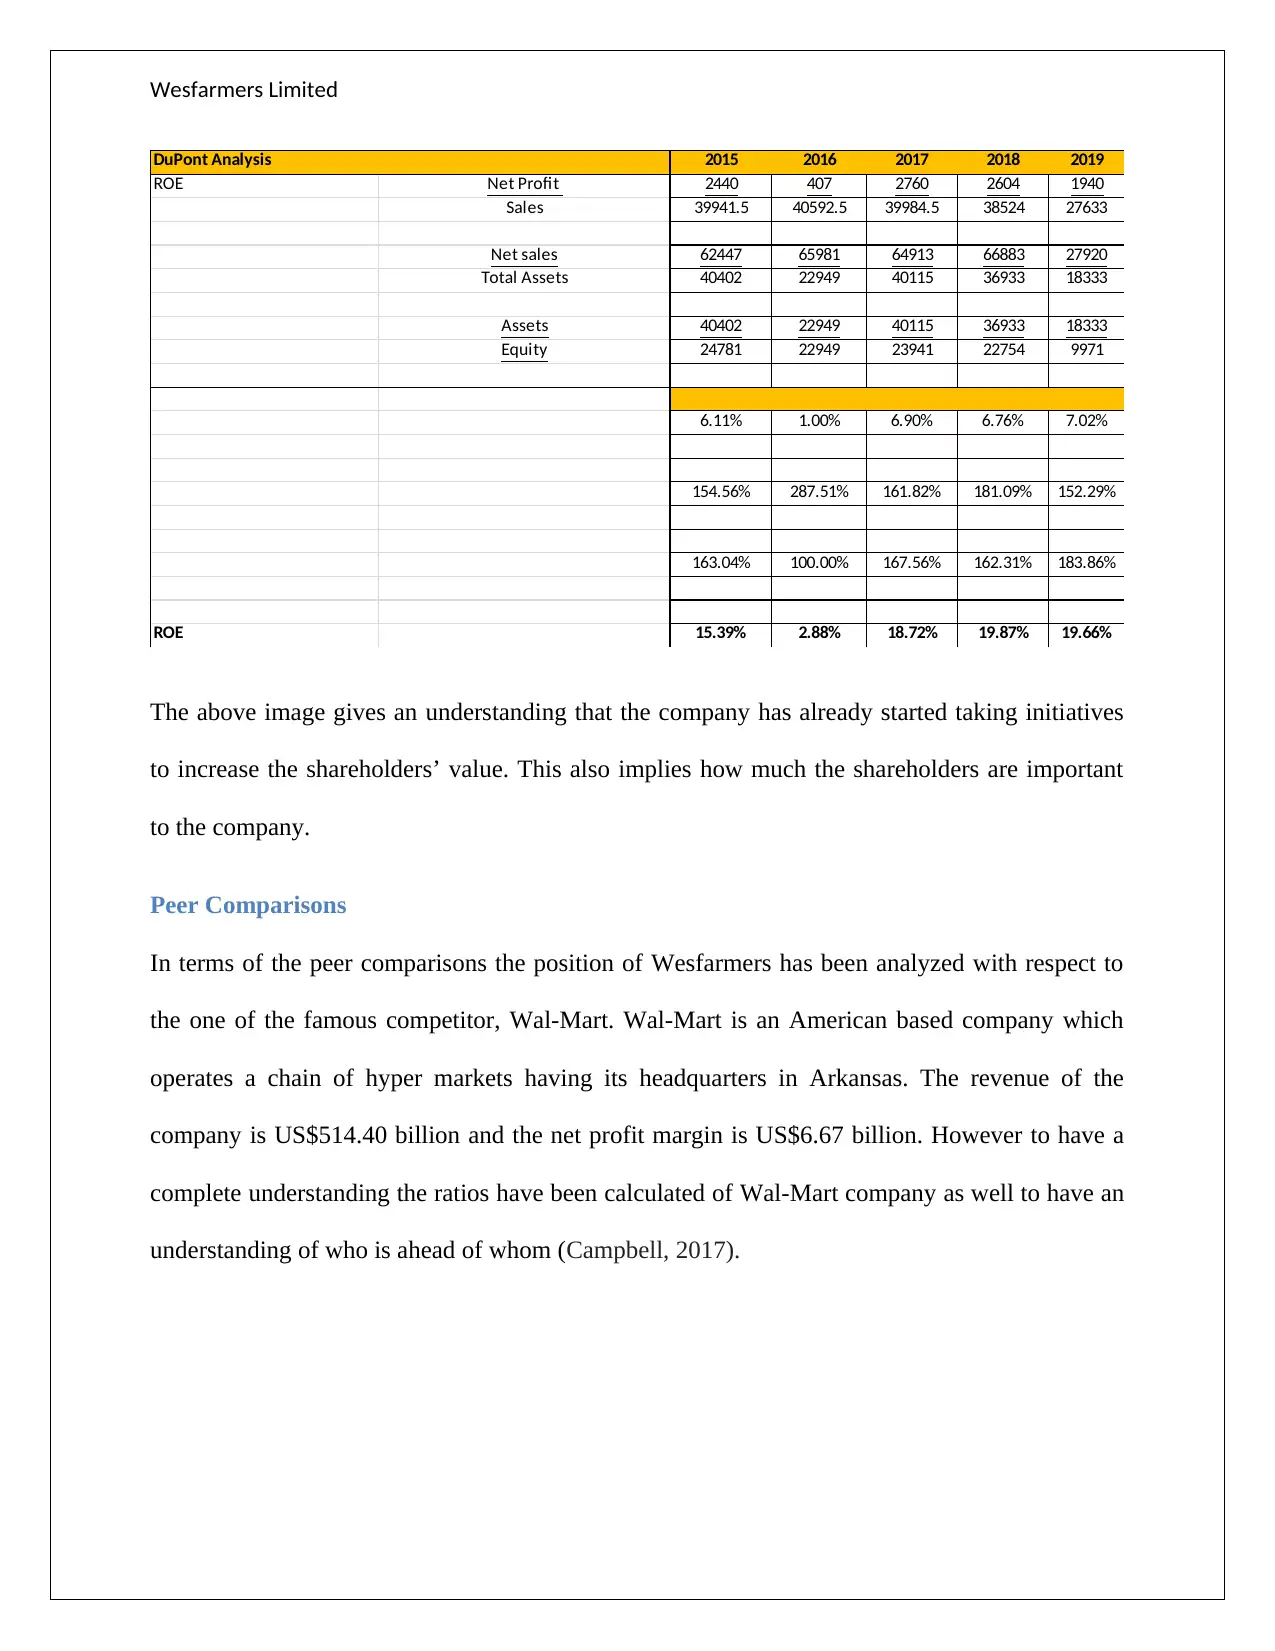
The above image gives an understanding that the company has already started taking initiatives
to increase the shareholders’ value. This also implies how much the shareholders are important
to the company.
Peer Comparisons
In terms of the peer comparisons the position of Wesfarmers has been analyzed with respect to
the one of the famous competitor, Wal-Mart. Wal-Mart is an American based company which
operates a chain of hyper markets having its headquarters in Arkansas. The revenue of the
company is US$514.40 billion and the net profit margin is US$6.67 billion. However to have a
complete understanding the ratios have been calculated of Wal-Mart company as well to have an
understanding of who is ahead of whom (Campbell, 2017).
DuPont Analysis 2015 2016 2017 2018 2019
ROE Net Profit 2440 407 2760 2604 1940
Sales 39941.5 40592.5 39984.5 38524 27633
Net sales 62447 65981 64913 66883 27920
Total Assets 40402 22949 40115 36933 18333
Assets 40402 22949 40115 36933 18333
Equity 24781 22949 23941 22754 9971
6.11% 1.00% 6.90% 6.76% 7.02%
154.56% 287.51% 161.82% 181.09% 152.29%
163.04% 100.00% 167.56% 162.31% 183.86%
ROE 15.39% 2.88% 18.72% 19.87% 19.66%
The above image gives an understanding that the company has already started taking initiatives
to increase the shareholders’ value. This also implies how much the shareholders are important
to the company.
Peer Comparisons
In terms of the peer comparisons the position of Wesfarmers has been analyzed with respect to
the one of the famous competitor, Wal-Mart. Wal-Mart is an American based company which
operates a chain of hyper markets having its headquarters in Arkansas. The revenue of the
company is US$514.40 billion and the net profit margin is US$6.67 billion. However to have a
complete understanding the ratios have been calculated of Wal-Mart company as well to have an
understanding of who is ahead of whom (Campbell, 2017).
Wesfarmers Limited
2019
0.000
0.200
0.400
0.600
0.800
1.000
1.200
1.400
Current Ratio
Wesfarmers
Walmart
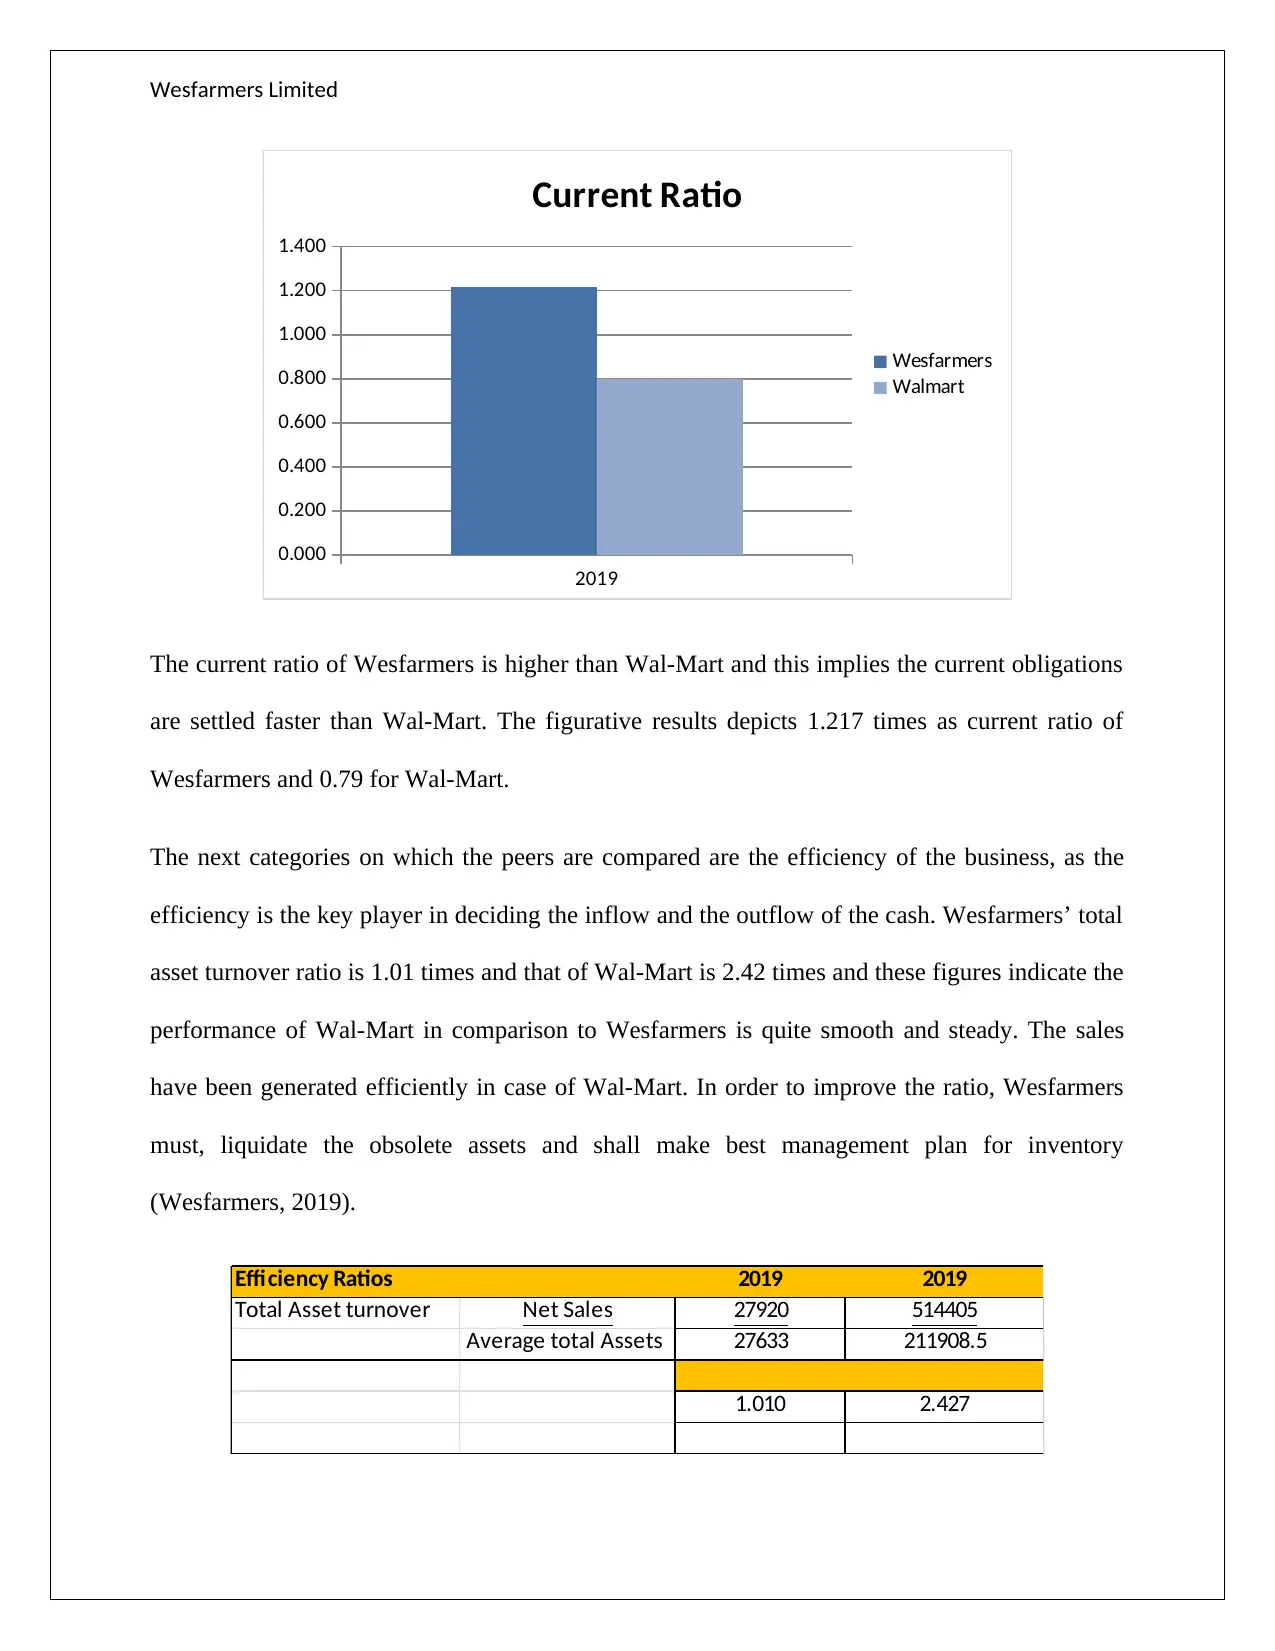
The current ratio of Wesfarmers is higher than Wal-Mart and this implies the current obligations
are settled faster than Wal-Mart. The figurative results depicts 1.217 times as current ratio of
Wesfarmers and 0.79 for Wal-Mart.
The next categories on which the peers are compared are the efficiency of the business, as the
efficiency is the key player in deciding the inflow and the outflow of the cash. Wesfarmers’ total
asset turnover ratio is 1.01 times and that of Wal-Mart is 2.42 times and these figures indicate the
performance of Wal-Mart in comparison to Wesfarmers is quite smooth and steady. The sales
have been generated efficiently in case of Wal-Mart. In order to improve the ratio, Wesfarmers
must, liquidate the obsolete assets and shall make best management plan for inventory
(Wesfarmers, 2019).
Efficiency Ratios 2019 2019
Total Asset turnover Net Sales 27920 514405
Average total Assets 27633 211908.5
1.010 2.427
2019
0.000
0.200
0.400
0.600
0.800
1.000
1.200
1.400
Current Ratio
Wesfarmers
Walmart
The current ratio of Wesfarmers is higher than Wal-Mart and this implies the current obligations
are settled faster than Wal-Mart. The figurative results depicts 1.217 times as current ratio of
Wesfarmers and 0.79 for Wal-Mart.
The next categories on which the peers are compared are the efficiency of the business, as the
efficiency is the key player in deciding the inflow and the outflow of the cash. Wesfarmers’ total
asset turnover ratio is 1.01 times and that of Wal-Mart is 2.42 times and these figures indicate the
performance of Wal-Mart in comparison to Wesfarmers is quite smooth and steady. The sales
have been generated efficiently in case of Wal-Mart. In order to improve the ratio, Wesfarmers
must, liquidate the obsolete assets and shall make best management plan for inventory
(Wesfarmers, 2019).
Efficiency Ratios 2019 2019
Total Asset turnover Net Sales 27920 514405
Average total Assets 27633 211908.5
1.010 2.427
⊘ This is a preview!⊘
Do you want full access?
Subscribe today to unlock all pages.
Trusted by 1+ million students worldwide
Wesfarmers Limited
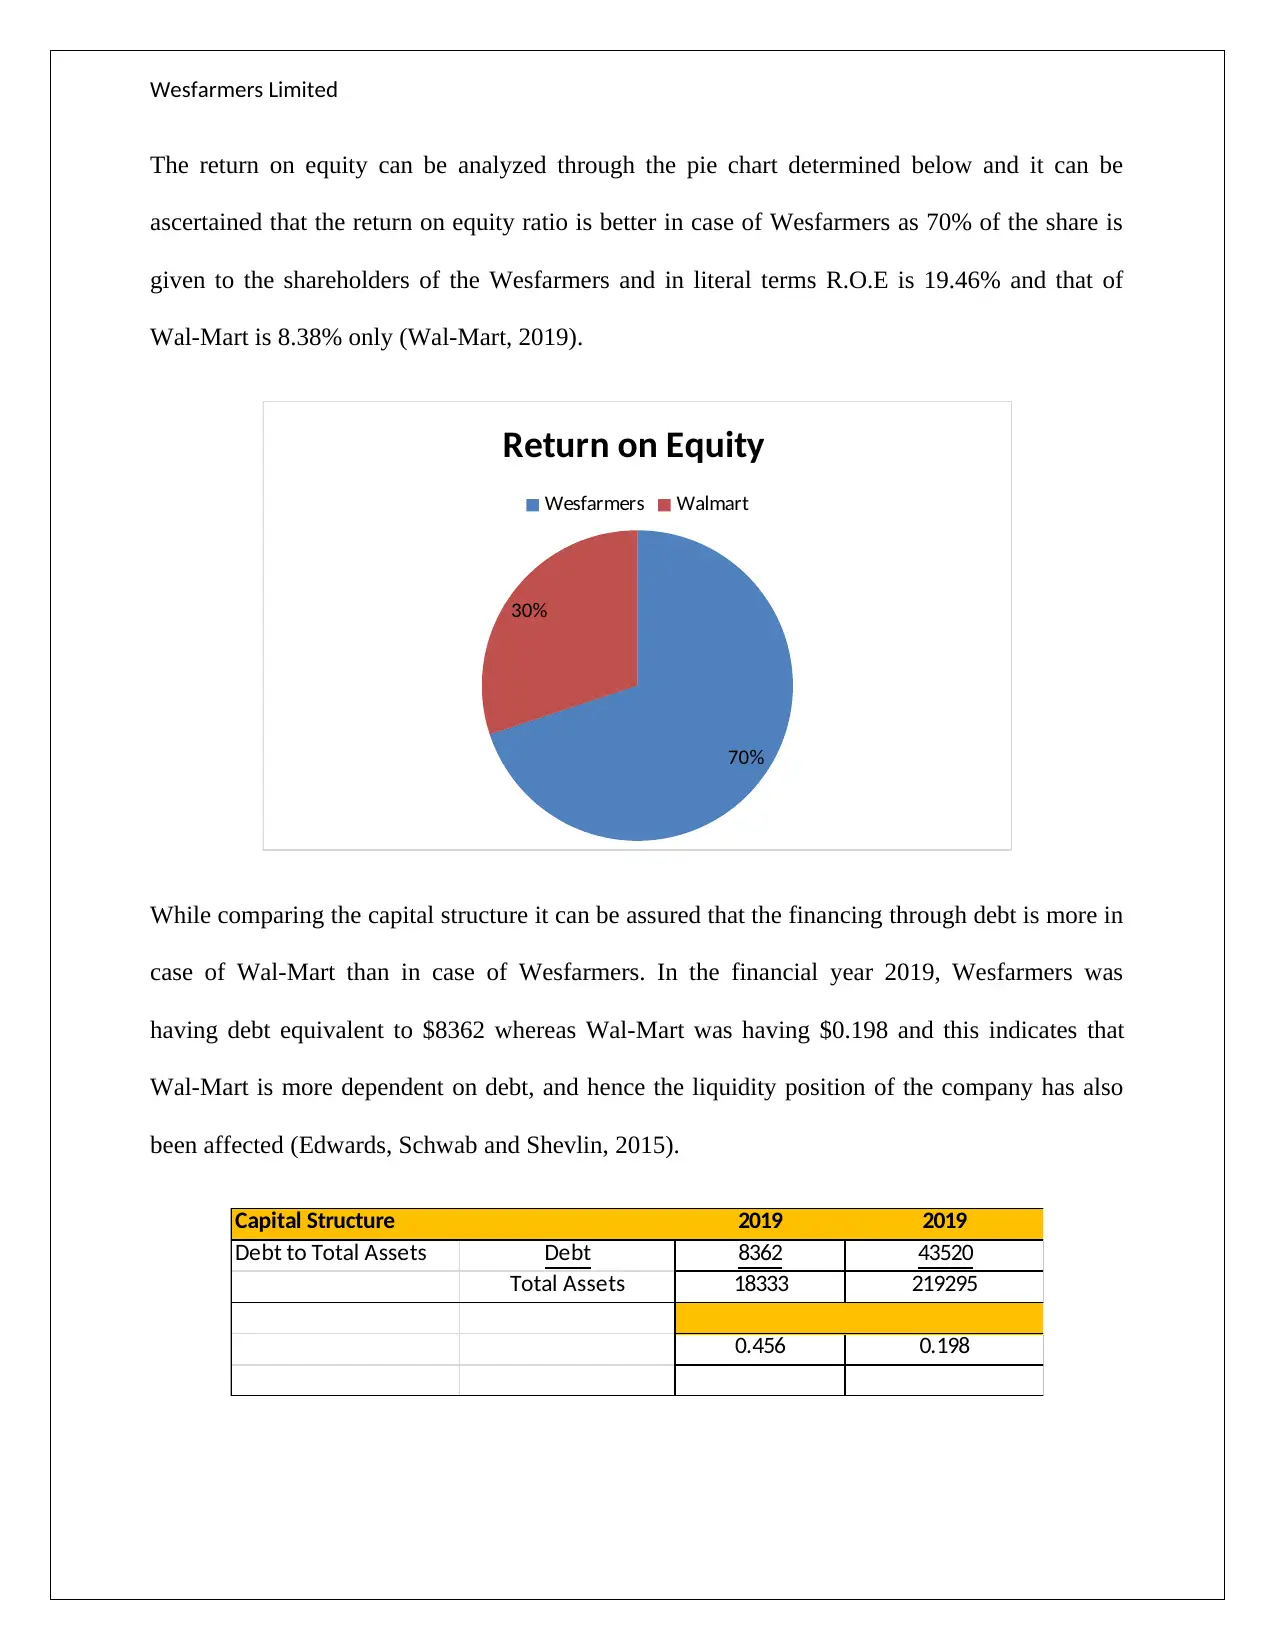
The return on equity can be analyzed through the pie chart determined below and it can be
ascertained that the return on equity ratio is better in case of Wesfarmers as 70% of the share is
given to the shareholders of the Wesfarmers and in literal terms R.O.E is 19.46% and that of
Wal-Mart is 8.38% only (Wal-Mart, 2019).
70%
30%
Return on Equity
Wesfarmers Walmart
While comparing the capital structure it can be assured that the financing through debt is more in
case of Wal-Mart than in case of Wesfarmers. In the financial year 2019, Wesfarmers was
having debt equivalent to $8362 whereas Wal-Mart was having $0.198 and this indicates that
Wal-Mart is more dependent on debt, and hence the liquidity position of the company has also
been affected (Edwards, Schwab and Shevlin, 2015).
Capital Structure 2019 2019
Debt to Total Assets Debt 8362 43520
Total Assets 18333 219295
0.456 0.198
Paraphrase This Document
Need a fresh take? Get an instant paraphrase of this document with our AI Paraphraser
Wesfarmers Limited
Market Value ratios 2019 2019
Price to Earnings Ratio Market Price 45.21 114.49
EPS 4.87 5.02
9.283 22.807
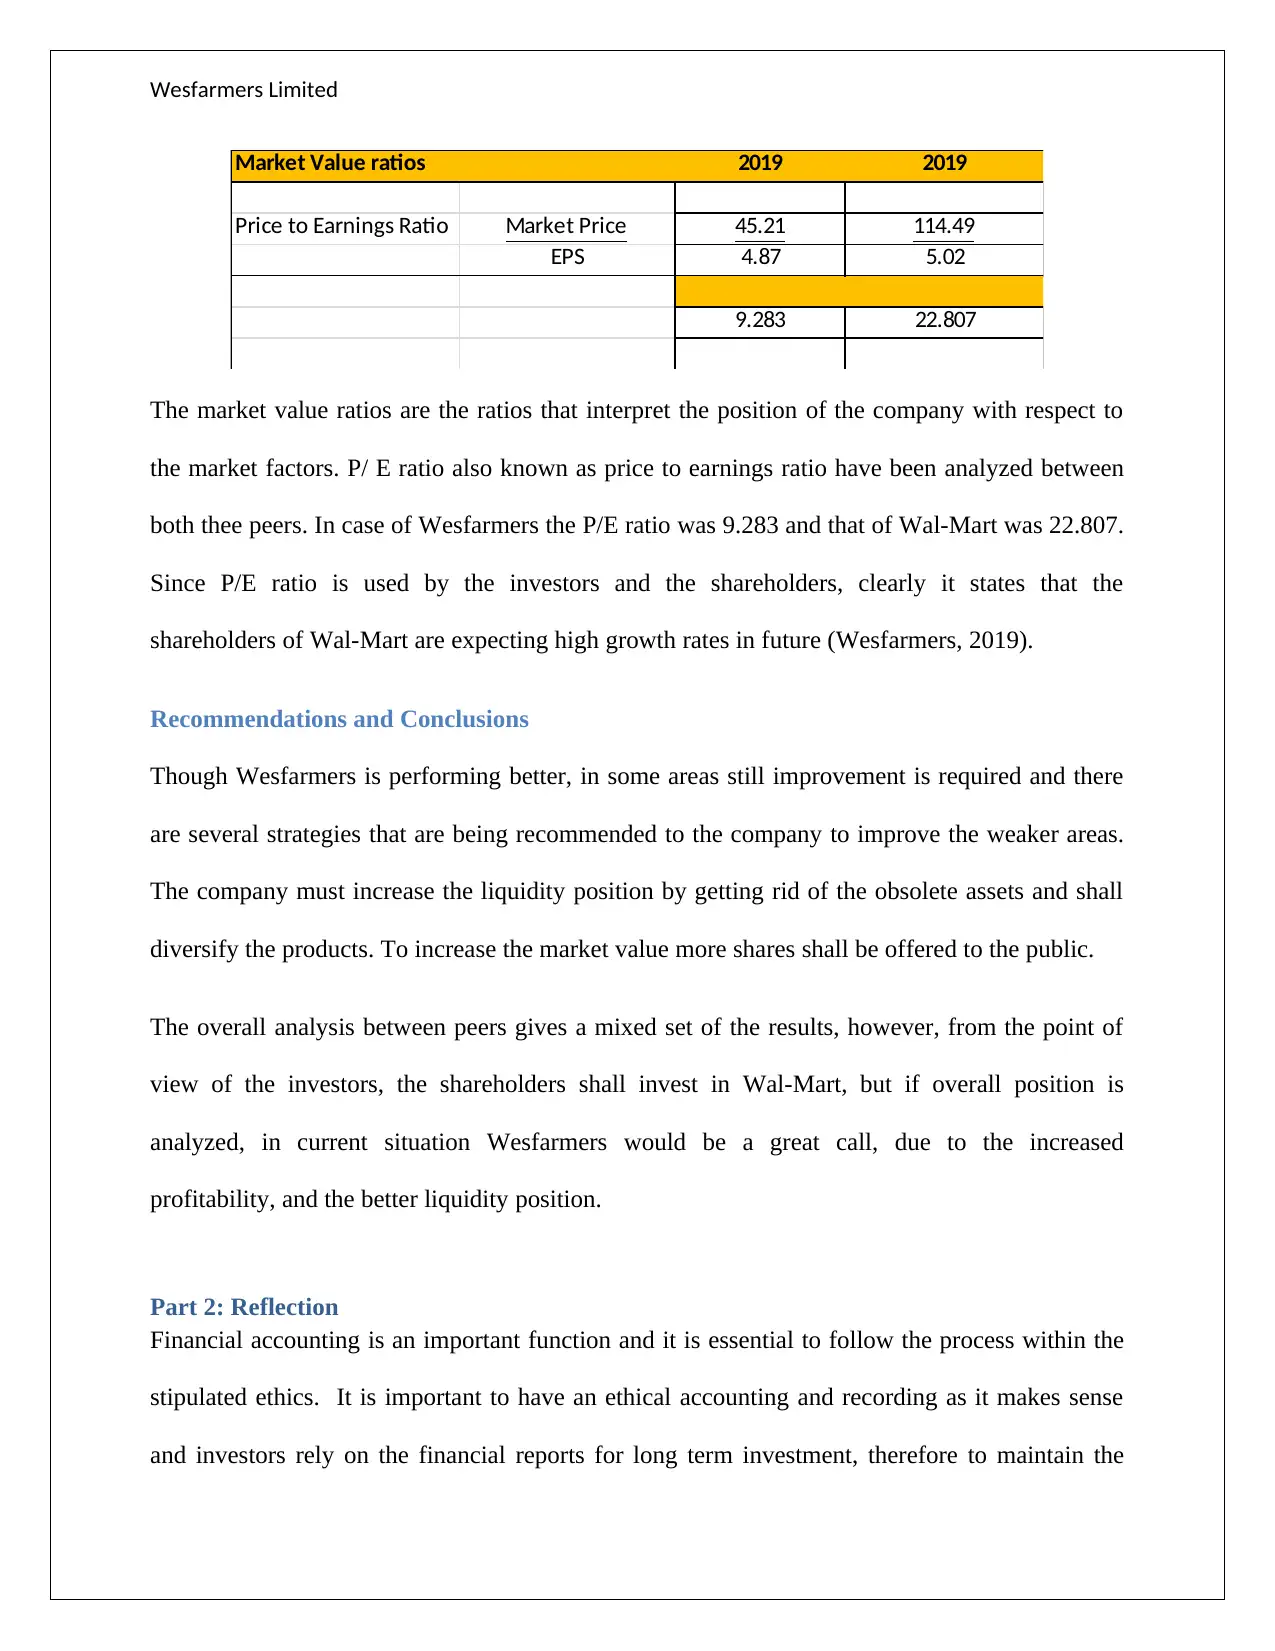
The market value ratios are the ratios that interpret the position of the company with respect to
the market factors. P/ E ratio also known as price to earnings ratio have been analyzed between
both thee peers. In case of Wesfarmers the P/E ratio was 9.283 and that of Wal-Mart was 22.807.
Since P/E ratio is used by the investors and the shareholders, clearly it states that the
shareholders of Wal-Mart are expecting high growth rates in future (Wesfarmers, 2019).
Recommendations and Conclusions
Though Wesfarmers is performing better, in some areas still improvement is required and there
are several strategies that are being recommended to the company to improve the weaker areas.
The company must increase the liquidity position by getting rid of the obsolete assets and shall
diversify the products. To increase the market value more shares shall be offered to the public.
The overall analysis between peers gives a mixed set of the results, however, from the point of
view of the investors, the shareholders shall invest in Wal-Mart, but if overall position is
analyzed, in current situation Wesfarmers would be a great call, due to the increased
profitability, and the better liquidity position.
Part 2: Reflection
Financial accounting is an important function and it is essential to follow the process within the
stipulated ethics. It is important to have an ethical accounting and recording as it makes sense
and investors rely on the financial reports for long term investment, therefore to maintain the
Market Value ratios 2019 2019
Price to Earnings Ratio Market Price 45.21 114.49
EPS 4.87 5.02
9.283 22.807
The market value ratios are the ratios that interpret the position of the company with respect to
the market factors. P/ E ratio also known as price to earnings ratio have been analyzed between
both thee peers. In case of Wesfarmers the P/E ratio was 9.283 and that of Wal-Mart was 22.807.
Since P/E ratio is used by the investors and the shareholders, clearly it states that the
shareholders of Wal-Mart are expecting high growth rates in future (Wesfarmers, 2019).
Recommendations and Conclusions
Though Wesfarmers is performing better, in some areas still improvement is required and there
are several strategies that are being recommended to the company to improve the weaker areas.
The company must increase the liquidity position by getting rid of the obsolete assets and shall
diversify the products. To increase the market value more shares shall be offered to the public.
The overall analysis between peers gives a mixed set of the results, however, from the point of
view of the investors, the shareholders shall invest in Wal-Mart, but if overall position is
analyzed, in current situation Wesfarmers would be a great call, due to the increased
profitability, and the better liquidity position.
Part 2: Reflection
Financial accounting is an important function and it is essential to follow the process within the
stipulated ethics. It is important to have an ethical accounting and recording as it makes sense
and investors rely on the financial reports for long term investment, therefore to maintain the
Wesfarmers Limited
trust factor it is necessary to portray the true image of the company. As per the article it has been
stated that 88% of the voted are against NAB bank and in my opinion this was necessary to
reformulate the pay scheme.
Financial manager are those managers that are responsible for the financial health of the
company and all the reports are being produced by the financial managers in the form of direct
investment activities, long term financial goals and in order to take other strategic business
decisions and hence in my opinion, managers shall not focus on personal goals and the
compensation is being used as the substitute is not acceptable at all. From the article, in my
opinion the collapse of the bonus shall not be done as they are getting a way to settle their
adjusted pay cheque. The non-financial metrics are as important as the financial metrics as
suggested by APRA. Further in my perception, the results at the cost of the customers are not
worthy enough and it eventually disturbs the scale and also results in increase of the risk and the
compliance issues. More than one metric shall be used to measure the share price of the company
(Gartenstein, 2019).
The priority shall be the customer outcomes rather than the remunerations of the shareholders. At
times the investors may also get ready for such approach and formulas but in my thoughts, this
policy is not going to fetch results the similar way for longer duration. Further, in order to bring
the transparency between the boards and the shareholders these steps is necessary. One of the
fact that has been defined in this article is that total value of the shareholders is a minor return
whereas the major discretion is from the side of the directors as for completion of the individual
goal, the directors are carry forwarding the 60% of the bonus amount as deferred amount,
distorting the figures of the balance sheet (The Sydney morning herald, 2019).
⊘ This is a preview!⊘
Do you want full access?
Subscribe today to unlock all pages.
Trusted by 1+ million students worldwide
1 out of 14
Related Documents


Your All-in-One AI-Powered Toolkit for Academic Success.
+13062052269
info@desklib.com
Available 24*7 on WhatsApp / Email
![[object Object]](/_next/static/media/star-bottom.7253800d.svg)
Unlock your academic potential
Copyright © 2020–2026 A2Z Services. All Rights Reserved. Developed and managed by ZUCOL.