Financial Performance Analysis: Wesfarmers vs. Woolworths (2016-2018)

Verified

Added on  2022/09/18

|9
|1270
|16
Report
AI Summary
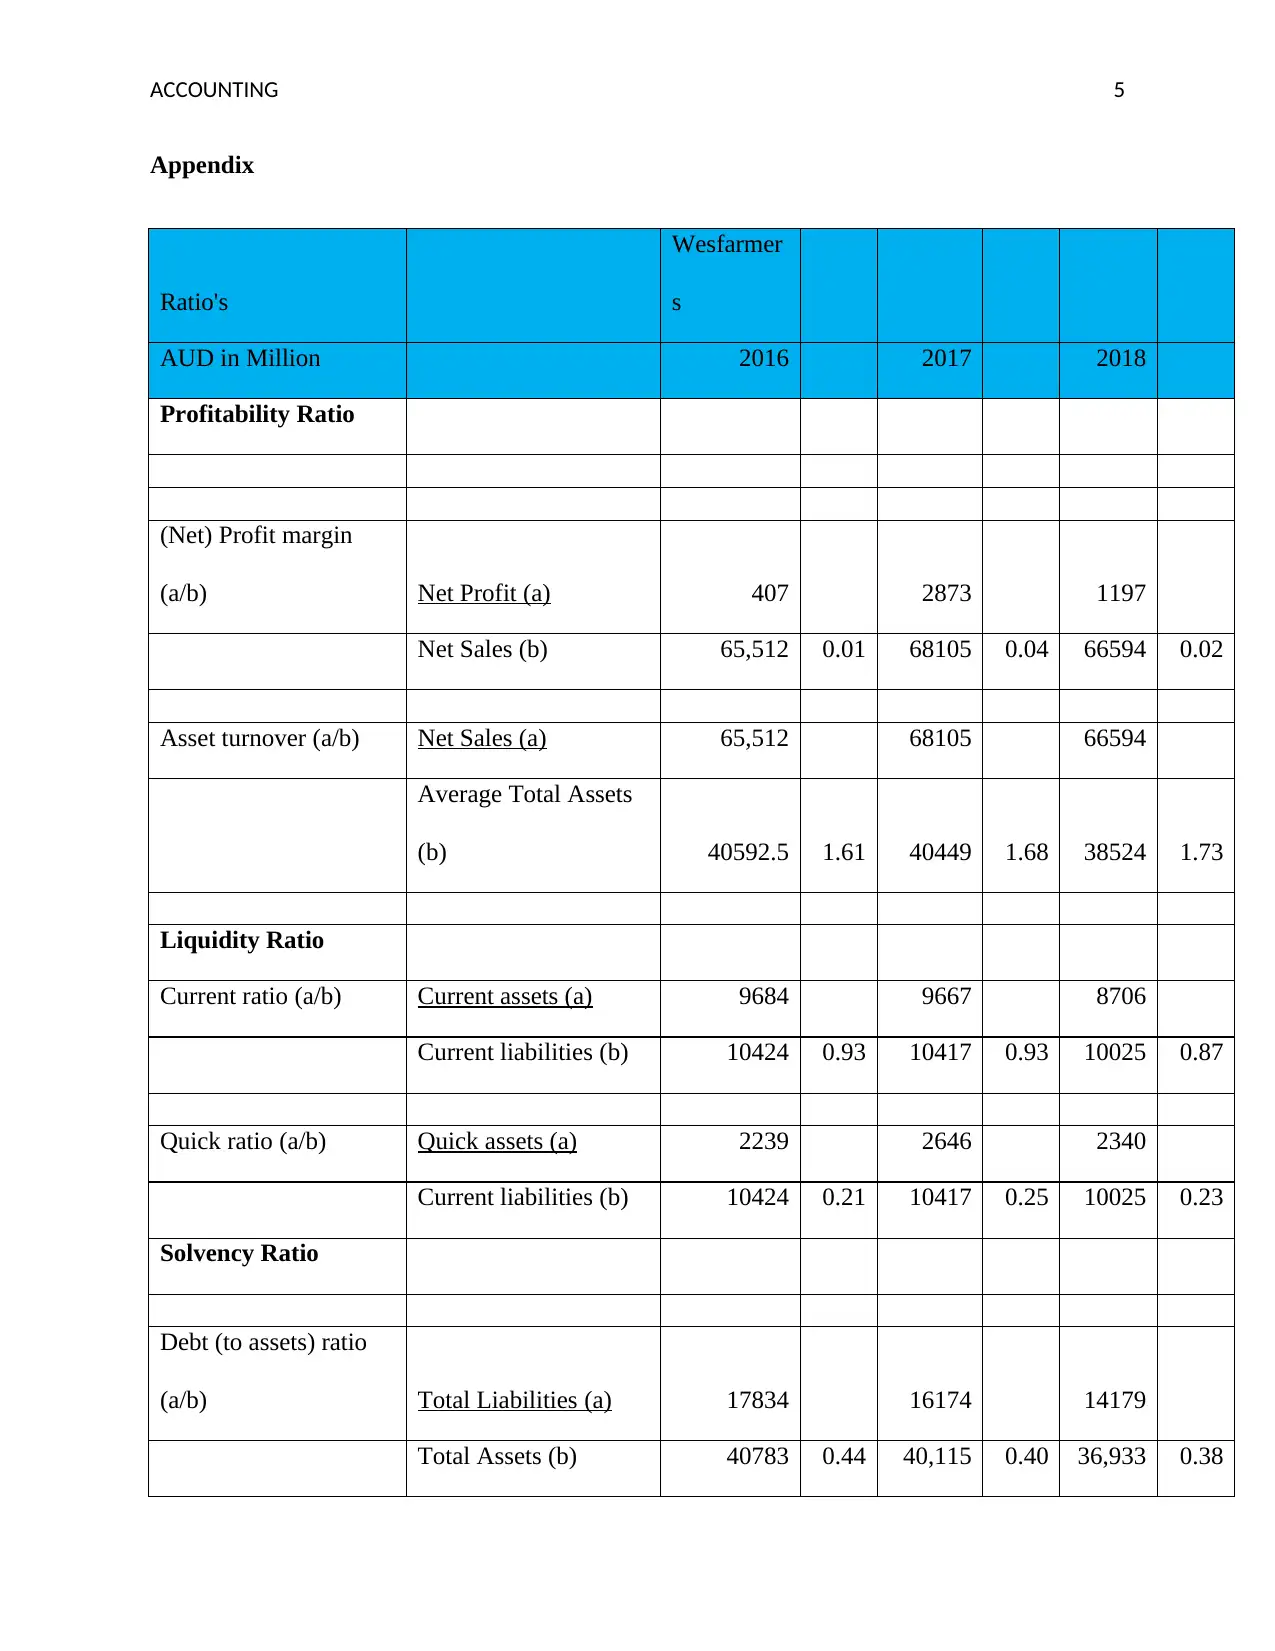
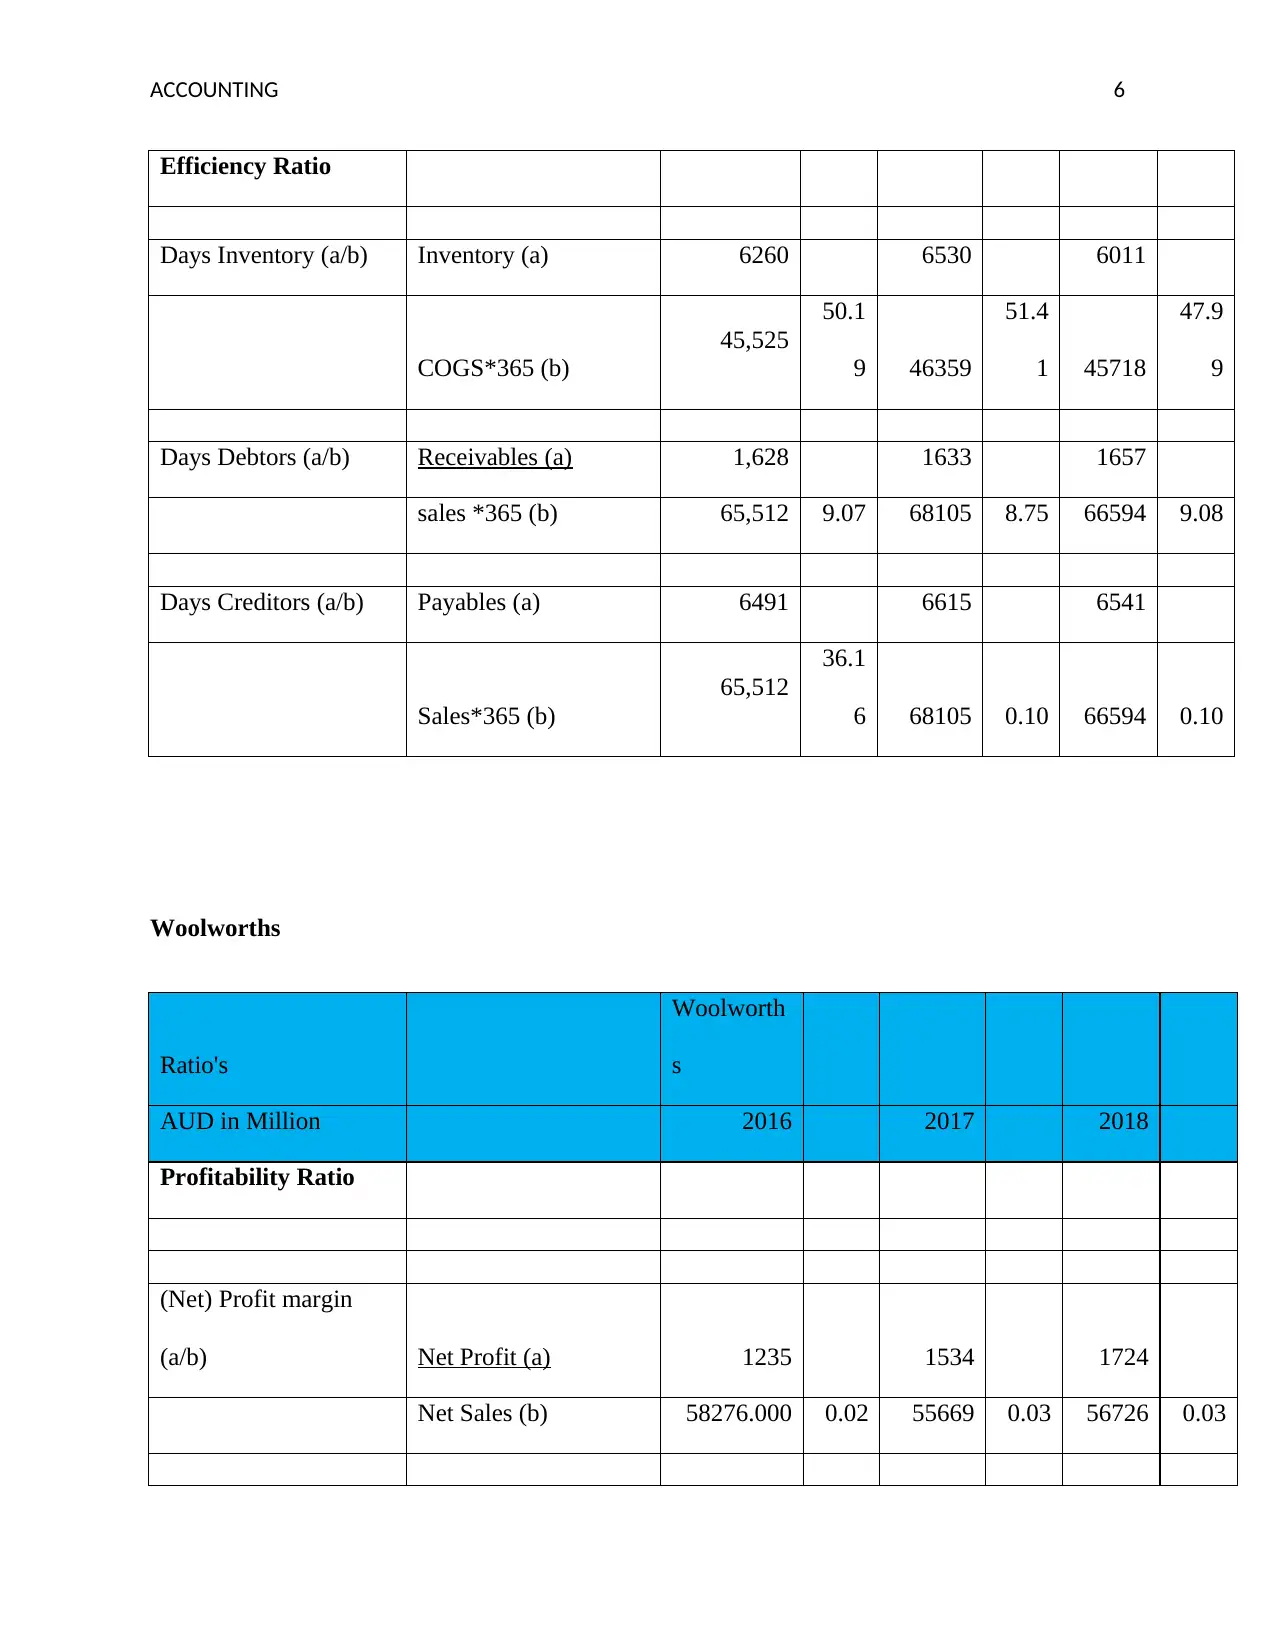
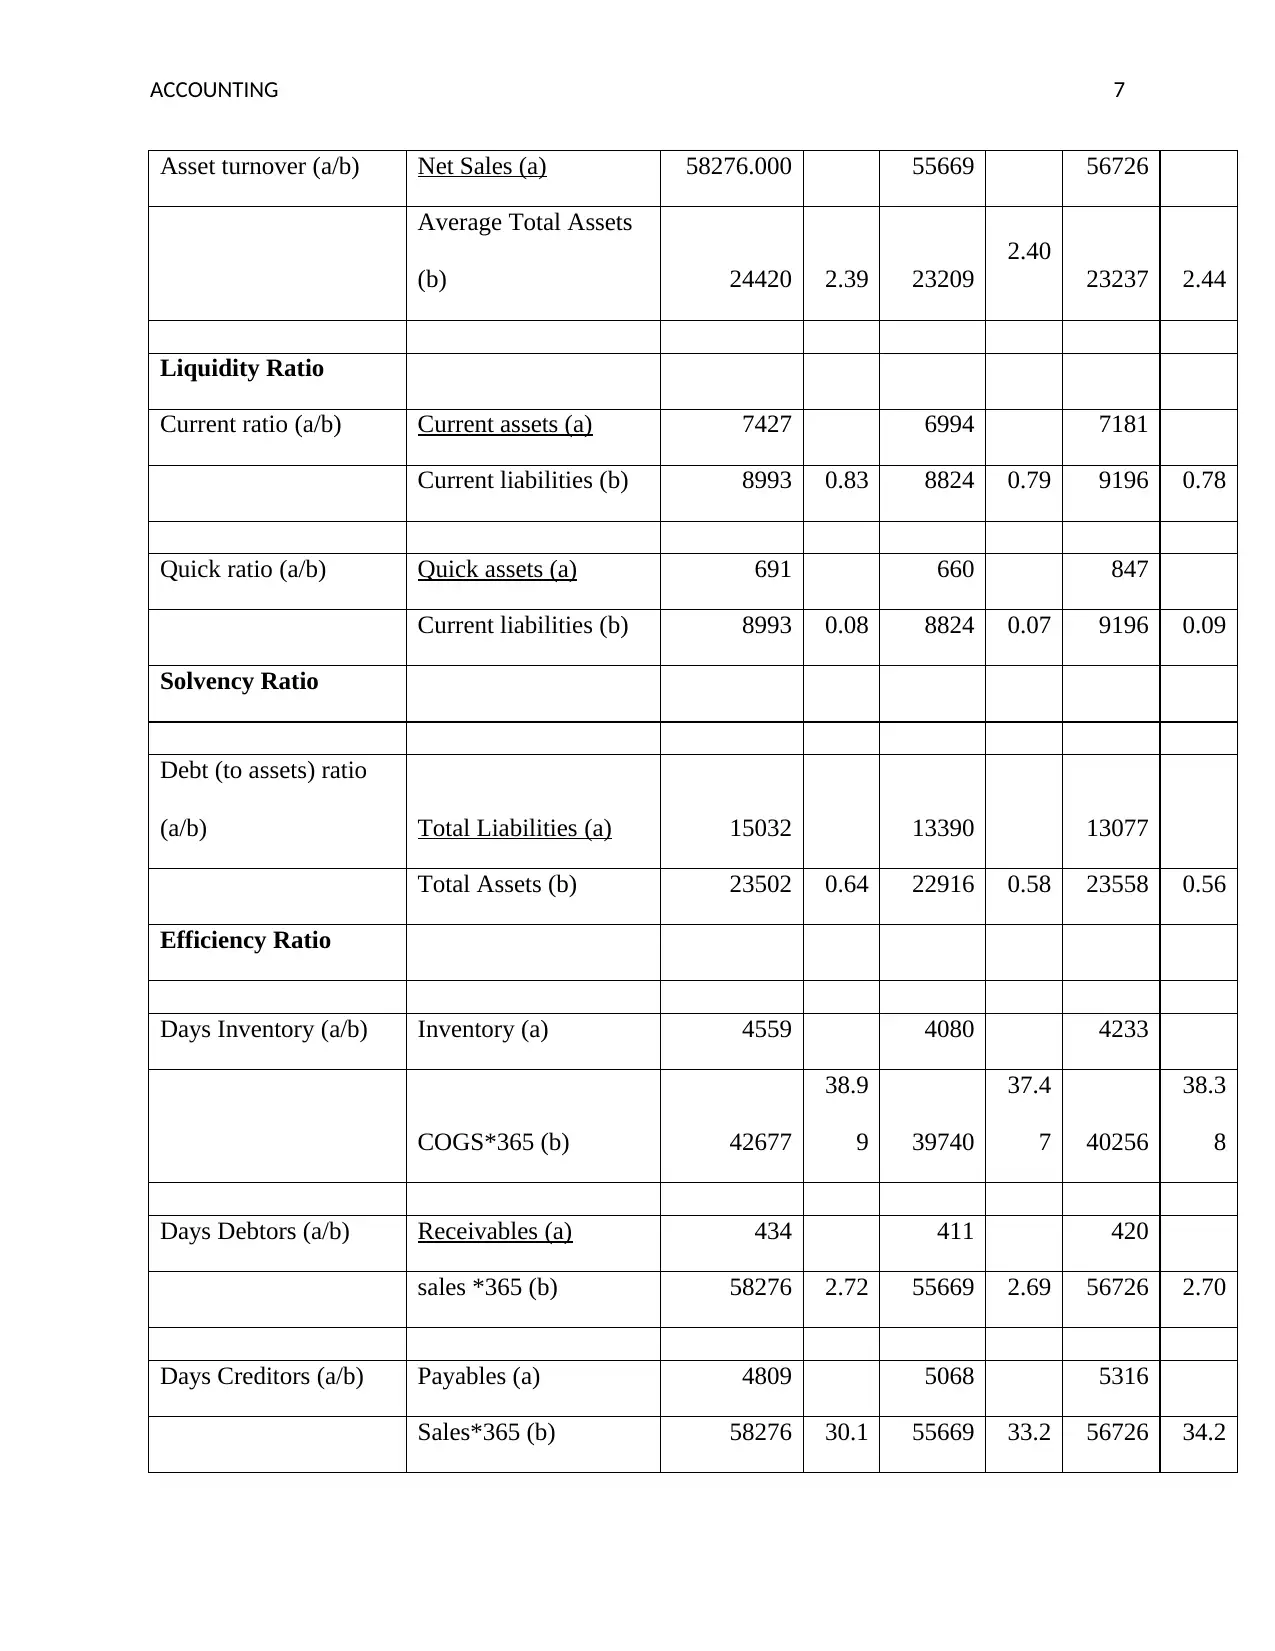
This report provides a comprehensive financial analysis of Wesfarmers and Woolworths, comparing their performance across 2016, 2017, and 2018. The analysis focuses on key financial ratios, including profit margin, asset turnover, current ratio, quick ratio, and debt ratio, to assess profitability, liquidity, and solvency. Additionally, the report calculates and evaluates the cash conversion cycle for both companies. The findings indicate that Wesfarmers demonstrates stronger financial performance compared to Woolworths, particularly in areas such as debt management and efficiency ratios. The report offers recommendations for improvement, such as focusing on debtor management and investing in current assets. The analysis utilizes data from company annual reports and Morningstar, providing a detailed comparison and insightful conclusions regarding the financial health of both corporations.
tabler-icon-diamond-filled.svg

Contribute Materials

Your contribution can guide someone’s learning journey. Share your documents today.
Document Page
Financial Analysis
tabler-icon-diamond-filled.svg

Secure Best Marks with AI Grader

Need help grading? Try our AI Grader for instant feedback on your assignments.
Document Page
ACCOUNTING 1
Introduction
The main aim of this paper is to understand the theory of ratio analysis. It helps to evaluate the
financial position of the company by evaluating the ratio’s. In this report, Wesfarmers has been
taken into consideration to evaluate the financial position. Woolworths is taken as the
competitive company to evaluate the financial performance.
Financial Analysis Ratio
Profit Margin- It is a measure of profitability. In the case of Wesfarmers, the ratio indicates that
the profit of the business is increasing in the year 2017 from the last year 2016 that is 407. But in
the year 2018, the profit ratio of the business is decreasing by 0.02 from the year 2017
(Wesfarmers, 2018). The sales amount is decreasing from the last year due to which the profit of
the company is reducing.
Asset Turnover- Asset Turnover is an efficiency ratio that evaluates the capacity of the business
to generate sales from the assets. It has been seen that the asset turnover of the business is
increasing in every coming year. The company is increasing with the ratio 1.61, 1.68, and 1.73 in
the year 2016, 2017, and 2018 respectively (Morning Star, 2018a).
Current Ratio- Current Ratio of the corporation is the capability to pay its short-long term
obligations. Current ratio of Wesfarmers is decreasing with the ratio in the year 2018 which
reflects that the firm capacity to pay its short term liabilities. But in the case of Woolworths, the
liquidity ratio of the corporation is decreasing with the ratio’s 0.83, 0.79 and 0.78 in the year
2016, 2017 and 2018 respectively.
Document Page
ACCOUNTING 2
Quick Ratio- Quick Ratio refers the company’s capacity to pay the short term obligations. As
per the evaluation of Wesfarmers, the capability of the business is fluctuating to pay its short
term duties as same as Woolworths (Morning Star, 2018b).
Debt Ratio- Debt Ratio measures to pay all liabilities by using the assets. Debt ratio of the
Wesfarmers is decreasing which indicates the performance is improving as the liability is
reducing.
Days Inventory- Days Inventory evaluates the average number of days the organizations holds
its inventory before selling it. Inventory ratio of Wesfarmers is increasing in every year as
compare to Woolworths (Woolworths, 2018).
Days Debtors- Days Debtors ratio shows the average number of days that the firm collects from
its customers. It is observed that Wesfarmers takes more time to collect the money from
customer to Woolworths.
Days Creditors- Days Creditors defines the average number of days in which the company pay
the amount to its creditors. Wesfarmers pays the debt amount quickly as compare to its
competitors Woolworths as the number of days of days creditors decreasing in every year.
Cash Cycle Result
Cash Cycle Result methods that states the amount of time, or days taken by the company to turn
its resources inputs into cash. The formula of evaluating the cash cycle result= DIO+DSO-DPO
(CFI, 2018).
As per the evaluation, Wesfarmers takes more time to turn its resources into cash as compare to
Woolworths. In the year 2017, Wesfarmers takes more time as compare to 2016 and 2018. In the
Document Page
ACCOUNTING 3
year 2017, it can be said that the company has to focus on cash inflow but in the year 2018, that
the time taken by the company as 6.56 is reduces which is beneficial for the company. The
number of days of Woolworths is in negative which indicates that the company does not provide
the resources on credit due to which it earns more revenue.
Recommendation
ï‚· It is recommending that the company has to focus on the procedures or debtors so that it
can collect the amount from its debtors in short term.
ï‚· It is also recommended that the company has to invest in current assets instead of fixed
assets to improve liquidity.
Conclusion
At the end, it is concluded that the financial position of Wesfarmers is stronger as compare to
Woolworths. The financial ratio has been evaluated in this report to assess the financial
performance of the company.
tabler-icon-diamond-filled.svg

Secure Best Marks with AI Grader

Need help grading? Try our AI Grader for instant feedback on your assignments.
Document Page
ACCOUNTING 4
References
CFI. (2018). Cash Conversion Cycle. Retrieved From:
https://corporatefinanceinstitute.com/resources/knowledge/accounting/cash-conversion-cycle/
Morning Star. (2018a). Wesfarmers Ltd. Retrieved From: financials.morningstar.com/balance-
sheet/bs.html?t=WOW&region=aus&culture=en-US
Morning Star. (2018b). Woolworths Group Ltd. Retrieved
From:http://financials.morningstar.com/balance-sheet/bs.html?t=WES&region=aus&culture=en-
US
Wesfarmers. (2018). Annual Report 2018. Retrieved From:
https://www.wesfarmers.com.au/docs/default-source/asx-announcements/2018-annual-
report.pdf?sfvrsn=0
Woolworths. (2018). Annual Report 2019. Retrieved From:
https://www.woolworthsgroup.com.au/icms_docs/195396_annual-report-2018.pdf
Document Page
ACCOUNTING 5
Appendix
Ratio's
Wesfarmer
s
AUD in Million 2016 2017 2018
Profitability Ratio
(Net) Profit margin
(a/b) Net Profit (a) 407 2873 1197
Net Sales (b) 65,512 0.01 68105 0.04 66594 0.02
Asset turnover (a/b) Net Sales (a) 65,512 68105 66594
Average Total Assets
(b) 40592.5 1.61 40449 1.68 38524 1.73
Liquidity Ratio
Current ratio (a/b) Current assets (a) 9684 9667 8706
Current liabilities (b) 10424 0.93 10417 0.93 10025 0.87
Quick ratio (a/b) Quick assets (a) 2239 2646 2340
Current liabilities (b) 10424 0.21 10417 0.25 10025 0.23
Solvency Ratio
Debt (to assets) ratio
(a/b) Total Liabilities (a) 17834 16174 14179
Total Assets (b) 40783 0.44 40,115 0.40 36,933 0.38
Document Page
ACCOUNTING 6
Efficiency Ratio
Days Inventory (a/b) Inventory (a) 6260 6530 6011
COGS*365 (b)
45,525
50.1
9 46359
51.4
1 45718
47.9
9
Days Debtors (a/b) Receivables (a) 1,628 1633 1657
sales *365 (b) 65,512 9.07 68105 8.75 66594 9.08
Days Creditors (a/b) Payables (a) 6491 6615 6541
Sales*365 (b)
65,512
36.1
6 68105 0.10 66594 0.10
Woolworths
Ratio's
Woolworth
s
AUD in Million 2016 2017 2018
Profitability Ratio
(Net) Profit margin
(a/b) Net Profit (a) 1235 1534 1724
Net Sales (b) 58276.000 0.02 55669 0.03 56726 0.03
tabler-icon-diamond-filled.svg

Paraphrase This Document

Need a fresh take? Get an instant paraphrase of this document with our AI Paraphraser
Document Page
ACCOUNTING 7
Asset turnover (a/b) Net Sales (a) 58276.000 55669 56726
Average Total Assets
(b) 24420 2.39 23209
2.40
23237 2.44
Liquidity Ratio
Current ratio (a/b) Current assets (a) 7427 6994 7181
Current liabilities (b) 8993 0.83 8824 0.79 9196 0.78
Quick ratio (a/b) Quick assets (a) 691 660 847
Current liabilities (b) 8993 0.08 8824 0.07 9196 0.09
Solvency Ratio
Debt (to assets) ratio
(a/b) Total Liabilities (a) 15032 13390 13077
Total Assets (b) 23502 0.64 22916 0.58 23558 0.56
Efficiency Ratio
Days Inventory (a/b) Inventory (a) 4559 4080 4233
COGS*365 (b) 42677
38.9
9 39740
37.4
7 40256
38.3
8
Days Debtors (a/b) Receivables (a) 434 411 420
sales *365 (b) 58276 2.72 55669 2.69 56726 2.70
Days Creditors (a/b) Payables (a) 4809 5068 5316
Sales*365 (b) 58276 30.1 55669 33.2 56726 34.2
Document Page
ACCOUNTING 8
2 3 1
chevron_up_icon
1 out of 9
circle_padding
hide_on_mobile
zoom_out_icon
logo.png

Your All-in-One AI-Powered Toolkit for Academic Success.

Available 24*7 on WhatsApp / Email

[object Object]