Accounting for Management Decisions: Financial Statement Analysis
VerifiedAdded on 2021/05/31
|18
|3150
|21
Report
AI Summary
This report presents a quantitative analysis of the financial statements of Wesfarmers Ltd and Woolworths Ltd. It begins by outlining the methods used to present cash flow statements for both companies, focusing on the direct method. The analysis examines cash flows from operating, investing, and financing activities, drawing data from the companies' financial reports. A comprehensive ratio analysis is conducted, including liquidity, solvency, profitability, and efficiency ratios. The report offers recommendations regarding short-term credit risk, cash resource adequacy, long-term survival, and cash generation from sales revenue. The findings indicate that both companies use the direct method for cash flow presentation, with Wesfarmers Ltd demonstrating a stronger position in net cash generation from operating activities, investing activities, and cash equivalents. Additionally, Wesfarmers Ltd outperforms Woolworths Ltd in profitability, efficiency, short-term liquidity, and solvency ratios.
Running head: ACCOUNTING FOR MANAGEMENT DECISIONS
Accounting for Management Decisions
Name of Student:
Name of University:
Author’s Note:
Accounting for Management Decisions
Name of Student:
Name of University:
Author’s Note:
Paraphrase This Document
Need a fresh take? Get an instant paraphrase of this document with our AI Paraphraser
1ACCOUNTING FOR MANAGEMENT DECISIONS
Executive Summary
The discussions of the report have stated about quantitative analysis of financial statement of
Wesfarmers Ltd and Woolworths Ltd. The first section has outlined the method used in depicting
the statement of cash flows for each company. The second section has considered the examining
the information in relation to cash flow from “operating activities, cash flow from investing
activities and cash flow from financing activities retrieved from the Wesfarmers Ltd and
Woolworths Ltd financial reports”. The third section of the study has showed a ratio analysis.
This analysis has computed the liquidity ratio, solvency ratio, profitability ratio and efficiency
ratio. The recommendations are specified with the company having expected better short-term
credit risk, rationale whether both the companies are having adequate cash resources, assessment
of ability to survive in the long term and identifying the company having a better ability of
generating cash from the sales revenue. The overall findings of the discourse have been able to
state that both the company uses direct method of cash flow presentation. However, Wesfarmers
Ltd is clearly in a better positioning in terms of generating “net cash from operating activities,
net cash used in investing activities and for the cash and cash equivalents” in compared to
Woolworths Ltd. In addition to this, Wesfarmers Ltd outperforms Woolworths Ltd. in terms of
“profitability, efficiency, short-term liquidity and solvency ratios”.
2ACCOUNTING FOR MANAGEMENT DECISIONS
Table of Contents
Introduction......................................................................................................................................3
Method used in presenting the statement of cash flows for Wesfarmers Ltd..................................3
Method used in presenting the statement of cash flows for Woolworths Ltd.................................6
Examining the information in relation to cash flow for Wesfarmers Ltd........................................8
Examining the information in relation to cash flow for Woolworths Ltd.......................................8
Ratio analysis of Wesfarmers Ltd and Woolworths Ltd.................................................................9
Conclusions and recommendation.................................................................................................16
References......................................................................................................................................17
⊘ This is a preview!⊘
Do you want full access?
Subscribe today to unlock all pages.
Trusted by 1+ million students worldwide
3ACCOUNTING FOR MANAGEMENT DECISIONS
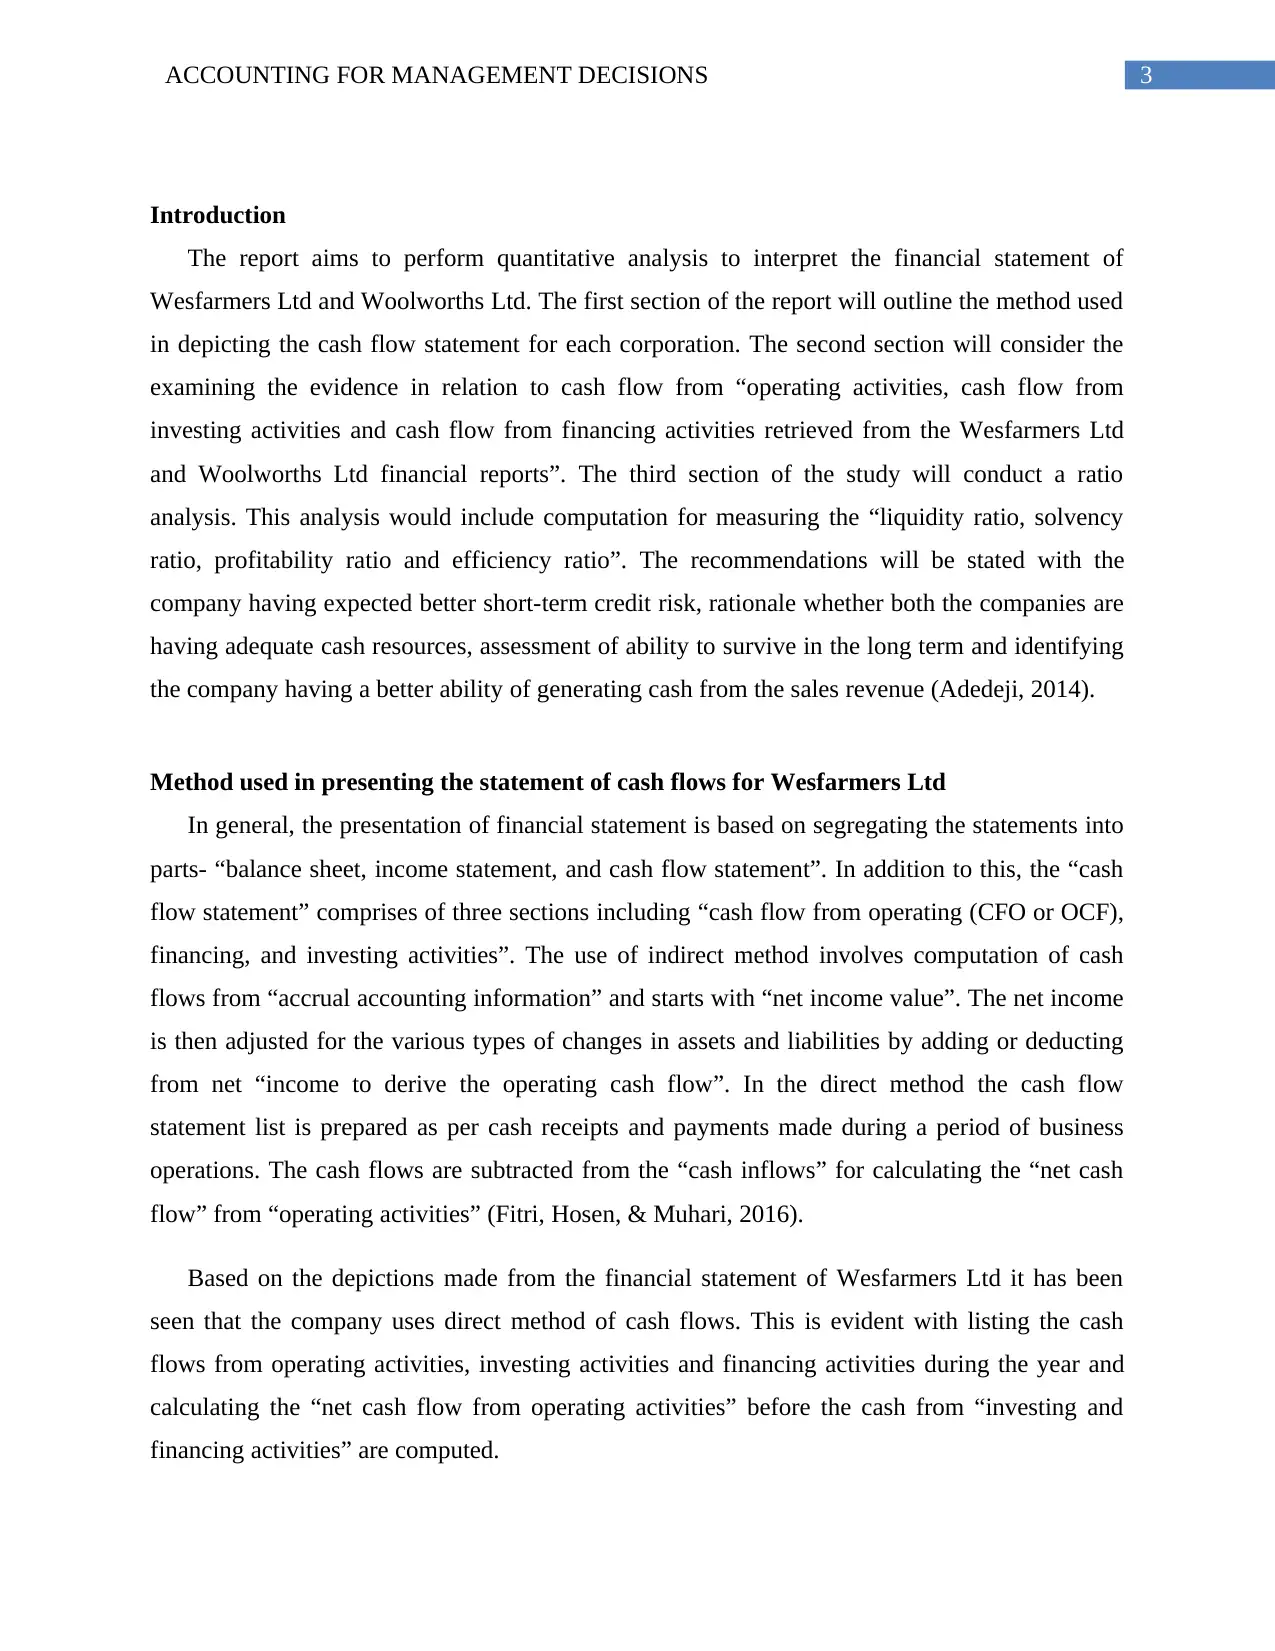
Introduction
The report aims to perform quantitative analysis to interpret the financial statement of
Wesfarmers Ltd and Woolworths Ltd. The first section of the report will outline the method used
in depicting the cash flow statement for each corporation. The second section will consider the
examining the evidence in relation to cash flow from “operating activities, cash flow from
investing activities and cash flow from financing activities retrieved from the Wesfarmers Ltd
and Woolworths Ltd financial reports”. The third section of the study will conduct a ratio
analysis. This analysis would include computation for measuring the “liquidity ratio, solvency
ratio, profitability ratio and efficiency ratio”. The recommendations will be stated with the
company having expected better short-term credit risk, rationale whether both the companies are
having adequate cash resources, assessment of ability to survive in the long term and identifying
the company having a better ability of generating cash from the sales revenue (Adedeji, 2014).
Method used in presenting the statement of cash flows for Wesfarmers Ltd
In general, the presentation of financial statement is based on segregating the statements into
parts- “balance sheet, income statement, and cash flow statement”. In addition to this, the “cash
flow statement” comprises of three sections including “cash flow from operating (CFO or OCF),
financing, and investing activities”. The use of indirect method involves computation of cash
flows from “accrual accounting information” and starts with “net income value”. The net income
is then adjusted for the various types of changes in assets and liabilities by adding or deducting
from net “income to derive the operating cash flow”. In the direct method the cash flow
statement list is prepared as per cash receipts and payments made during a period of business
operations. The cash flows are subtracted from the “cash inflows” for calculating the “net cash
flow” from “operating activities” (Fitri, Hosen, & Muhari, 2016).
Based on the depictions made from the financial statement of Wesfarmers Ltd it has been
seen that the company uses direct method of cash flows. This is evident with listing the cash
flows from operating activities, investing activities and financing activities during the year and
calculating the “net cash flow from operating activities” before the cash from “investing and
financing activities” are computed.
Paraphrase This Document
Need a fresh take? Get an instant paraphrase of this document with our AI Paraphraser
4ACCOUNTING FOR MANAGEMENT DECISIONS
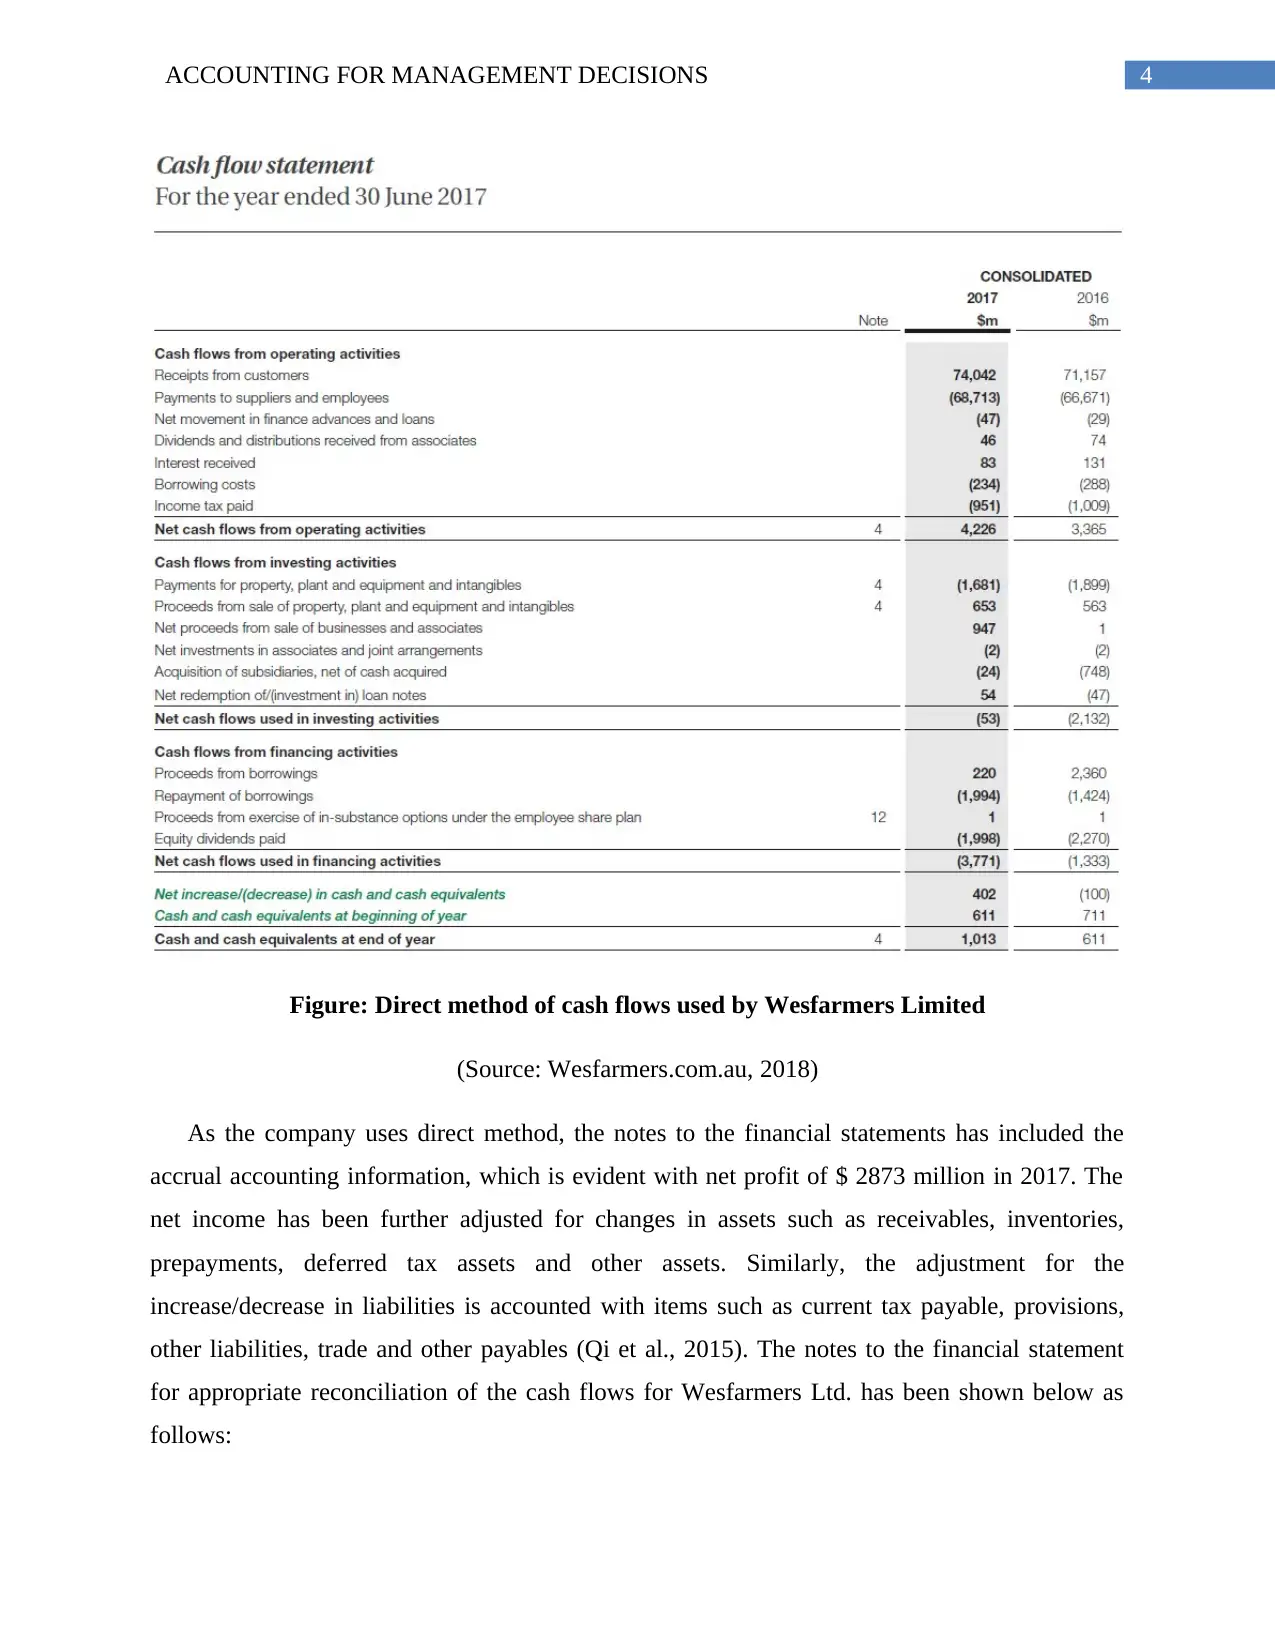
Figure: Direct method of cash flows used by Wesfarmers Limited
(Source: Wesfarmers.com.au, 2018)
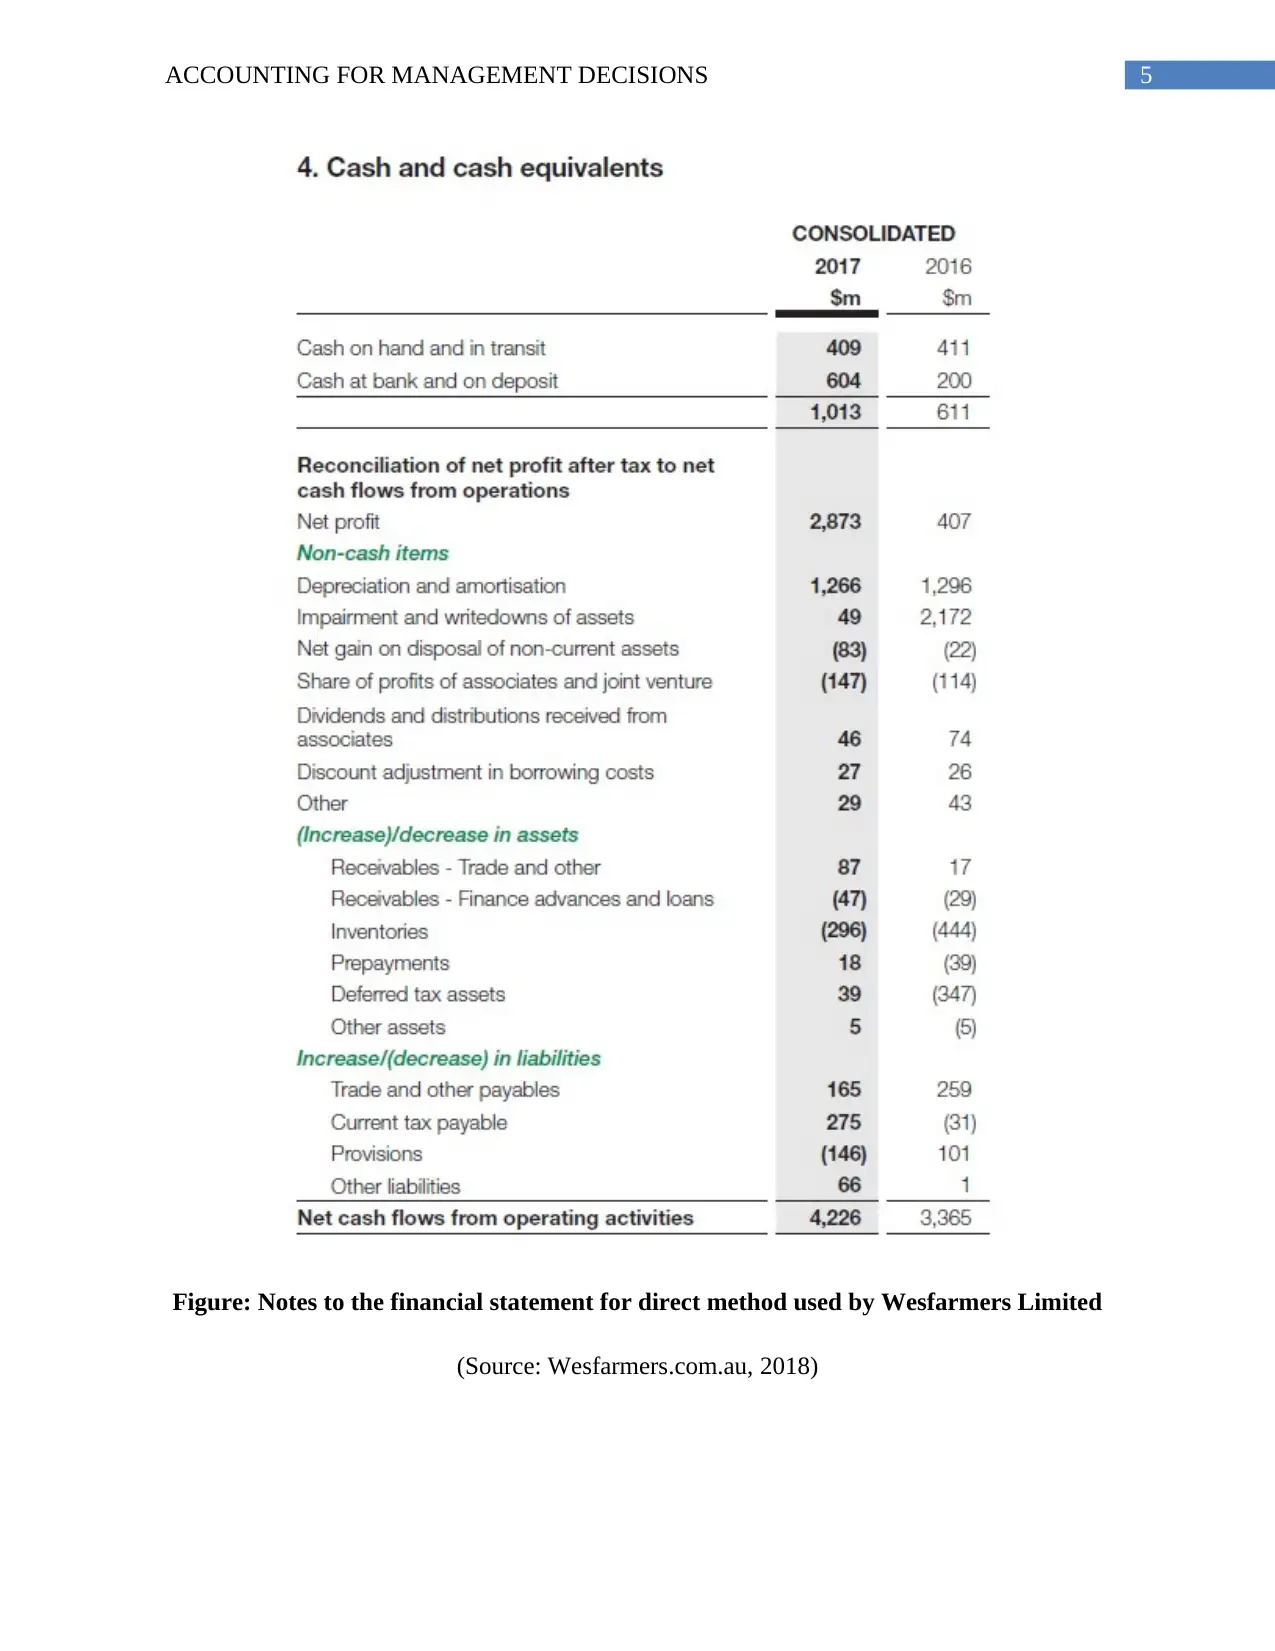
As the company uses direct method, the notes to the financial statements has included the
accrual accounting information, which is evident with net profit of $ 2873 million in 2017. The
net income has been further adjusted for changes in assets such as receivables, inventories,
prepayments, deferred tax assets and other assets. Similarly, the adjustment for the
increase/decrease in liabilities is accounted with items such as current tax payable, provisions,
other liabilities, trade and other payables (Qi et al., 2015). The notes to the financial statement
for appropriate reconciliation of the cash flows for Wesfarmers Ltd. has been shown below as
follows:
Figure: Direct method of cash flows used by Wesfarmers Limited
(Source: Wesfarmers.com.au, 2018)
As the company uses direct method, the notes to the financial statements has included the
accrual accounting information, which is evident with net profit of $ 2873 million in 2017. The
net income has been further adjusted for changes in assets such as receivables, inventories,
prepayments, deferred tax assets and other assets. Similarly, the adjustment for the
increase/decrease in liabilities is accounted with items such as current tax payable, provisions,
other liabilities, trade and other payables (Qi et al., 2015). The notes to the financial statement
for appropriate reconciliation of the cash flows for Wesfarmers Ltd. has been shown below as
follows:
5ACCOUNTING FOR MANAGEMENT DECISIONS
Figure: Notes to the financial statement for direct method used by Wesfarmers Limited
(Source: Wesfarmers.com.au, 2018)
Figure: Notes to the financial statement for direct method used by Wesfarmers Limited
(Source: Wesfarmers.com.au, 2018)
⊘ This is a preview!⊘
Do you want full access?
Subscribe today to unlock all pages.
Trusted by 1+ million students worldwide
6ACCOUNTING FOR MANAGEMENT DECISIONS
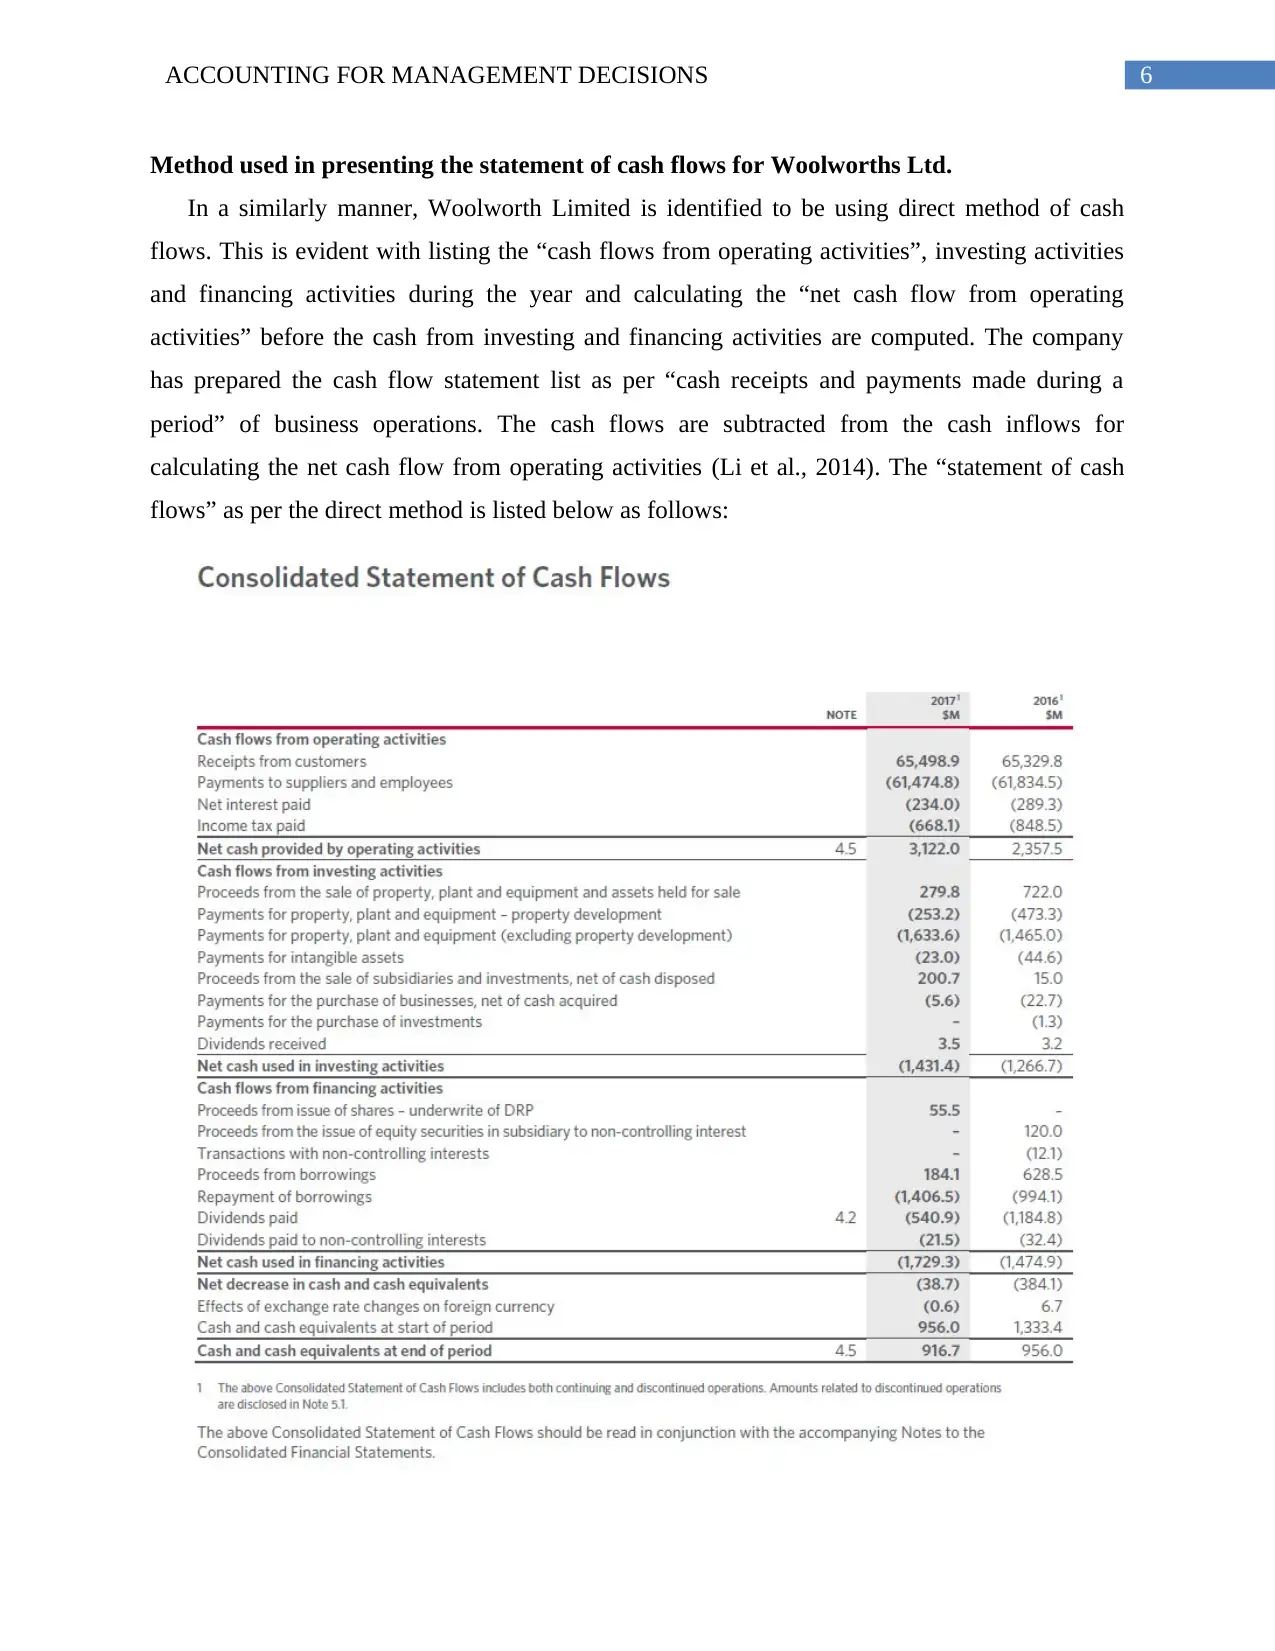
Method used in presenting the statement of cash flows for Woolworths Ltd.
In a similarly manner, Woolworth Limited is identified to be using direct method of cash
flows. This is evident with listing the “cash flows from operating activities”, investing activities
and financing activities during the year and calculating the “net cash flow from operating
activities” before the cash from investing and financing activities are computed. The company
has prepared the cash flow statement list as per “cash receipts and payments made during a
period” of business operations. The cash flows are subtracted from the cash inflows for
calculating the net cash flow from operating activities (Li et al., 2014). The “statement of cash
flows” as per the direct method is listed below as follows:
Paraphrase This Document
Need a fresh take? Get an instant paraphrase of this document with our AI Paraphraser
7ACCOUNTING FOR MANAGEMENT DECISIONS
Figure: Direct method of cash flows used by Woolworths Limited
(Source: Woolworthsgroup.com.au, 2018)
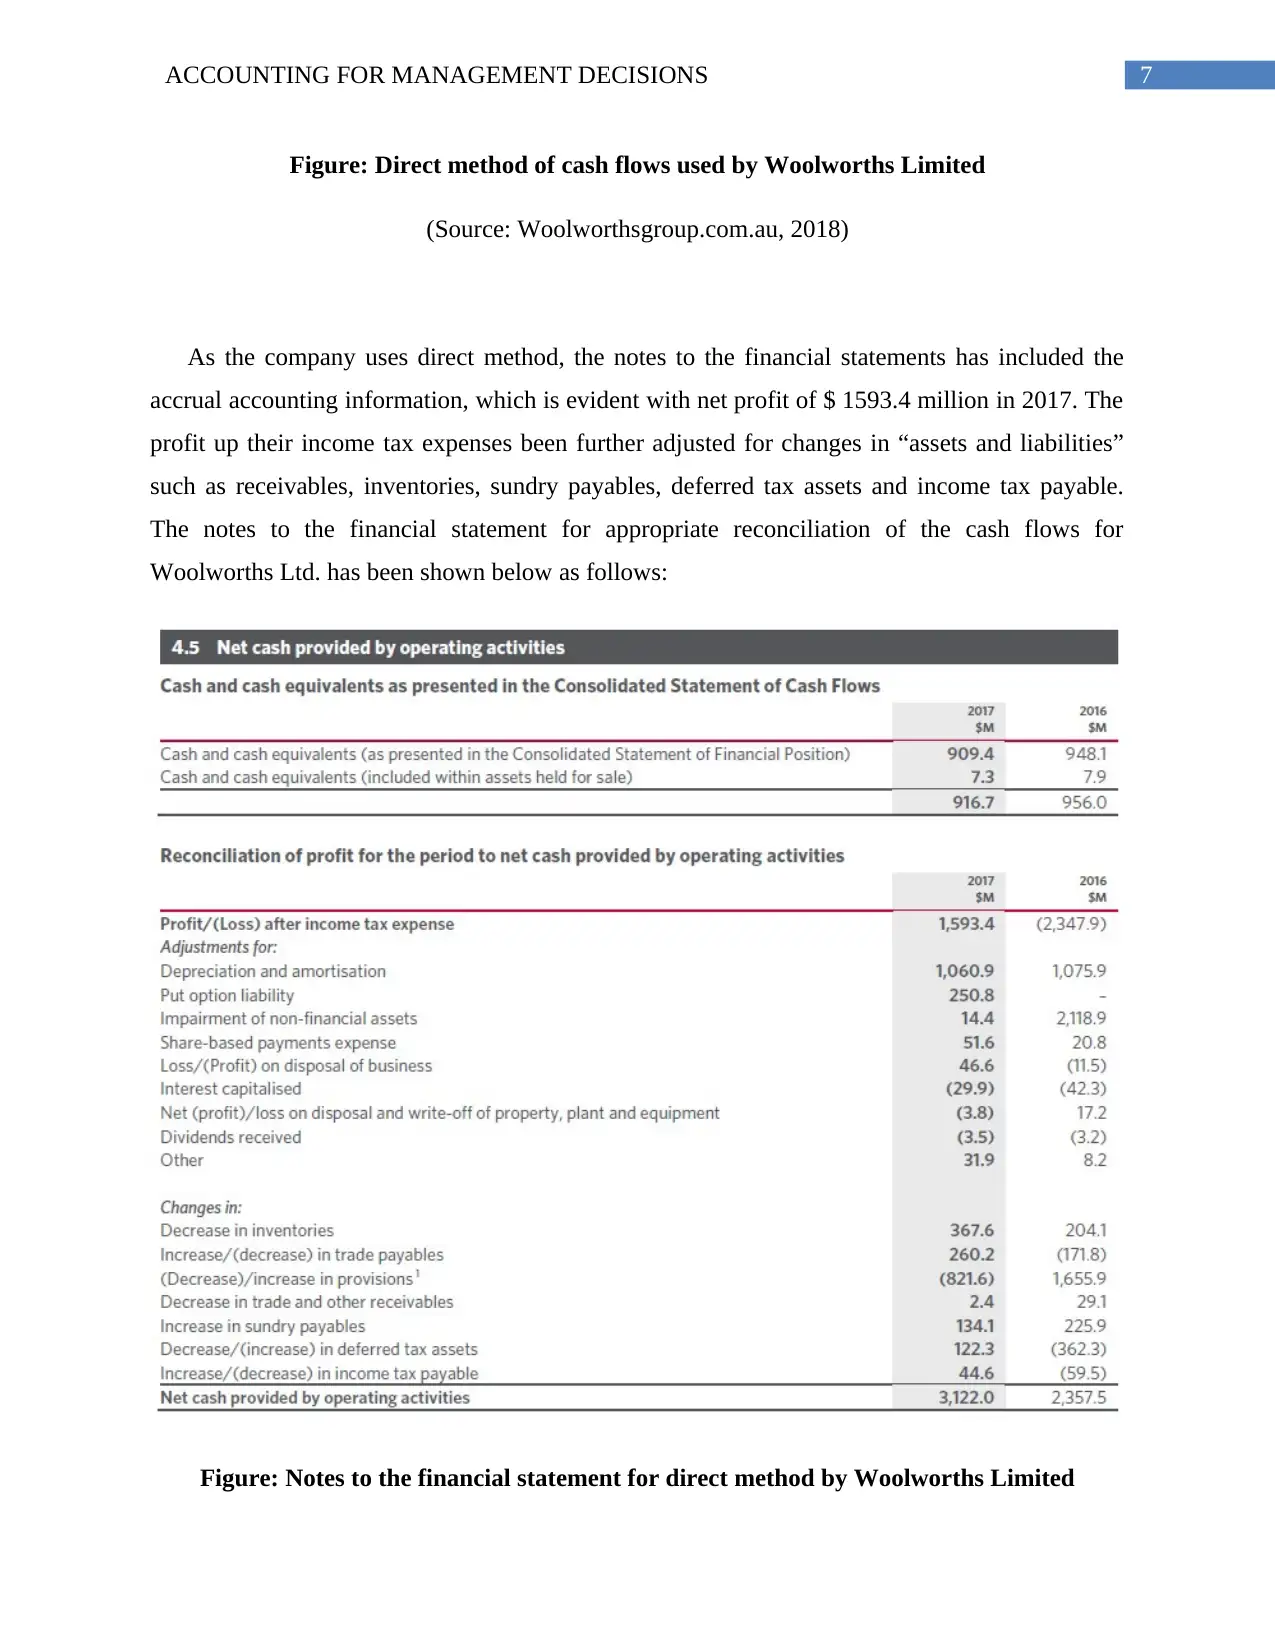
As the company uses direct method, the notes to the financial statements has included the
accrual accounting information, which is evident with net profit of $ 1593.4 million in 2017. The
profit up their income tax expenses been further adjusted for changes in “assets and liabilities”
such as receivables, inventories, sundry payables, deferred tax assets and income tax payable.
The notes to the financial statement for appropriate reconciliation of the cash flows for
Woolworths Ltd. has been shown below as follows:
Figure: Notes to the financial statement for direct method by Woolworths Limited
Figure: Direct method of cash flows used by Woolworths Limited
(Source: Woolworthsgroup.com.au, 2018)
As the company uses direct method, the notes to the financial statements has included the
accrual accounting information, which is evident with net profit of $ 1593.4 million in 2017. The
profit up their income tax expenses been further adjusted for changes in “assets and liabilities”
such as receivables, inventories, sundry payables, deferred tax assets and income tax payable.
The notes to the financial statement for appropriate reconciliation of the cash flows for
Woolworths Ltd. has been shown below as follows:
Figure: Notes to the financial statement for direct method by Woolworths Limited
8ACCOUNTING FOR MANAGEMENT DECISIONS
(Source: Woolworthsgroup.com.au, 2018)
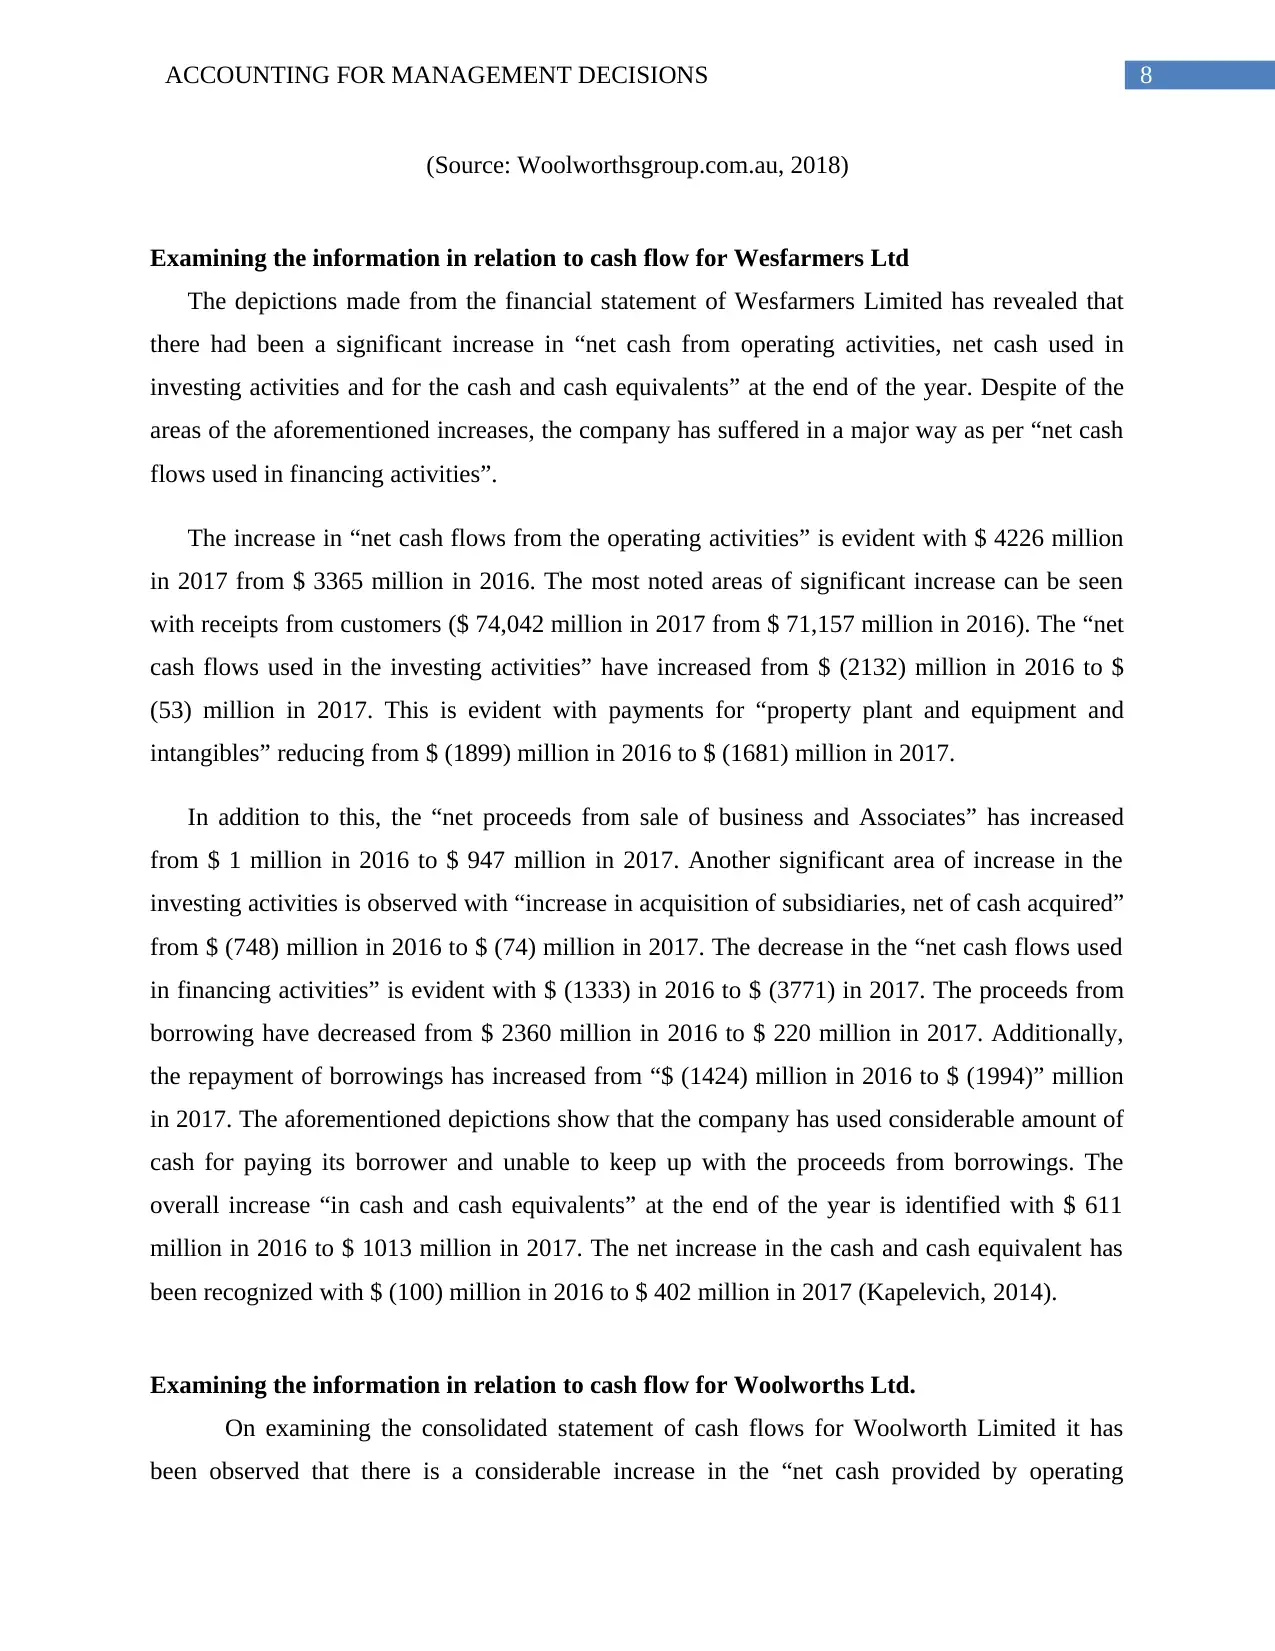
Examining the information in relation to cash flow for Wesfarmers Ltd
The depictions made from the financial statement of Wesfarmers Limited has revealed that
there had been a significant increase in “net cash from operating activities, net cash used in
investing activities and for the cash and cash equivalents” at the end of the year. Despite of the
areas of the aforementioned increases, the company has suffered in a major way as per “net cash
flows used in financing activities”.
The increase in “net cash flows from the operating activities” is evident with $ 4226 million
in 2017 from $ 3365 million in 2016. The most noted areas of significant increase can be seen
with receipts from customers ($ 74,042 million in 2017 from $ 71,157 million in 2016). The “net
cash flows used in the investing activities” have increased from $ (2132) million in 2016 to $
(53) million in 2017. This is evident with payments for “property plant and equipment and
intangibles” reducing from $ (1899) million in 2016 to $ (1681) million in 2017.
In addition to this, the “net proceeds from sale of business and Associates” has increased
from $ 1 million in 2016 to $ 947 million in 2017. Another significant area of increase in the
investing activities is observed with “increase in acquisition of subsidiaries, net of cash acquired”
from $ (748) million in 2016 to $ (74) million in 2017. The decrease in the “net cash flows used
in financing activities” is evident with $ (1333) in 2016 to $ (3771) in 2017. The proceeds from
borrowing have decreased from $ 2360 million in 2016 to $ 220 million in 2017. Additionally,
the repayment of borrowings has increased from “$ (1424) million in 2016 to $ (1994)” million
in 2017. The aforementioned depictions show that the company has used considerable amount of
cash for paying its borrower and unable to keep up with the proceeds from borrowings. The
overall increase “in cash and cash equivalents” at the end of the year is identified with $ 611
million in 2016 to $ 1013 million in 2017. The net increase in the cash and cash equivalent has
been recognized with $ (100) million in 2016 to $ 402 million in 2017 (Kapelevich, 2014).
Examining the information in relation to cash flow for Woolworths Ltd.
On examining the consolidated statement of cash flows for Woolworth Limited it has
been observed that there is a considerable increase in the “net cash provided by operating
(Source: Woolworthsgroup.com.au, 2018)
Examining the information in relation to cash flow for Wesfarmers Ltd
The depictions made from the financial statement of Wesfarmers Limited has revealed that
there had been a significant increase in “net cash from operating activities, net cash used in
investing activities and for the cash and cash equivalents” at the end of the year. Despite of the
areas of the aforementioned increases, the company has suffered in a major way as per “net cash
flows used in financing activities”.
The increase in “net cash flows from the operating activities” is evident with $ 4226 million
in 2017 from $ 3365 million in 2016. The most noted areas of significant increase can be seen
with receipts from customers ($ 74,042 million in 2017 from $ 71,157 million in 2016). The “net
cash flows used in the investing activities” have increased from $ (2132) million in 2016 to $
(53) million in 2017. This is evident with payments for “property plant and equipment and
intangibles” reducing from $ (1899) million in 2016 to $ (1681) million in 2017.
In addition to this, the “net proceeds from sale of business and Associates” has increased
from $ 1 million in 2016 to $ 947 million in 2017. Another significant area of increase in the
investing activities is observed with “increase in acquisition of subsidiaries, net of cash acquired”
from $ (748) million in 2016 to $ (74) million in 2017. The decrease in the “net cash flows used
in financing activities” is evident with $ (1333) in 2016 to $ (3771) in 2017. The proceeds from
borrowing have decreased from $ 2360 million in 2016 to $ 220 million in 2017. Additionally,
the repayment of borrowings has increased from “$ (1424) million in 2016 to $ (1994)” million
in 2017. The aforementioned depictions show that the company has used considerable amount of
cash for paying its borrower and unable to keep up with the proceeds from borrowings. The
overall increase “in cash and cash equivalents” at the end of the year is identified with $ 611
million in 2016 to $ 1013 million in 2017. The net increase in the cash and cash equivalent has
been recognized with $ (100) million in 2016 to $ 402 million in 2017 (Kapelevich, 2014).
Examining the information in relation to cash flow for Woolworths Ltd.
On examining the consolidated statement of cash flows for Woolworth Limited it has
been observed that there is a considerable increase in the “net cash provided by operating
⊘ This is a preview!⊘
Do you want full access?
Subscribe today to unlock all pages.
Trusted by 1+ million students worldwide
9ACCOUNTING FOR MANAGEMENT DECISIONS
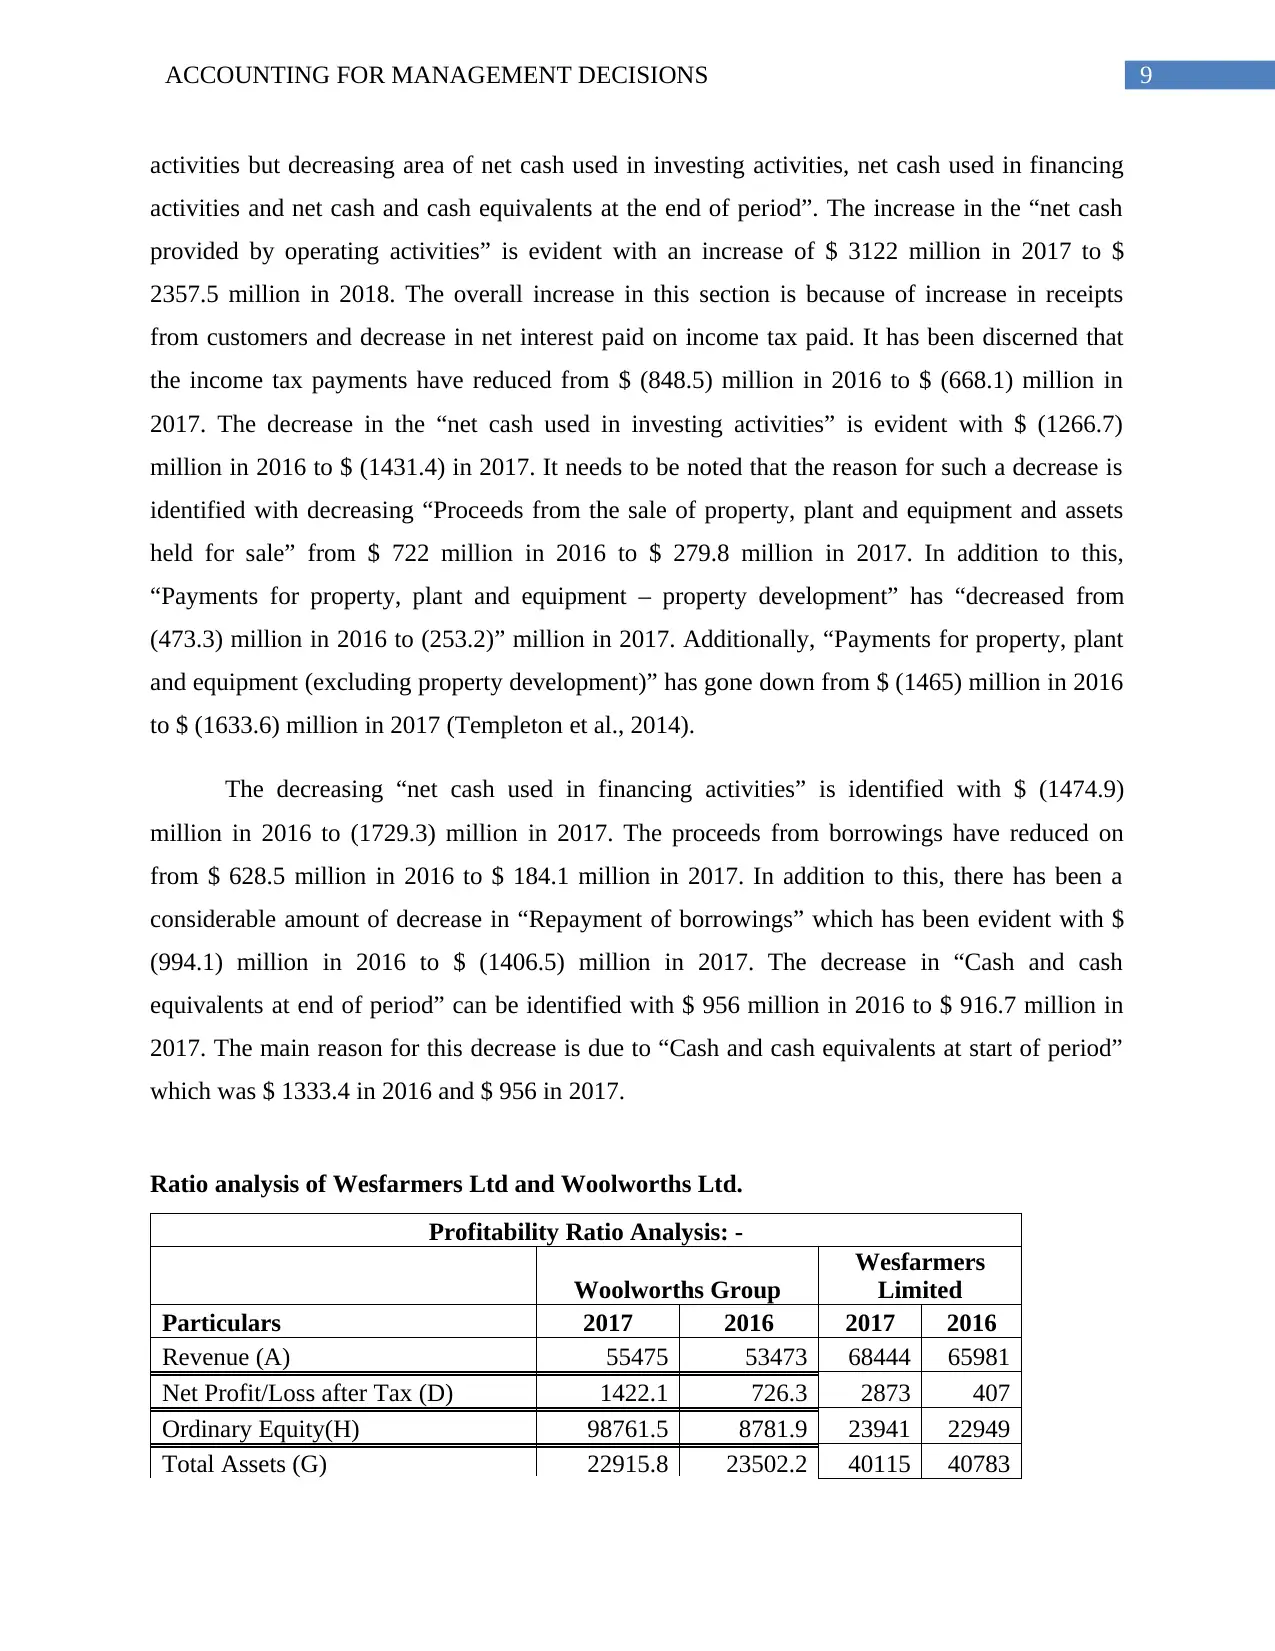
activities but decreasing area of net cash used in investing activities, net cash used in financing
activities and net cash and cash equivalents at the end of period”. The increase in the “net cash
provided by operating activities” is evident with an increase of $ 3122 million in 2017 to $
2357.5 million in 2018. The overall increase in this section is because of increase in receipts
from customers and decrease in net interest paid on income tax paid. It has been discerned that
the income tax payments have reduced from $ (848.5) million in 2016 to $ (668.1) million in
2017. The decrease in the “net cash used in investing activities” is evident with $ (1266.7)
million in 2016 to $ (1431.4) in 2017. It needs to be noted that the reason for such a decrease is
identified with decreasing “Proceeds from the sale of property, plant and equipment and assets
held for sale” from $ 722 million in 2016 to $ 279.8 million in 2017. In addition to this,
“Payments for property, plant and equipment – property development” has “decreased from
(473.3) million in 2016 to (253.2)” million in 2017. Additionally, “Payments for property, plant
and equipment (excluding property development)” has gone down from $ (1465) million in 2016
to $ (1633.6) million in 2017 (Templeton et al., 2014).
The decreasing “net cash used in financing activities” is identified with $ (1474.9)
million in 2016 to (1729.3) million in 2017. The proceeds from borrowings have reduced on
from $ 628.5 million in 2016 to $ 184.1 million in 2017. In addition to this, there has been a
considerable amount of decrease in “Repayment of borrowings” which has been evident with $
(994.1) million in 2016 to $ (1406.5) million in 2017. The decrease in “Cash and cash
equivalents at end of period” can be identified with $ 956 million in 2016 to $ 916.7 million in
2017. The main reason for this decrease is due to “Cash and cash equivalents at start of period”
which was $ 1333.4 in 2016 and $ 956 in 2017.
Ratio analysis of Wesfarmers Ltd and Woolworths Ltd.
Profitability Ratio Analysis: -
Woolworths Group
Wesfarmers
Limited
Particulars 2017 2016 2017 2016
Revenue (A) 55475 53473 68444 65981
Net Profit/Loss after Tax (D) 1422.1 726.3 2873 407
Ordinary Equity(H) 98761.5 8781.9 23941 22949
Total Assets (G) 22915.8 23502.2 40115 40783
Paraphrase This Document
Need a fresh take? Get an instant paraphrase of this document with our AI Paraphraser
10ACCOUNTING FOR MANAGEMENT DECISIONS
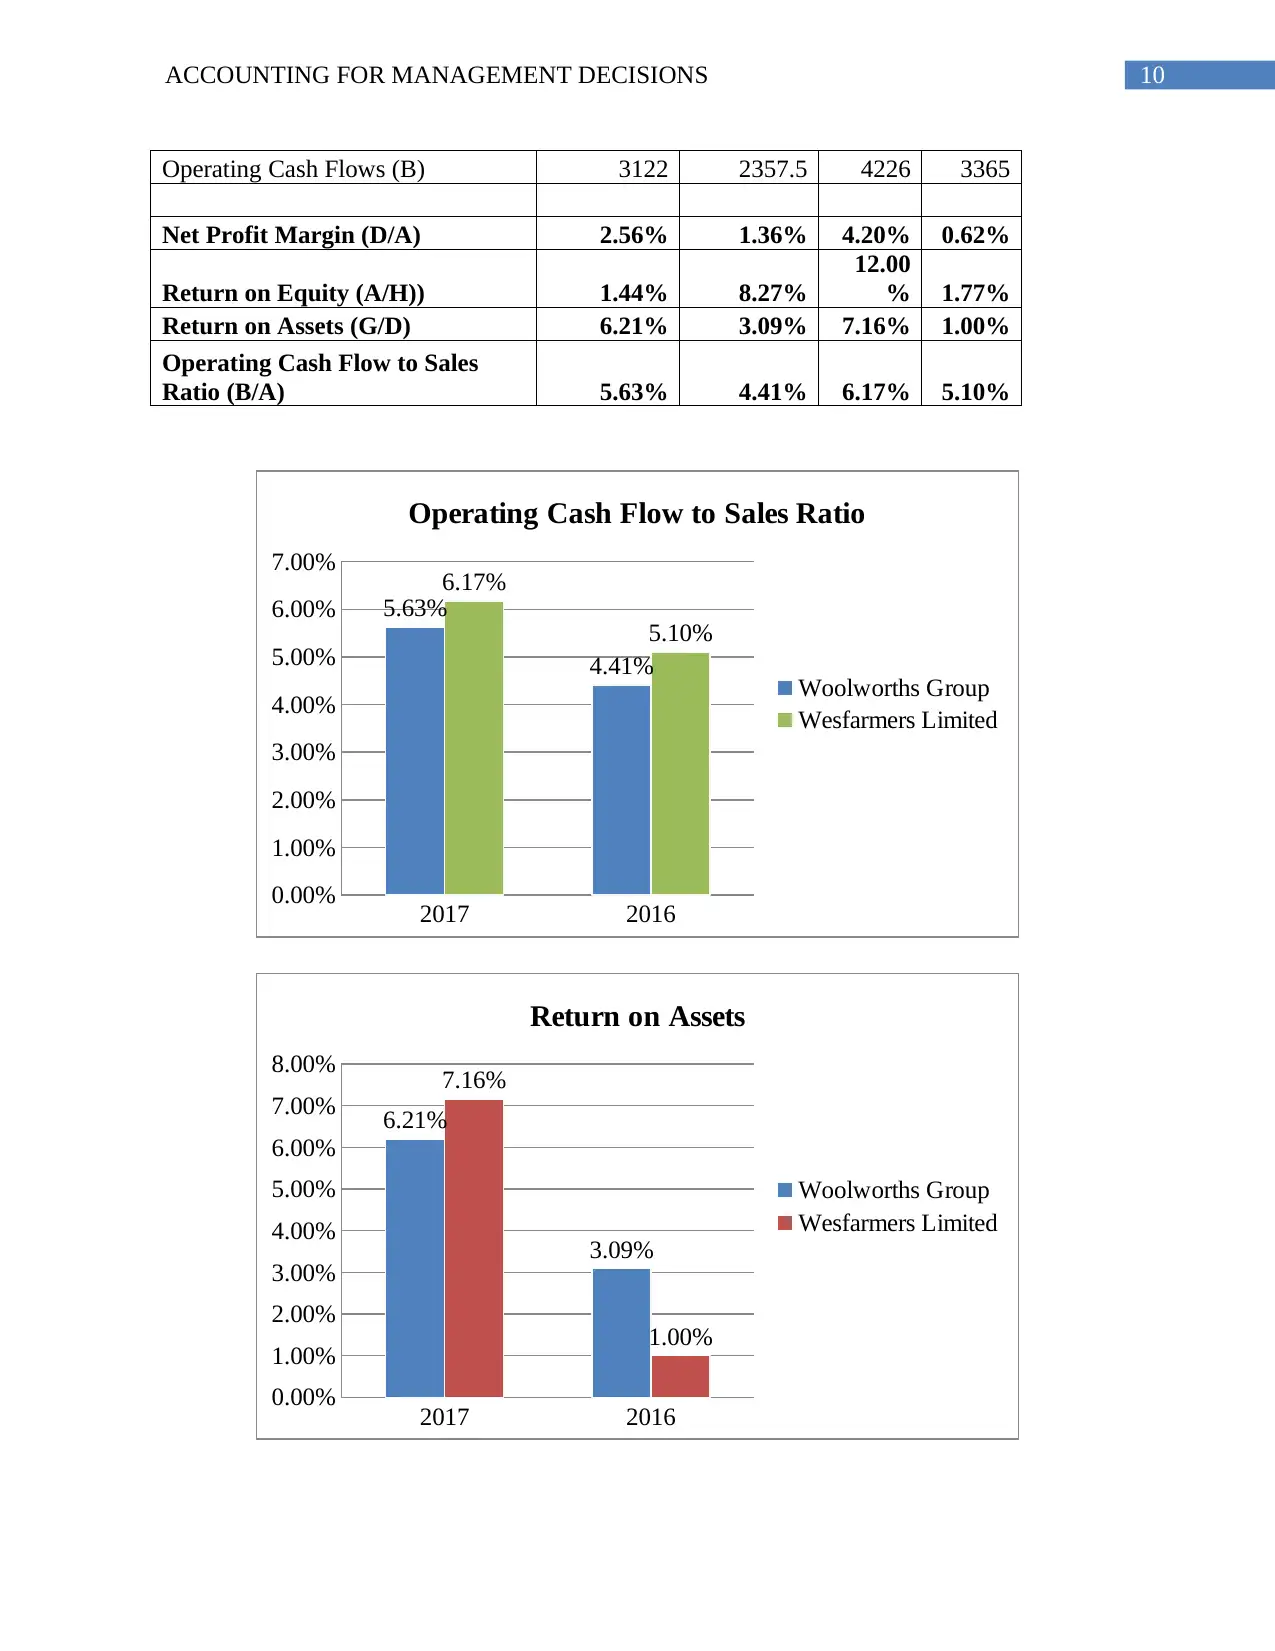
Operating Cash Flows (B) 3122 2357.5 4226 3365
Net Profit Margin (D/A) 2.56% 1.36% 4.20% 0.62%
Return on Equity (A/H)) 1.44% 8.27%
12.00
% 1.77%
Return on Assets (G/D) 6.21% 3.09% 7.16% 1.00%
Operating Cash Flow to Sales
Ratio (B/A) 5.63% 4.41% 6.17% 5.10%
2017 2016
0.00%
1.00%
2.00%
3.00%
4.00%
5.00%
6.00%
7.00%
5.63%
4.41%
6.17%
5.10%
Operating Cash Flow to Sales Ratio
Woolworths Group
Wesfarmers Limited
2017 2016
0.00%
1.00%
2.00%
3.00%
4.00%
5.00%
6.00%
7.00%
8.00%
6.21%
3.09%
7.16%
1.00%
Return on Assets
Woolworths Group
Wesfarmers Limited
11ACCOUNTING FOR MANAGEMENT DECISIONS
2017 2016
0.00%
2.00%
4.00%
6.00%
8.00%
10.00%
12.00%
14.00%
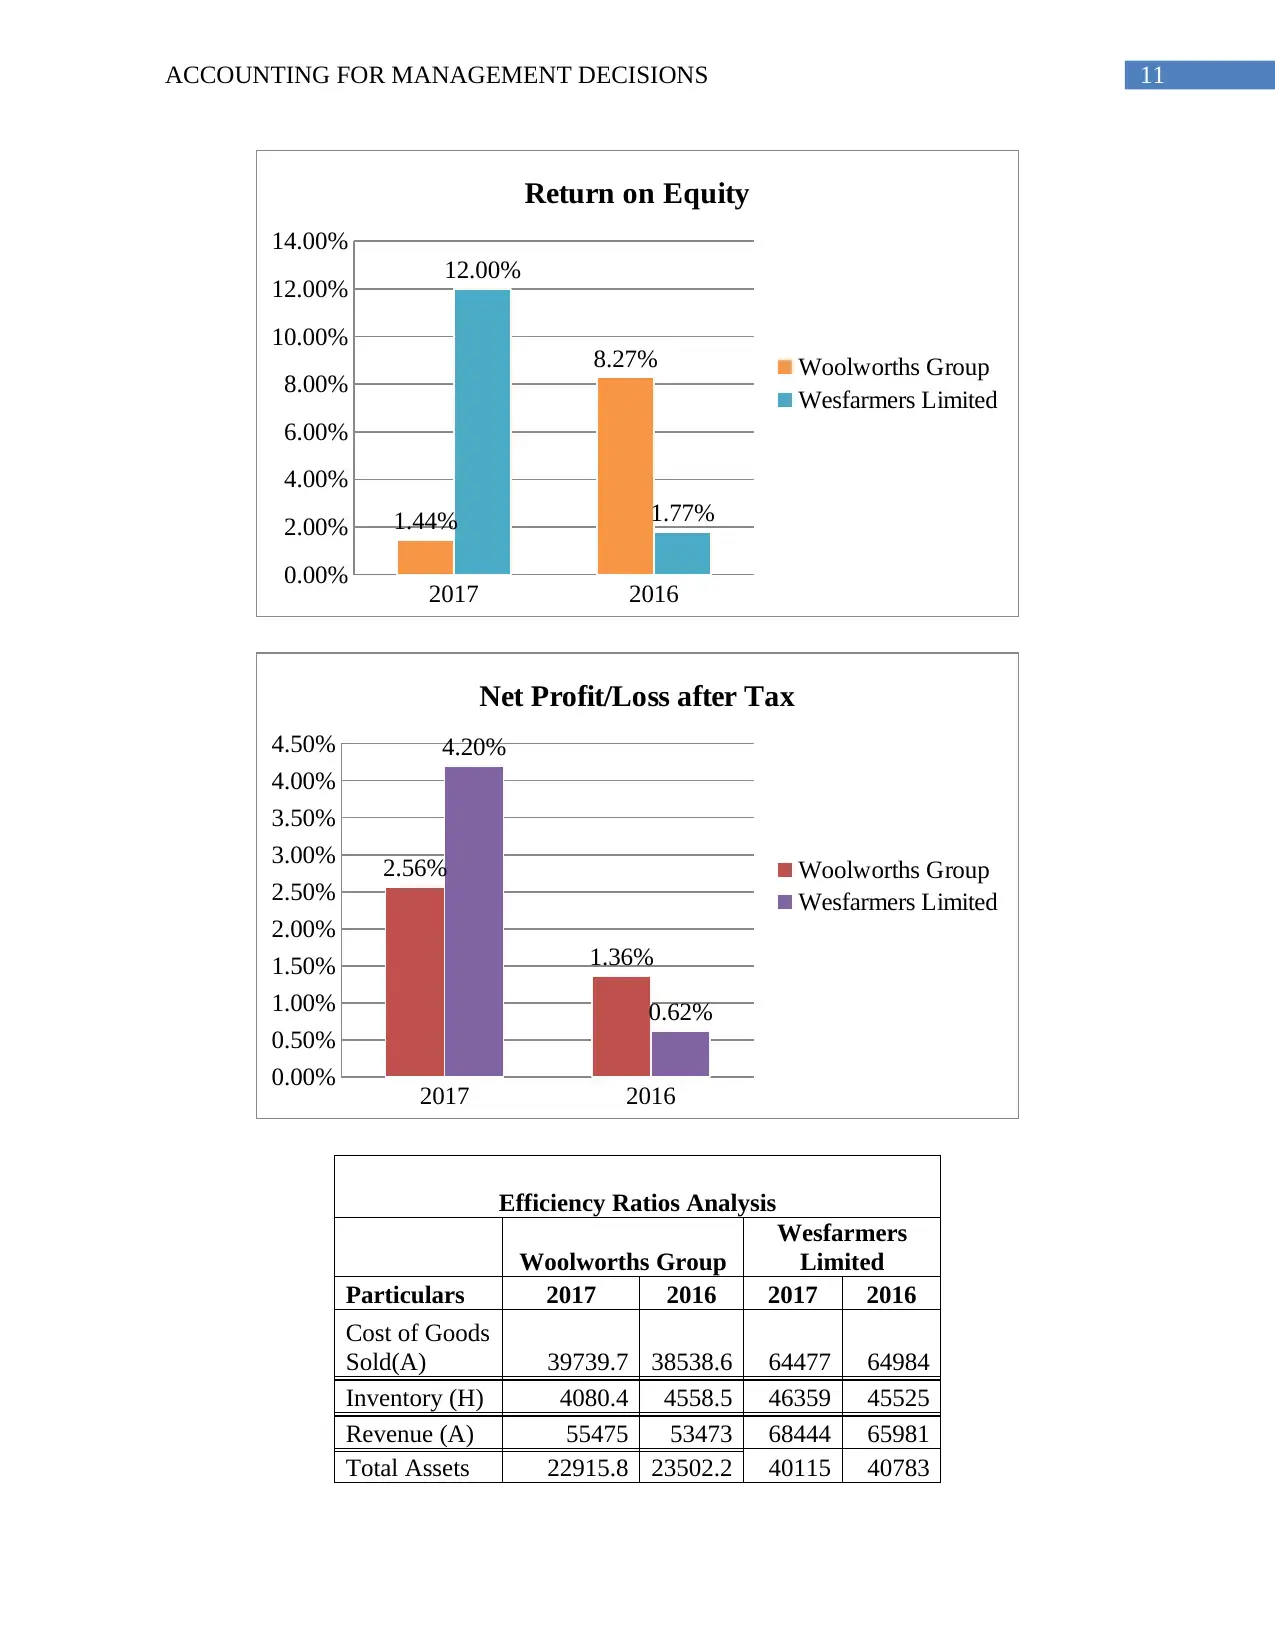
1.44%
8.27%
12.00%
1.77%
Return on Equity
Woolworths Group
Wesfarmers Limited
2017 2016
0.00%
0.50%
1.00%
1.50%
2.00%
2.50%
3.00%
3.50%
4.00%
4.50%
2.56%
1.36%
4.20%
0.62%
Net Profit/Loss after Tax
Woolworths Group
Wesfarmers Limited
Efficiency Ratios Analysis
Woolworths Group
Wesfarmers
Limited
Particulars 2017 2016 2017 2016
Cost of Goods
Sold(A) 39739.7 38538.6 64477 64984
Inventory (H) 4080.4 4558.5 46359 45525
Revenue (A) 55475 53473 68444 65981
Total Assets 22915.8 23502.2 40115 40783
2017 2016
0.00%
2.00%
4.00%
6.00%
8.00%
10.00%
12.00%
14.00%
1.44%
8.27%
12.00%
1.77%
Return on Equity
Woolworths Group
Wesfarmers Limited
2017 2016
0.00%
0.50%
1.00%
1.50%
2.00%
2.50%
3.00%
3.50%
4.00%
4.50%
2.56%
1.36%
4.20%
0.62%
Net Profit/Loss after Tax
Woolworths Group
Wesfarmers Limited
Efficiency Ratios Analysis
Woolworths Group
Wesfarmers
Limited
Particulars 2017 2016 2017 2016
Cost of Goods
Sold(A) 39739.7 38538.6 64477 64984
Inventory (H) 4080.4 4558.5 46359 45525
Revenue (A) 55475 53473 68444 65981
Total Assets 22915.8 23502.2 40115 40783
⊘ This is a preview!⊘
Do you want full access?
Subscribe today to unlock all pages.
Trusted by 1+ million students worldwide
1 out of 18
Related Documents


Your All-in-One AI-Powered Toolkit for Academic Success.
+13062052269
info@desklib.com
Available 24*7 on WhatsApp / Email
![[object Object]](/_next/static/media/star-bottom.7253800d.svg)
Unlock your academic potential
Copyright © 2020–2026 A2Z Services. All Rights Reserved. Developed and managed by ZUCOL.