Comprehensive Financial Analysis Report: Westpac Banking Corporation
VerifiedAdded on 2023/03/31
|16
|3225
|281
Report
AI Summary
This report provides a comprehensive financial analysis of Westpac Banking Corporation, focusing on its performance within the Australian banking sector. The analysis includes the computation and interpretation of key financial ratios, such as profitability and operating efficiency ratios, to assess the bank's financial health. The report examines the movement of Westpac's share price, comparing it to market benchmarks and identifying factors that have influenced its performance. Furthermore, it calculates the cost of equity using the dividend capitalization model, providing insights into the bank's capital structure and investment attractiveness. The report concludes with an evaluation of Westpac's current financial standing, highlighting both strengths and weaknesses, and offers recommendations based on the findings. The study indicates that the bank is facing challenges, with certain ratios not being appealing, but the shares are available at a cheap price and is the best time to buy the stock.

BUSINESS FINANCE
Paraphrase This Document
Need a fresh take? Get an instant paraphrase of this document with our AI Paraphraser
Westpac banking corporation
Abstract
The report is based upon the financial performance of the leading bank of Australia that is the
Westpac Banking Corporation. The financial performance of the bank is ascertained through
appropriate research that uses ratio analysis, share price movement of the company. The
overall structure provides a glimpse that the bank is amidst difficulties as the ratios are not
appealing in nature. ROA and ROE are weak indicating that poor utilization of resources.
Further, the cost of equity has been done with the aid of data provided and the overall study
indicates that the bank is performing under huge pressure. However, considering the overall
proposition and fundamentals it can be said that the shares are available at a cheap price and
is the best time to buy the stock.
2
Westpac banking corporation
Contents
1. Introduction...................................................................................................................................4
2. Financial Analysis.........................................................................................................................4
2.1. Westpac Banking Corporation Description................................................................................4
2.2. Computations of financial ratios................................................................................................5
Profitability ratio...........................................................................................................................5
Operating efficiency ratio..............................................................................................................6
2.3. Graphs & comparison................................................................................................................7
2.4. Computation of Cost of equity...................................................................................................8
2.5. Identification of the capital structure.........................................................................................9
Conclusion...........................................................................................................................................12
Recommendation.................................................................................................................................12
References...........................................................................................................................................13
Appendix.............................................................................................................................................15
3
⊘ This is a preview!⊘
Do you want full access?
Subscribe today to unlock all pages.
Trusted by 1+ million students worldwide
Westpac banking corporation
1. Introduction
The current report reflects upon the performance of Westpac banking corporation, a pioneer
in the field of banking and listed on the ASX. The financial analysis of a company can be
done with the aid of the financial statements and it helps in taking relevant decisions. The
main aim of the research is to shed light on the performance of the company. The report is
structured in a manner that it provides adequate emphasis on the performance of the company
through the computation of ratios together with the movement of the share price. The
calculated ratio comprises the profitability ratio and efficiency ratio. Further, the equity and
capital structure of the company is discussed and considering its recommendation is chalked
out. The past 2-year share price trend of the company indicates that the price has declined.
Though the fundamental of the company is strong yet there are immense challenges that led
to the decline. The findings further stress that the bank performed amidst a very complicated
climate. It’s been a difficult year for the bank owing to several hurdles.
2. Financial Analysis
2.1. Westpac Banking Corporation Description
Westpac is listed in the top 4 financial institutions of Australia and is also the oldest known
bank in the country. It is also listed as one of the strongest financial institutions in New
Zealand. Westpac offers a series of services in its industry with respect to banking and
finances. The company has a wide customer base owing to its brand value and top-class
services. The services offered by Westpac are incomparable and this is also why the company
has engraved its name in the international domain and has earned a competitive advantage in
the industry over its arch rivals (Westpac Banking Corporation, 2018).
The organization aims at attaining the number one position in its industry by means of
offering top-class services to its consumers and communities. The organization prioritizes its
clients’ satisfaction and thereby, ensures that the consumers deposit their hard earned money
in the same with full confidence and without any worries. The organization worships all its
clients irrespective of their contribution to the growth of the same (Foresight, 2018). Westpac
values all its customers no matter how small or huge investment they make and it is why the
organization currently has a customer base of not less than 13 million people.
4
Paraphrase This Document
Need a fresh take? Get an instant paraphrase of this document with our AI Paraphraser
Westpac banking corporation
The organization functions through 5 divisions that are completely consumer-centric. These
divisions are BankSA, Bank of Melbourne, Westpac, RAMS, and St.George. The
organization in association with Assembly Payments is working upon retaining and
conquering the market in a better way by means of engaging more and more investments
from the customers in the same. This partnering is now more than a year old. Partnering with
Assembly Payments has allowed Westpac to develop better solutions, improve its overall
services and maximize consumer satisfaction (Westpac Banking Corporation, 2018).
The Australian banking domain ranks at number 5 across the globe. The contribution of the
Australian overall banking domain is at least ten percent in the country’s economy. A lot of
international financial institutions have now started their operations in Australia on account
of the deregulation that took place in the year 1980. There are a total of twenty-one domestic
banks and subsidiaries of foreign banks in the retail banking industry of the country. New
Zealand Banking Group, Commonwealth Bank, National Australian Bank, and Westpac
Banking Corporation are the top leading banks of Australia (Westpac Banking Corporation,
2018).
2.2. Computations of financial ratios
Profitability ratio
A profitability ratio is a ratio that is used to determine the profitability of an organization and
how successful the same is in the utilization of its resources. Profitability ratios are one kind
of efficiency ratios that helps in the ascertainment of the efficiency of an organization with
respect to earning profits from its regular operations. Profitability ratio stresses on measuring
the ability of an organization to reap returns from its day to day functions. The users of the
ratios are potential and existing investors, creditors, accountant, employees, suppliers,
managers, directors, and shareholders (Lapsley, 2012).
The profitability ratio of the bank has been done through the medium of net profit margin,
return on assets (ROA) and return on equity (ROE). The ratio indicates the potential of the
company in reaping profits. Going by the net profit margin, it can be seen that the
performance has dipped marginally. The ratio declined from 37.15% in 2017 to 36.54% in
2018 indicating an increment in the operational expenses of the company. The sales of the
company have increased however; the operational expenses could not be controlled leading to
the drop in the profitability. As the net profit of the company has declined thereby it is
5
Westpac banking corporation
evident that it must be due to the lacklustre performance of Return on assets and return on
equity (Laux, 2014). Both ROA and ROE has declined in 2018 indicating that both the assets
and equity component could not be utilized in an effective manner. The ROA and ROE have
both dipped in the year 2018 stressing the fact that the bank could not utilize the assets in an
effective manner and hence, the profit dropped.
Operating efficiency ratio
An efficiency ratio helps in the measurement of an organization’s ability to utilize its
available resources so as to reap profits. The results achieved from the ratios are significant
for the organization to construct necessary strategies so as to enhance the utilization of the
available resources (Laux, 2014). This is due to the fact that the utilization of assets is
directly related to the generation of profits.
The operating efficiency ratio indicates the manner in which the company utilizes the assets.
The working capital ratio and fixed asset turnover have been computed to ascertain the
efficiency of the bank (Porter & Norton, 2014). The working capital ratio of the bank has
declined in 2018 meaning that there is a considerable increment in the current liabilities as
compared to current assets.
A low working capital ratio indicates that the company has insufficient funds and hence,
could not be able to meet the obligations. It is not a strong indicator because the business
will have difficulty in meeting the obligations. The management won’t be able to pay the bills
at the correct point of time (Leo, 2011). The fixed asset turnover indicates that the bank was
not able to utilize the asset to the optimum level. This can happen due to various factors such
as lower sales factor and bottleneck in the value chain.
6
⊘ This is a preview!⊘
Do you want full access?
Subscribe today to unlock all pages.
Trusted by 1+ million students worldwide
Westpac banking corporation
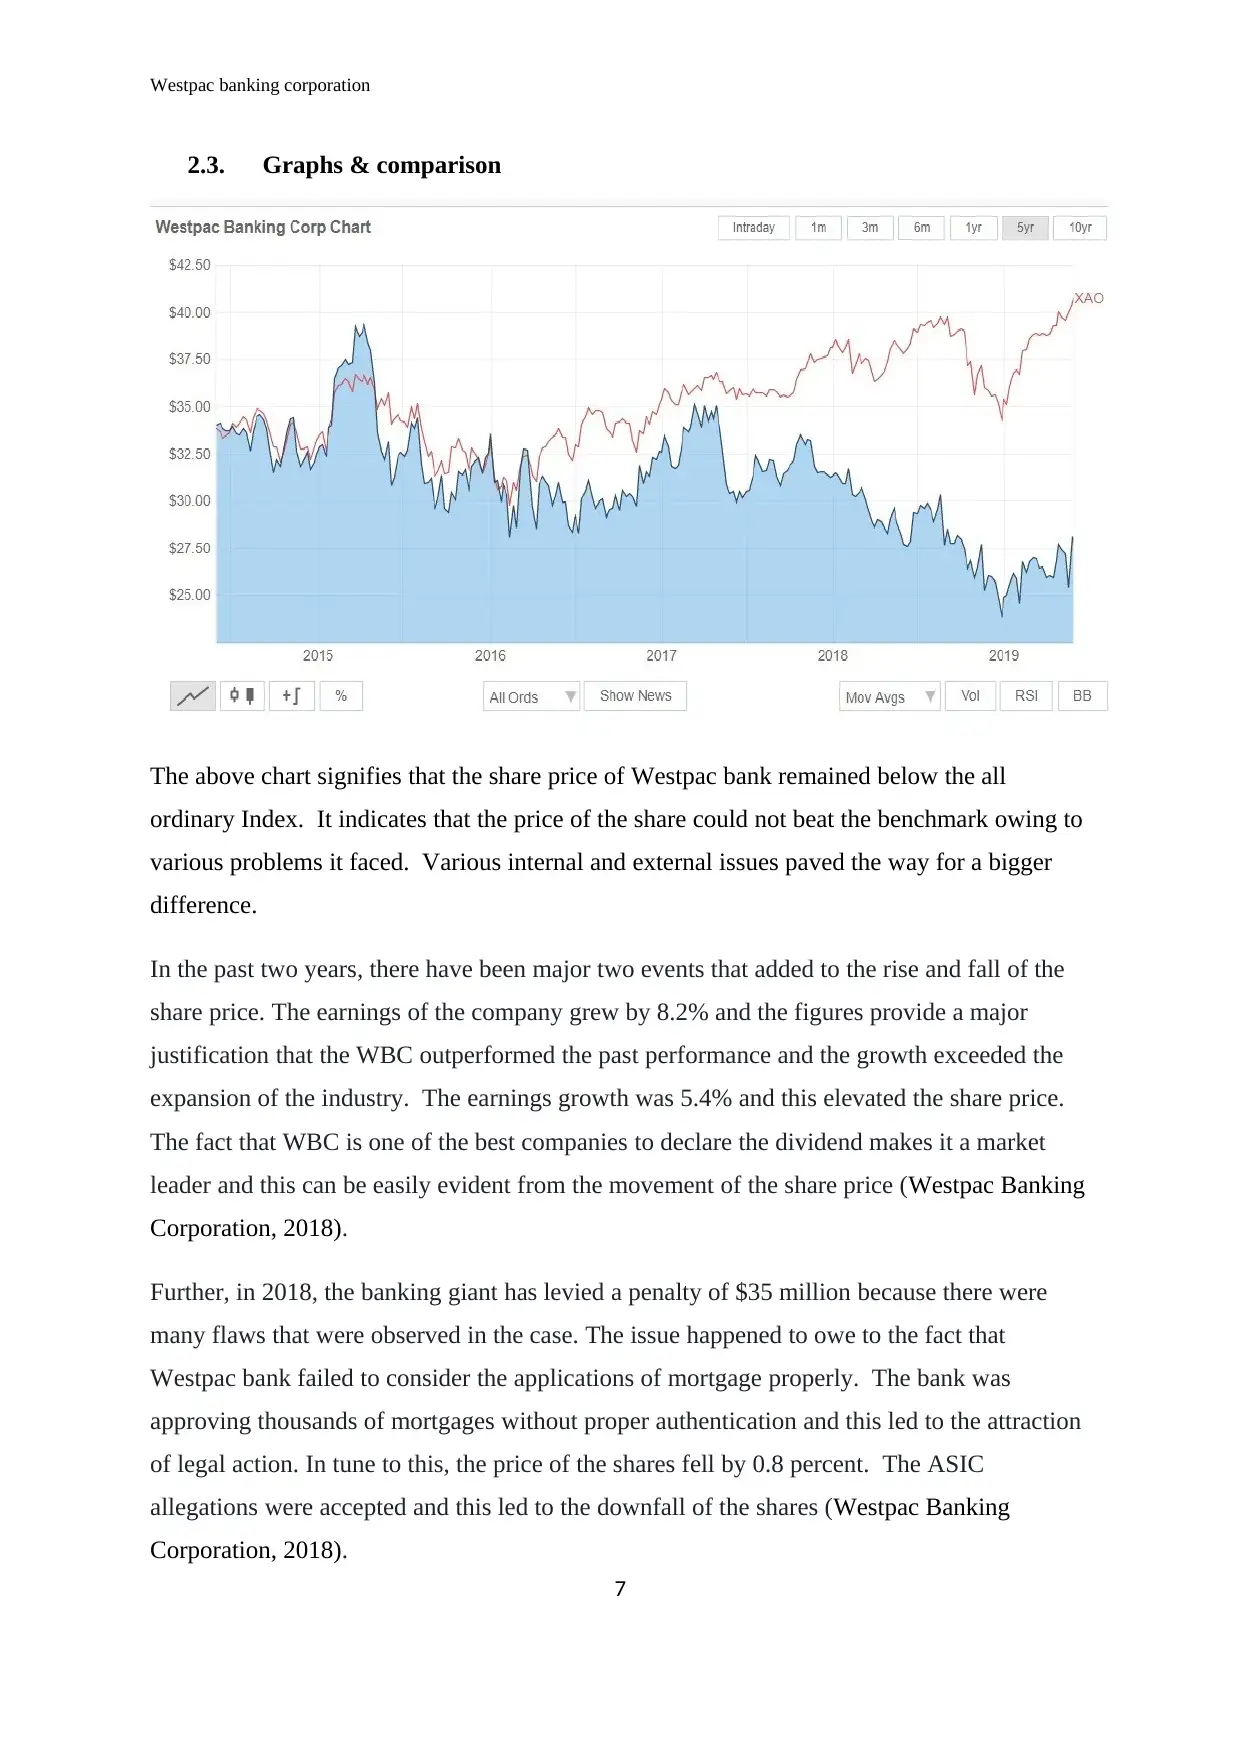
2.3. Graphs & comparison
The above chart signifies that the share price of Westpac bank remained below the all
ordinary Index. It indicates that the price of the share could not beat the benchmark owing to
various problems it faced. Various internal and external issues paved the way for a bigger
difference.
In the past two years, there have been major two events that added to the rise and fall of the
share price. The earnings of the company grew by 8.2% and the figures provide a major
justification that the WBC outperformed the past performance and the growth exceeded the
expansion of the industry. The earnings growth was 5.4% and this elevated the share price.
The fact that WBC is one of the best companies to declare the dividend makes it a market
leader and this can be easily evident from the movement of the share price (Westpac Banking
Corporation, 2018).
Further, in 2018, the banking giant has levied a penalty of $35 million because there were
many flaws that were observed in the case. The issue happened to owe to the fact that
Westpac bank failed to consider the applications of mortgage properly. The bank was
approving thousands of mortgages without proper authentication and this led to the attraction
of legal action. In tune to this, the price of the shares fell by 0.8 percent. The ASIC
allegations were accepted and this led to the downfall of the shares (Westpac Banking
Corporation, 2018).
7
Paraphrase This Document
Need a fresh take? Get an instant paraphrase of this document with our AI Paraphraser
Westpac banking corporation
The only thing that saved the share price of the company to fall immensely is the fact that
WBC is the best dividend provider in the market and has increased the dividend payment
over the past ten years (Seeker, 2018). This has created a trust in the mind of the investors
and thereby the share price was moving on an average basis (Ferris, Noronha. & Unlu, 2010).
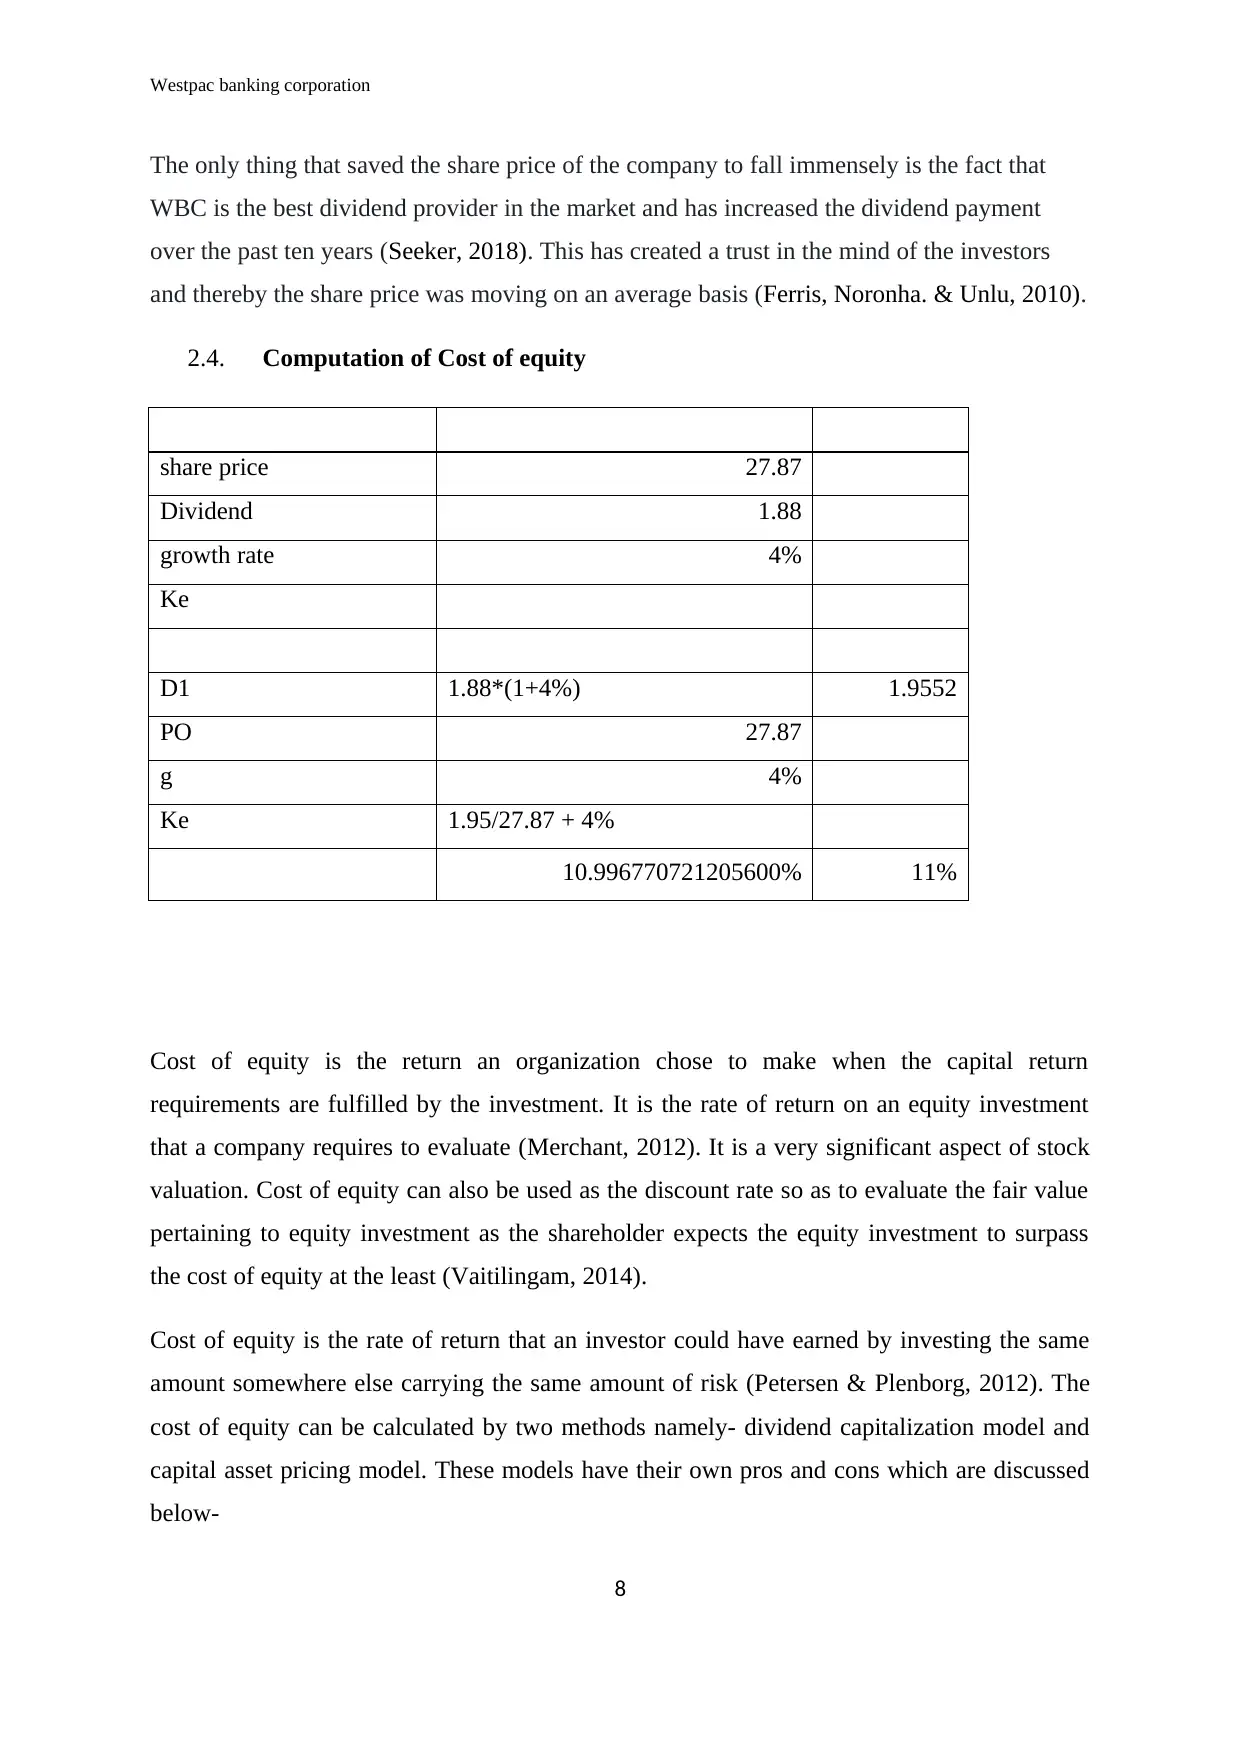
2.4. Computation of Cost of equity
share price 27.87
Dividend 1.88
growth rate 4%
Ke
D1 1.88*(1+4%) 1.9552
PO 27.87
g 4%
Ke 1.95/27.87 + 4%
10.996770721205600% 11%
Cost of equity is the return an organization chose to make when the capital return
requirements are fulfilled by the investment. It is the rate of return on an equity investment
that a company requires to evaluate (Merchant, 2012). It is a very significant aspect of stock
valuation. Cost of equity can also be used as the discount rate so as to evaluate the fair value
pertaining to equity investment as the shareholder expects the equity investment to surpass
the cost of equity at the least (Vaitilingam, 2014).
Cost of equity is the rate of return that an investor could have earned by investing the same
amount somewhere else carrying the same amount of risk (Petersen & Plenborg, 2012). The
cost of equity can be calculated by two methods namely- dividend capitalization model and
capital asset pricing model. These models have their own pros and cons which are discussed
below-
8
The only thing that saved the share price of the company to fall immensely is the fact that
WBC is the best dividend provider in the market and has increased the dividend payment
over the past ten years (Seeker, 2018). This has created a trust in the mind of the investors
and thereby the share price was moving on an average basis (Ferris, Noronha. & Unlu, 2010).
2.4. Computation of Cost of equity
share price 27.87
Dividend 1.88
growth rate 4%
Ke
D1 1.88*(1+4%) 1.9552
PO 27.87
g 4%
Ke 1.95/27.87 + 4%
10.996770721205600% 11%
Cost of equity is the return an organization chose to make when the capital return
requirements are fulfilled by the investment. It is the rate of return on an equity investment
that a company requires to evaluate (Merchant, 2012). It is a very significant aspect of stock
valuation. Cost of equity can also be used as the discount rate so as to evaluate the fair value
pertaining to equity investment as the shareholder expects the equity investment to surpass
the cost of equity at the least (Vaitilingam, 2014).
Cost of equity is the rate of return that an investor could have earned by investing the same
amount somewhere else carrying the same amount of risk (Petersen & Plenborg, 2012). The
cost of equity can be calculated by two methods namely- dividend capitalization model and
capital asset pricing model. These models have their own pros and cons which are discussed
below-
8
Westpac banking corporation
The dividend capitalization model is used so as to evaluate an organization’s cost of equity. It
is a very simple method. However, the shortcoming of the method can be attributed to the
fact that it cannot be applied to entities that do not make dividend payments. This is due to
the fact that the basis of construing this method is dividends. The model does not take the risk
of investment into consideration and is based on the fact that dividends grow at a continuous
pace over time (Douma & Hein, 2013)
Capital asset pricing model can be used by any organization, unlike dividend capitalization
model. The model depends hugely on previous performance to forecast the performance in
the future (Needles & Powers, 2013). The only shortcoming of this model is that the results
of the same are not much concrete in nature in comparison to dividend capitalization method
as the model lays huge emphasis on estimates (Davies & Crawford, 2012)
2.5. Identification of the capital structure
The weighted average cost of capital helps the users of the financial statements in the
determination of standard costs which are to be incurred by the sources of capital. These costs
are pre-determined by the users of the financial statements. The evaluation of the weighted
average cost of capital is done by means of considering the costs incurred by various sources
of capital (Foresight, 2018). The sources of capital are bonds, common stock, long term
debts, preferred stock, and others. The weighted average cost of capital can impact the
managerial processes as higher the former, higher shall be the implication on the latter. The
weighted average cost of capital also highlights the prevalence of risk on the company’s
activities as higher the former, higher shall be the impact on the latter (Parrino, Kidwell and
Bates, 2012). It is why WACC is also deemed as the group’s cost of capital. A portfolio that
is riskier will plough more returns in comparison to the ones that are less risky or not risky at
all. This is why most investors prefer a risky portfolio over other options (Adra &
Barbopoulos, 2018). There is also a common proverb that says no risks, no gains which
justify the above statement. The decision to choose a risky profile allows users to share
greater risks and returns.
Ko – 5%
9
⊘ This is a preview!⊘
Do you want full access?
Subscribe today to unlock all pages.
Trusted by 1+ million students worldwide
Westpac banking corporation
Ke – 10%
The assets of a company are financed with the help of debt and equity. it is important ot
compute the weight of equity and debt. The weight of equity is 10% while the weight of debt
stands at 5%. Both the respective weight were being provided. the market capitalization of
Westpac in the current scenario stands at $66751.250 Mil.
the market value of debt comprises of long term debt and capital lease.
Now, cost of equity:
The CAPM model is being used to compute the required rate of return. The formula stands at
Cost of Equity = Risk-Free Rate of Return + Beta (asset) * (Market return expected - Risk-
Free Rate of Return). At present the risk free rate stands at 1.96%. the risk free rate is being
used considering the 10 year treasury constant maturity rate.
The Beta is the stock sensitivity in comparison to the market as a whole. It helps in tracing
the movement of the stock in comparison to the overall market. At present the beta of the
Westpac bank is 0.80.
Here market premium stands at 6%. Market premium is the expected market return in excess
of the risk free return of the market.
Cost of equity = 1.96% + 0.80 = 6.76%
Now, Cost of Debt
As per the figure of 2018, the interest expense stood at $11574.9279539 million and the total
book value of debt (D) stood at $142089.106789 m.
Cost of debt can be computed as = 11574.9279539 / 142089.106789 = 8.1462%.
This is being multiplied by 1 minus average tax rate that comes to 30.755%
WACC of Westpac Banking corporation
WACC = E/(E+D)* cost of equity +D/(E+D)* cost of debt *(1- tax rate)
=0.3196 *10% + 0.6804 * 5% *(1-30.755%)
10
Paraphrase This Document
Need a fresh take? Get an instant paraphrase of this document with our AI Paraphraser

Westpac banking corporation
=6%
11
=6%
11
Westpac banking corporation
Conclusion
The overall analysis and study from the report of Westpac Banking Corporation indicate that
the company has strong fundamentals however, at the present scenario it is failing to operate
in full potential mode. The ratios imply weakness in the ROE and ROA indicating that the
company needs to stress upon the proper utilization of assets and equity. On the other hand,
the share price of the company failed to project a high upsurge on account of various issues
that it faced. In all probability, it can be commented that the company has shown great
potential and that is evident from the net profit and its continuous payment of dividend.
Thereby, it can be said that the bank can further progress if the resources are utilized in an
optimum manner.
Recommendation
The banking stock of Australia failed to project a sharp upsurge and the downward moves
have been sharp. The share valuations are attractive. It needs to be noted that the employment
in Australia ranks high that will influence consumer spending even considering the fact that
the prices will decline. the main attraction of the bank hares has been the high dividend
yield. From the report, it clearly evident that the year 2018 was highly challenging in nature
and despite the challenge the company was able to deliver in many areas. The overall
performance was flat and in this scenario, the best that the bank could do is to utilize the
resources optimally. For instance, the bank can stress on ROA and ROE that will help the
bank to enhance its profit. The weak areas must be considered that will help it to bring more
profit. Further, it must ensure that strong credit quality is maintained that will help in
matching the performance.
12
⊘ This is a preview!⊘
Do you want full access?
Subscribe today to unlock all pages.
Trusted by 1+ million students worldwide
1 out of 16
Related Documents


Your All-in-One AI-Powered Toolkit for Academic Success.
+13062052269
info@desklib.com
Available 24*7 on WhatsApp / Email
![[object Object]](/_next/static/media/star-bottom.7253800d.svg)
Unlock your academic potential
Copyright © 2020–2026 A2Z Services. All Rights Reserved. Developed and managed by ZUCOL.