Financial Analysis Report: Westpac Banking Corp. - FINC101

Verified

Added on  2022/10/04

|7
|1485
|29
Report
AI Summary
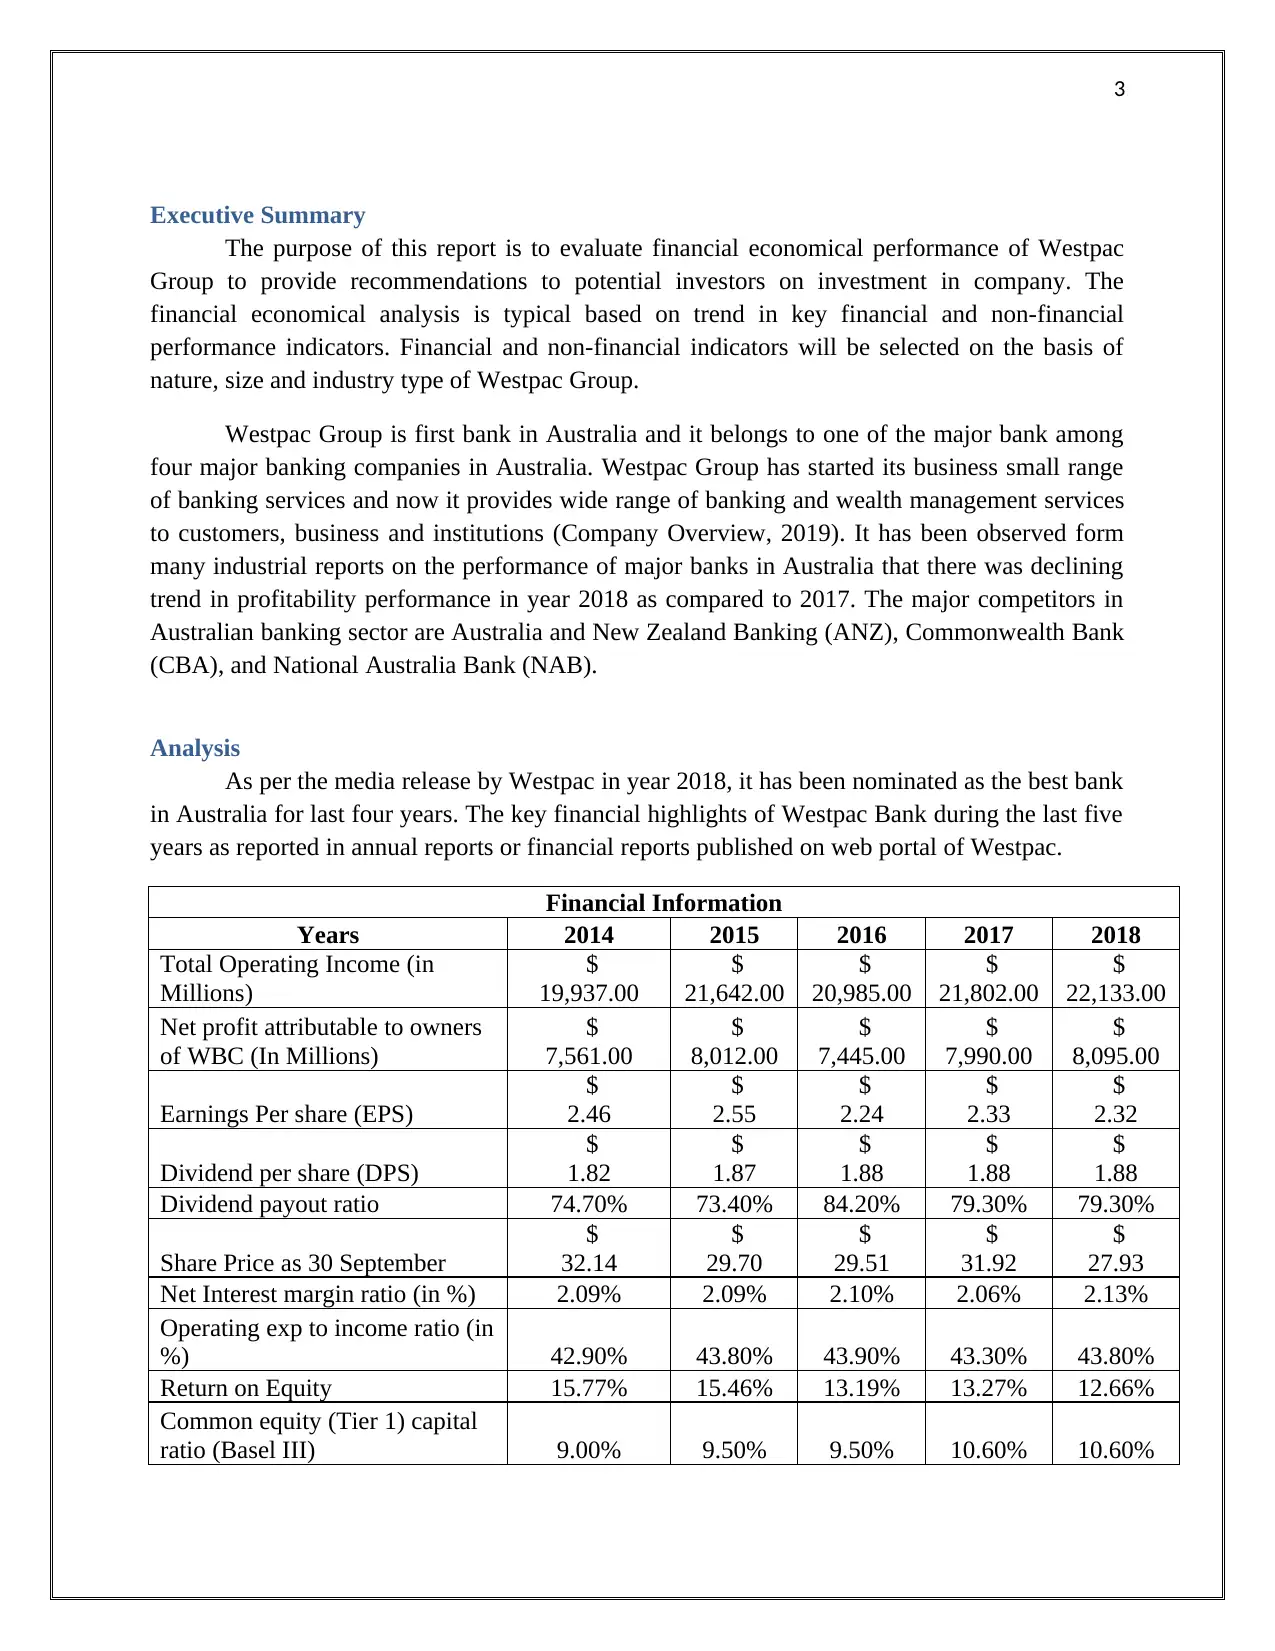
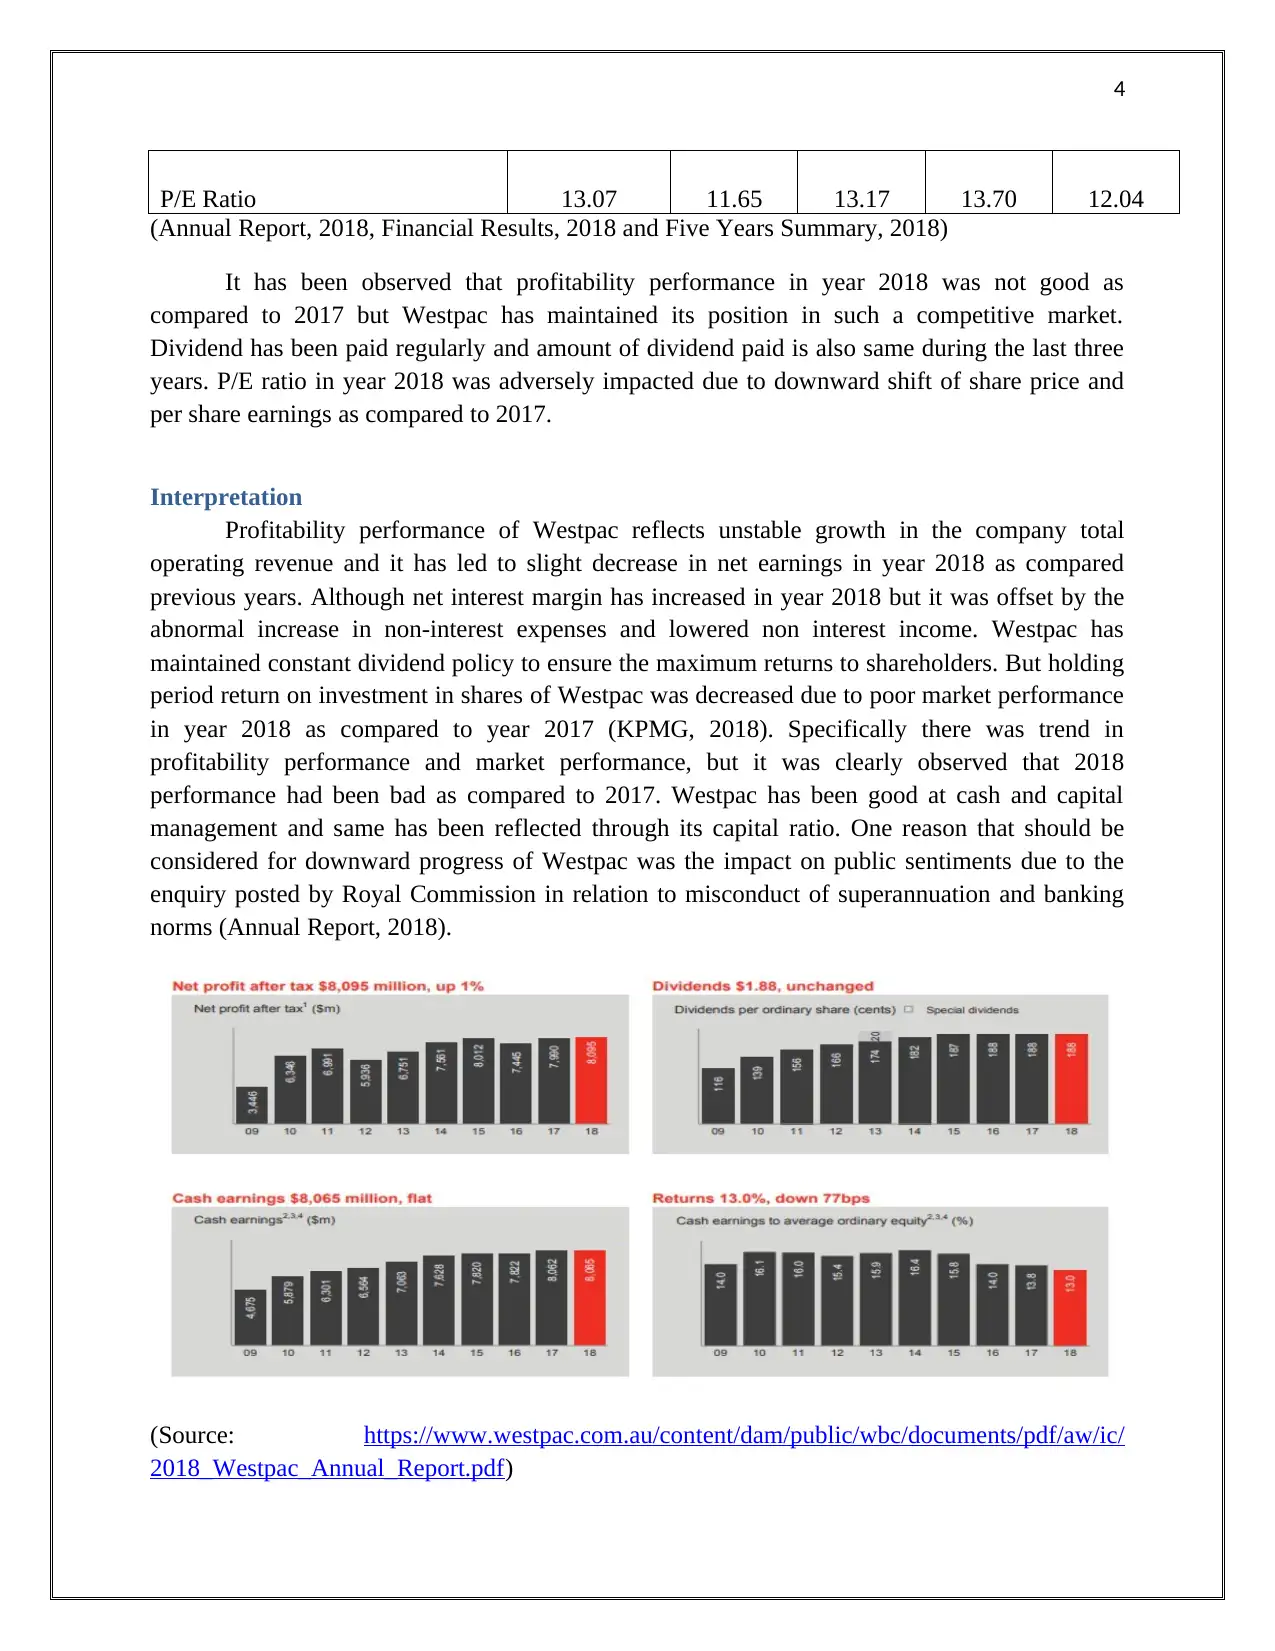
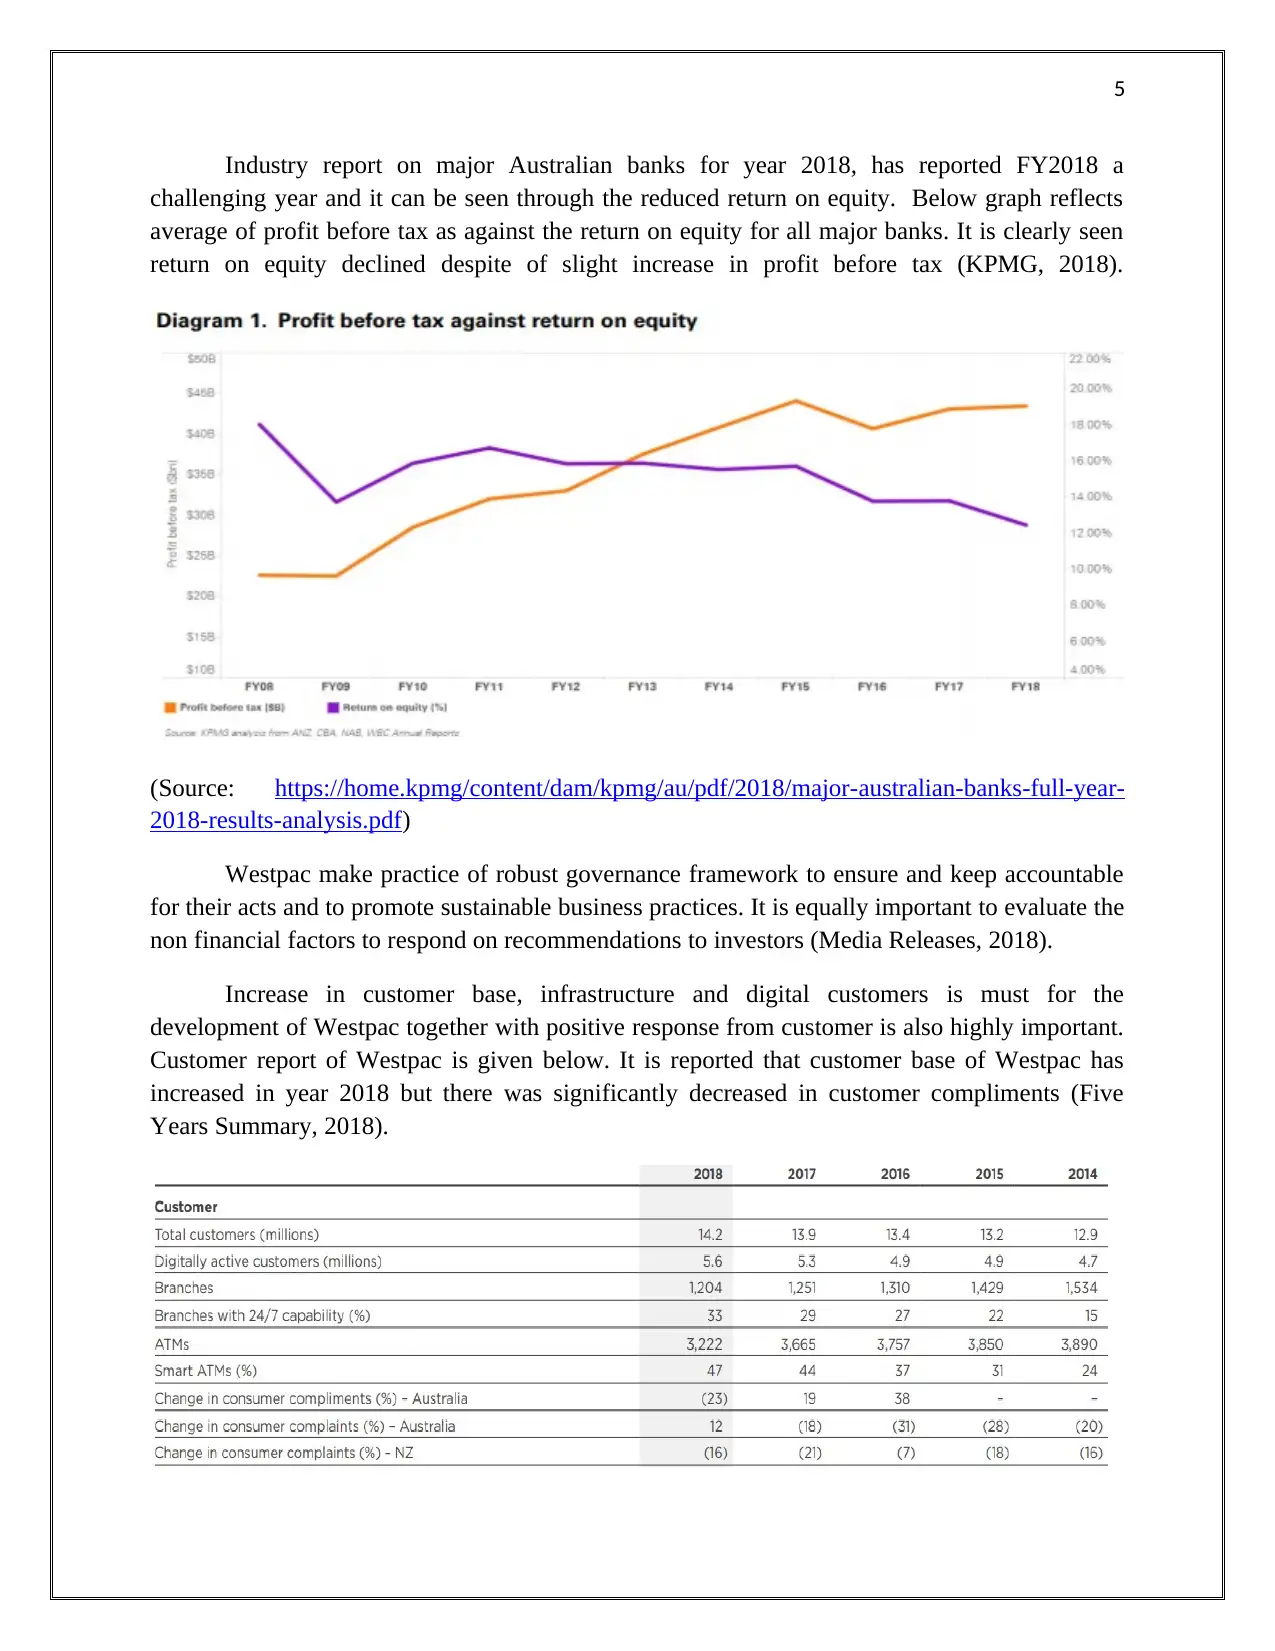
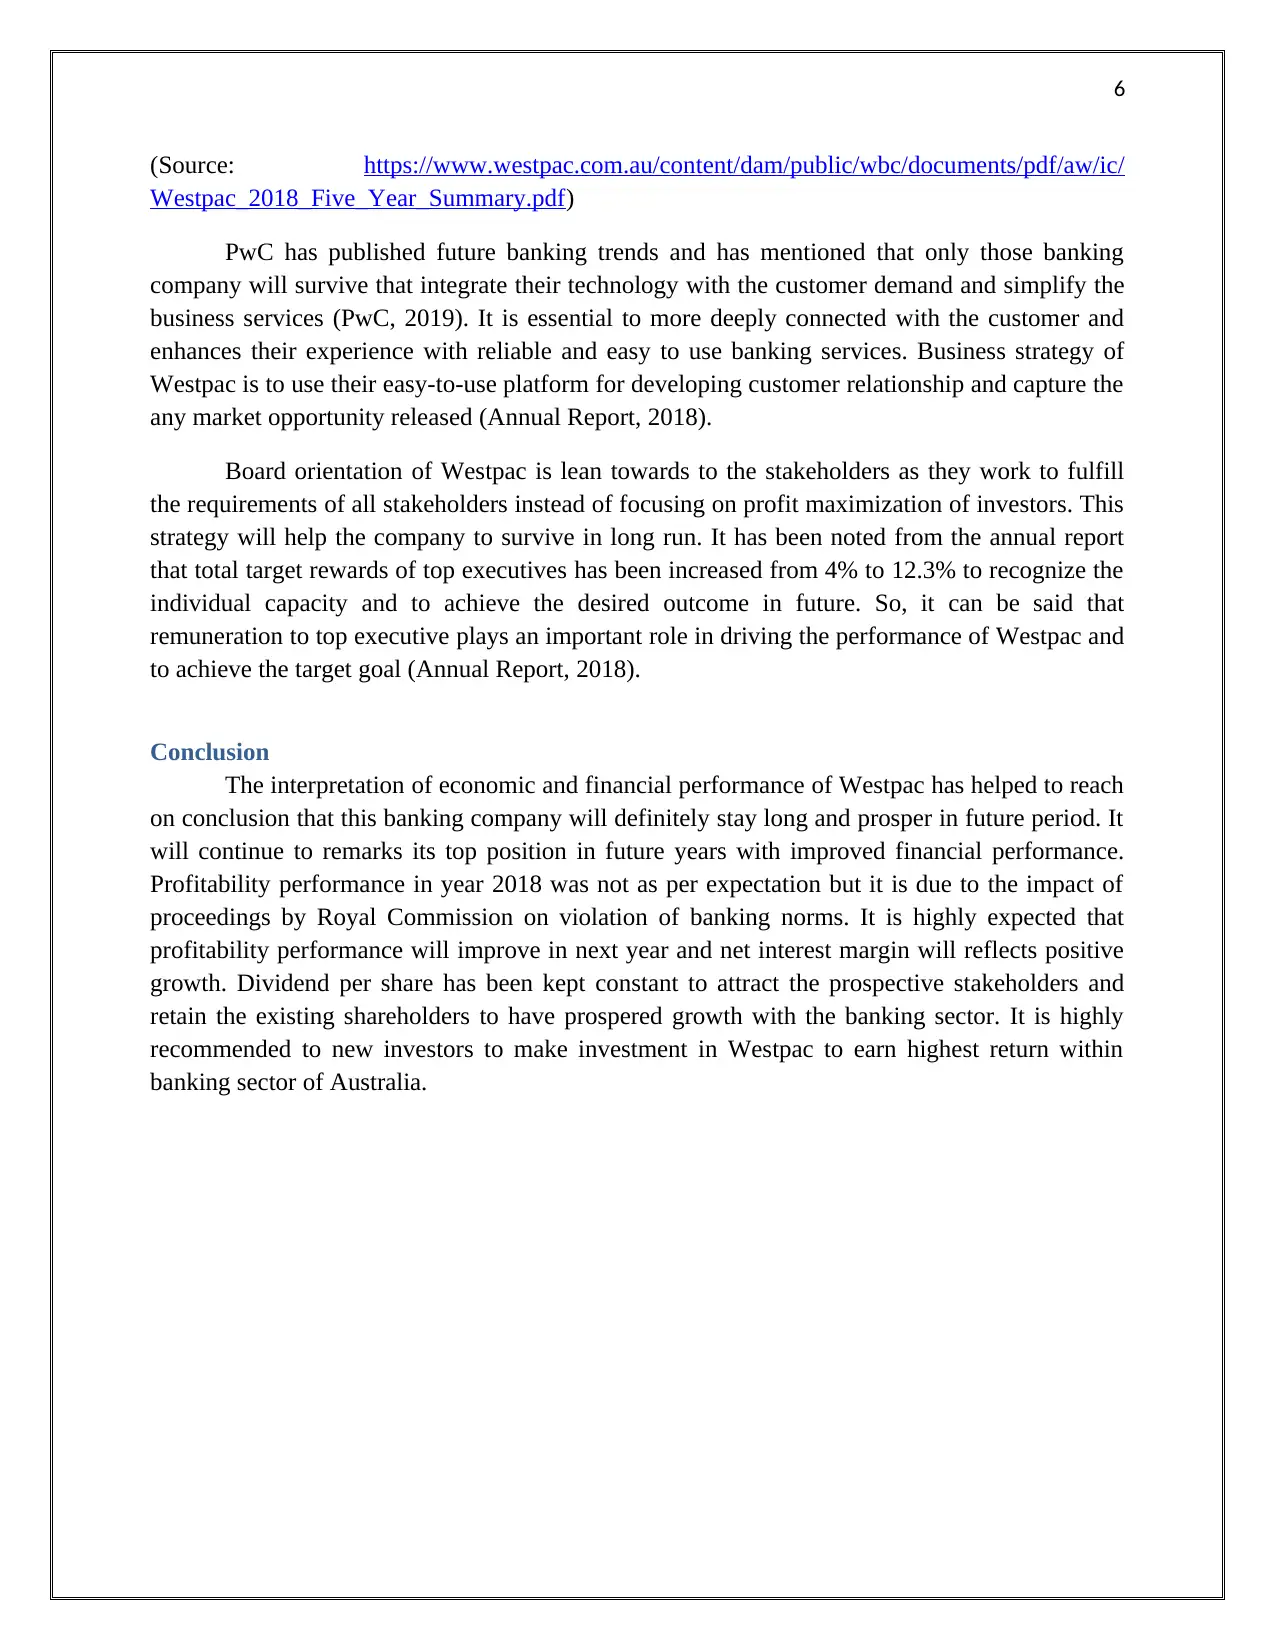
This financial analysis report evaluates the financial and economic performance of Westpac Group, providing recommendations to potential investors. The report analyzes key financial indicators, including total operating income, net profit, earnings per share, dividend per share, and various financial ratios over a five-year period (2014-2018). It interprets the trends in profitability, dividend policy, and market performance, considering factors such as the impact of the Royal Commission and industry trends. The analysis also incorporates non-financial factors like customer base and governance framework. The conclusion suggests that Westpac is well-positioned for future growth and recommends investment, highlighting its constant dividend policy and expected improvement in profitability. The report references the company's annual reports, financial results, and industry reports from KPMG and PwC.
Document Page
1
Financial & Economic Interpretation and Communication
tabler-icon-diamond-filled.svg

Paraphrase This Document

Need a fresh take? Get an instant paraphrase of this document with our AI Paraphraser
Document Page
2
Contents
Executive Summary.........................................................................................................................3
Analysis...........................................................................................................................................3
Interpretation....................................................................................................................................4
Conclusion.......................................................................................................................................6
References........................................................................................................................................7
Document Page
3
Executive Summary
The purpose of this report is to evaluate financial economical performance of Westpac
Group to provide recommendations to potential investors on investment in company. The
financial economical analysis is typical based on trend in key financial and non-financial
performance indicators. Financial and non-financial indicators will be selected on the basis of
nature, size and industry type of Westpac Group.
Westpac Group is first bank in Australia and it belongs to one of the major bank among
four major banking companies in Australia. Westpac Group has started its business small range
of banking services and now it provides wide range of banking and wealth management services
to customers, business and institutions (Company Overview, 2019). It has been observed form
many industrial reports on the performance of major banks in Australia that there was declining
trend in profitability performance in year 2018 as compared to 2017. The major competitors in
Australian banking sector are Australia and New Zealand Banking (ANZ), Commonwealth Bank
(CBA), and National Australia Bank (NAB).
Analysis
As per the media release by Westpac in year 2018, it has been nominated as the best bank
in Australia for last four years. The key financial highlights of Westpac Bank during the last five
years as reported in annual reports or financial reports published on web portal of Westpac.
Financial Information
Years 2014 2015 2016 2017 2018
Total Operating Income (in
Millions)
$
19,937.00
$
21,642.00
$
20,985.00
$
21,802.00
$
22,133.00
Net profit attributable to owners
of WBC (In Millions)
$
7,561.00
$
8,012.00
$
7,445.00
$
7,990.00
$
8,095.00
Earnings Per share (EPS)
$
2.46
$
2.55
$
2.24
$
2.33
$
2.32
Dividend per share (DPS)
$
1.82
$
1.87
$
1.88
$
1.88
$
1.88
Dividend payout ratio 74.70% 73.40% 84.20% 79.30% 79.30%
Share Price as 30 September
$
32.14
$
29.70
$
29.51
$
31.92
$
27.93
Net Interest margin ratio (in %) 2.09% 2.09% 2.10% 2.06% 2.13%
Operating exp to income ratio (in
%) 42.90% 43.80% 43.90% 43.30% 43.80%
Return on Equity 15.77% 15.46% 13.19% 13.27% 12.66%
Common equity (Tier 1) capital
ratio (Basel III) 9.00% 9.50% 9.50% 10.60% 10.60%
Document Page
4
P/E Ratio 13.07 11.65 13.17 13.70 12.04
(Annual Report, 2018, Financial Results, 2018 and Five Years Summary, 2018)
It has been observed that profitability performance in year 2018 was not good as
compared to 2017 but Westpac has maintained its position in such a competitive market.
Dividend has been paid regularly and amount of dividend paid is also same during the last three
years. P/E ratio in year 2018 was adversely impacted due to downward shift of share price and
per share earnings as compared to 2017.
Interpretation
Profitability performance of Westpac reflects unstable growth in the company total
operating revenue and it has led to slight decrease in net earnings in year 2018 as compared
previous years. Although net interest margin has increased in year 2018 but it was offset by the
abnormal increase in non-interest expenses and lowered non interest income. Westpac has
maintained constant dividend policy to ensure the maximum returns to shareholders. But holding
period return on investment in shares of Westpac was decreased due to poor market performance
in year 2018 as compared to year 2017 (KPMG, 2018). Specifically there was trend in
profitability performance and market performance, but it was clearly observed that 2018
performance had been bad as compared to 2017. Westpac has been good at cash and capital
management and same has been reflected through its capital ratio. One reason that should be
considered for downward progress of Westpac was the impact on public sentiments due to the
enquiry posted by Royal Commission in relation to misconduct of superannuation and banking
norms (Annual Report, 2018).
(Source: https://www.westpac.com.au/content/dam/public/wbc/documents/pdf/aw/ic/
2018_Westpac_Annual_Report.pdf)
tabler-icon-diamond-filled.svg

Paraphrase This Document

Need a fresh take? Get an instant paraphrase of this document with our AI Paraphraser
Document Page
5
Industry report on major Australian banks for year 2018, has reported FY2018 a
challenging year and it can be seen through the reduced return on equity. Below graph reflects
average of profit before tax as against the return on equity for all major banks. It is clearly seen
return on equity declined despite of slight increase in profit before tax (KPMG, 2018).
(Source: https://home.kpmg/content/dam/kpmg/au/pdf/2018/major-australian-banks-full-year-
2018-results-analysis.pdf)
Westpac make practice of robust governance framework to ensure and keep accountable
for their acts and to promote sustainable business practices. It is equally important to evaluate the
non financial factors to respond on recommendations to investors (Media Releases, 2018).
Increase in customer base, infrastructure and digital customers is must for the
development of Westpac together with positive response from customer is also highly important.
Customer report of Westpac is given below. It is reported that customer base of Westpac has
increased in year 2018 but there was significantly decreased in customer compliments (Five
Years Summary, 2018).
Document Page
6
(Source: https://www.westpac.com.au/content/dam/public/wbc/documents/pdf/aw/ic/
Westpac_2018_Five_Year_Summary.pdf)
PwC has published future banking trends and has mentioned that only those banking
company will survive that integrate their technology with the customer demand and simplify the
business services (PwC, 2019). It is essential to more deeply connected with the customer and
enhances their experience with reliable and easy to use banking services. Business strategy of
Westpac is to use their easy-to-use platform for developing customer relationship and capture the
any market opportunity released (Annual Report, 2018).
Board orientation of Westpac is lean towards to the stakeholders as they work to fulfill
the requirements of all stakeholders instead of focusing on profit maximization of investors. This
strategy will help the company to survive in long run. It has been noted from the annual report
that total target rewards of top executives has been increased from 4% to 12.3% to recognize the
individual capacity and to achieve the desired outcome in future. So, it can be said that
remuneration to top executive plays an important role in driving the performance of Westpac and
to achieve the target goal (Annual Report, 2018).
Conclusion
The interpretation of economic and financial performance of Westpac has helped to reach
on conclusion that this banking company will definitely stay long and prosper in future period. It
will continue to remarks its top position in future years with improved financial performance.
Profitability performance in year 2018 was not as per expectation but it is due to the impact of
proceedings by Royal Commission on violation of banking norms. It is highly expected that
profitability performance will improve in next year and net interest margin will reflects positive
growth. Dividend per share has been kept constant to attract the prospective stakeholders and
retain the existing shareholders to have prospered growth with the banking sector. It is highly
recommended to new investors to make investment in Westpac to earn highest return within
banking sector of Australia.
Document Page
7
References
Annual Report. 2018. Westpac. [Online]. Available at:
https://www.westpac.com.au/content/dam/public/wbc/documents/pdf/aw/ic/
2018_Westpac_Annual_Report.pdf [Accessed on: 3 October, 2019].
Company Overview. 2019. Westpac. [Online]. Available at: https://www.westpac.com.au/about-
westpac/westpac-group/company-overview/ [Accessed on: 3 October, 2019].
Financial Results. 2018. Westpac Group. [Online]. Available at:
https://www.westpac.com.au/content/dam/public/wbc/documents/pdf/aw/ic/
ASX_2018_Full_Year_Profit_Announcement.pdf[Accessed on: 3 October, 2019].
Five Years Summary. 2018. Financial and other information. [Online]. Available at:
https://www.westpac.com.au/content/dam/public/wbc/documents/pdf/aw/ic/
Westpac_2018_Five_Year_Summary.pdf[Accessed on: 3 October, 2019].
KPMG. 2018. Major Australian Banks: Full Year 2018 Results Analysis. [Online]. Available at:
https://home.kpmg/content/dam/kpmg/au/pdf/2018/major-australian-banks-full-year-2018-
results-analysis.pdf[Accessed on: 3 October, 2019].
Media Releases. 2018. Westpac named Best Business Bank in Australia for fourth consecutive
year. [Online]. Available at:
https://www.westpac.com.au/about-westpac/media/media-releases/2018/24-August/[Accessed
on: 3 October, 2019].
PwC. 2019. Banking 2020: the future of banking in Australia. [Online]. Available at:
https://www.pwc.com.au/pdf/pwc_mba_hy16_hot-topic.pdf [Accessed on: 3 October, 2019].
chevron_up_icon
1 out of 7
circle_padding
hide_on_mobile
zoom_out_icon
[object Object]