Report: Financial Performance Analysis of Westpac Banking Corporation
VerifiedAdded on 2020/05/28
|21
|5548
|396
Report
AI Summary
This report presents a comprehensive financial analysis of Westpac Banking Corporation. It begins with an executive summary and introduction, followed by a company overview. The core of the report focuses on the evaluation of Westpac's financial statements, including income statements, cash flow analysis, and balance sheets. Ratio analysis, encompassing profitability, efficiency, liquidity, and solvency ratios, is conducted to assess the company's financial health. Horizontal and vertical analyses provide insights into financial trends and the composition of financial data. The cash conversion cycle is examined to evaluate the company's cash management efficiency. A competitor analysis compares Westpac's performance with the National Bank of Australia. The report concludes with a summary of findings and provides references to the sources used. The analysis reveals that the company's financial performance is better, although the company is required to make few changes into its capital structure to make an optimal capital structure.

Running Head: Finance For Managers 1
Paraphrase This Document
Need a fresh take? Get an instant paraphrase of this document with our AI Paraphraser
Finance For Managers 2
Executive Summary
This report has been prepared to analyze the financial performance of an organization,
Westpac Banking Corporation. In this report, for understanding the financial analysis process
in a better way, financial statements of Westpac Banking Corporation Australia has been
evaluated. Financial statements include income statement, cash flow analysis and balance
sheet. This method assists the organization to make better decision about the profit,
performance and the position of the company.
Finance For Managers 3
Introduction.......................................................................................................................3
Company overview...........................................................................................................3
Financial statements of the company................................................................................3
Ratio analysis................................................................................................................3
Horizontal analysis.......................................................................................................4
Vertical analysis............................................................................................................5
Cash conversion cycle..................................................................................................6
Competitor’s analysis.......................................................................................................6
Conclusion........................................................................................................................6
References.........................................................................................................................8
Appendix.........................................................................................................................10
⊘ This is a preview!⊘
Do you want full access?
Subscribe today to unlock all pages.
Trusted by 1+ million students worldwide
Finance For Managers 4
Introduction:
Analysis over financial reports of a company is a financial analysis process which is
done by the financial analyst, chief financial officers, investors and other stakeholders of the
company to evaluate the financial performance of the company. Financial reports of an
organization include income statement, cash flow analysis and balance sheet. This method
assists the organization to make better decision about the profit, performance and the position
of the company (Warren, Reeve & Duchac, 2011). Further, the analysis over the financial
reports of the company is usually done by the financial analyst to evaluate the changes into
the profits, performance and the position of the company. For understanding the financial
analysis process in a better way, financial statements of Westpac Banking Corporation
Australia has been evaluated.
Company overview:
Westpac Banking Corporation is normally known as Westpac. It is an Australian bank
which offers financial services to its clients. Headquarter of the company is in Westpac place,
Sydney. This bank is one of top 5 largest banks in Australia. Around 13.1 million people are
entertained by this bank and it has the largest branch network in Australia. The total revenue
of the company is continuously increasing and expressing about a better financial position of
the company (Turner & Thayer, 2001). Further, this bank mainly offers the services related to
finance insurance, corporate banking, consumer banking, investment management,
investment banking, credit cards, global wealth management and mortgages.
Financial statements of the company:
Financial statements of an organization include income statement, cash flow analysis
and balance sheet. Financial statement analysis is a process which evaluates about the
financial position of an organization. For this reports, financial statements of Westpac
Banking Corporation has been analyzed. Through the evaluation over the financial statement
of the company, it has been analyzed that the various changes have taken place into the
performance of the company in last 3 years (Dixon and Monk, 2009). The income statement
of the company expresses that the few negative changes have taken place into the profits of
the company in 2016 in context with 2015. Further, the balance sheet and cash flow statement
of the company expresses that the company is performing well in the industry.
Ratio analysis:
Paraphrase This Document
Need a fresh take? Get an instant paraphrase of this document with our AI Paraphraser
Finance For Managers 5
For analyzing the financial statements in a better way, ratio analysis study has been
done. Ratio analysis is one of the method of financial analysis which express about the
various financial positions and the performance of an organization. Various ratios such as
profitability ratios, efficiency ratios, liquidity ratios, solvency ratios etc have been calculated
to reach over a conclusion. Profitability ratios of the company explain that the profit position
of the company is quite good (Weygandt, Kimmel & Kieso, 2009). Net profit margin of the
company is 23.37%, 24.78% and 23.44% in 2016, 2015 and 2014 respectively. It expresses
that the profit margin has been reduced in 2016 but still, it is better. Further, the return on
equity has also been evaluated and it has been found that the net profit of the company has
been reduced in context of equity in 2016.
Further, liquidity ratios have been calculated and the current ratio and quick ratios of
the company has been measured for last 3 years. Current ratios and quick ratios of the
company explain that the bank is required to enhance the level of the current assets in
comparison with current liability to manage the short term debt obligation position. The
position and the performance of the company in terms of managing the current assets and
liabilities are not at all good (Hillier, Grinblatt & Titman, 2011).
Further, the solvency and efficiency position of the company has also been analyzed
to evaluate the performance of the company. Through the calculations, it has been evaluated
that the capital structure position of the company is not competitive (Sadler, 2003). This
company is required to reduce the level of the debt in terms of equity to make optimal capital
structure (Gapenski, 2008). Further, the efficiency ratios of the company expresses that the
company is required to reduce the level of the payment collection period so that the working
capital of the company could be managed in a better way and at the same time, the cost of the
company could also be controlled.
Horizontal analysis:
Further, for analyzing the financial statements of the company, horizontal analysis has
been done. Horizontal analysis explains about the changes in the financial reports of an
organization in context with the last year financial reports. Horizontal analysis is one of the
methods of financial analysis which express about the various changes into the financial
position of an organization (Stratton, SAS Institute Inc., 2009). Further, it also explains that
the changes are in the favour of the company or not. It is helpful for the company to analyze
with competitive companies as well.
Finance For Managers 6
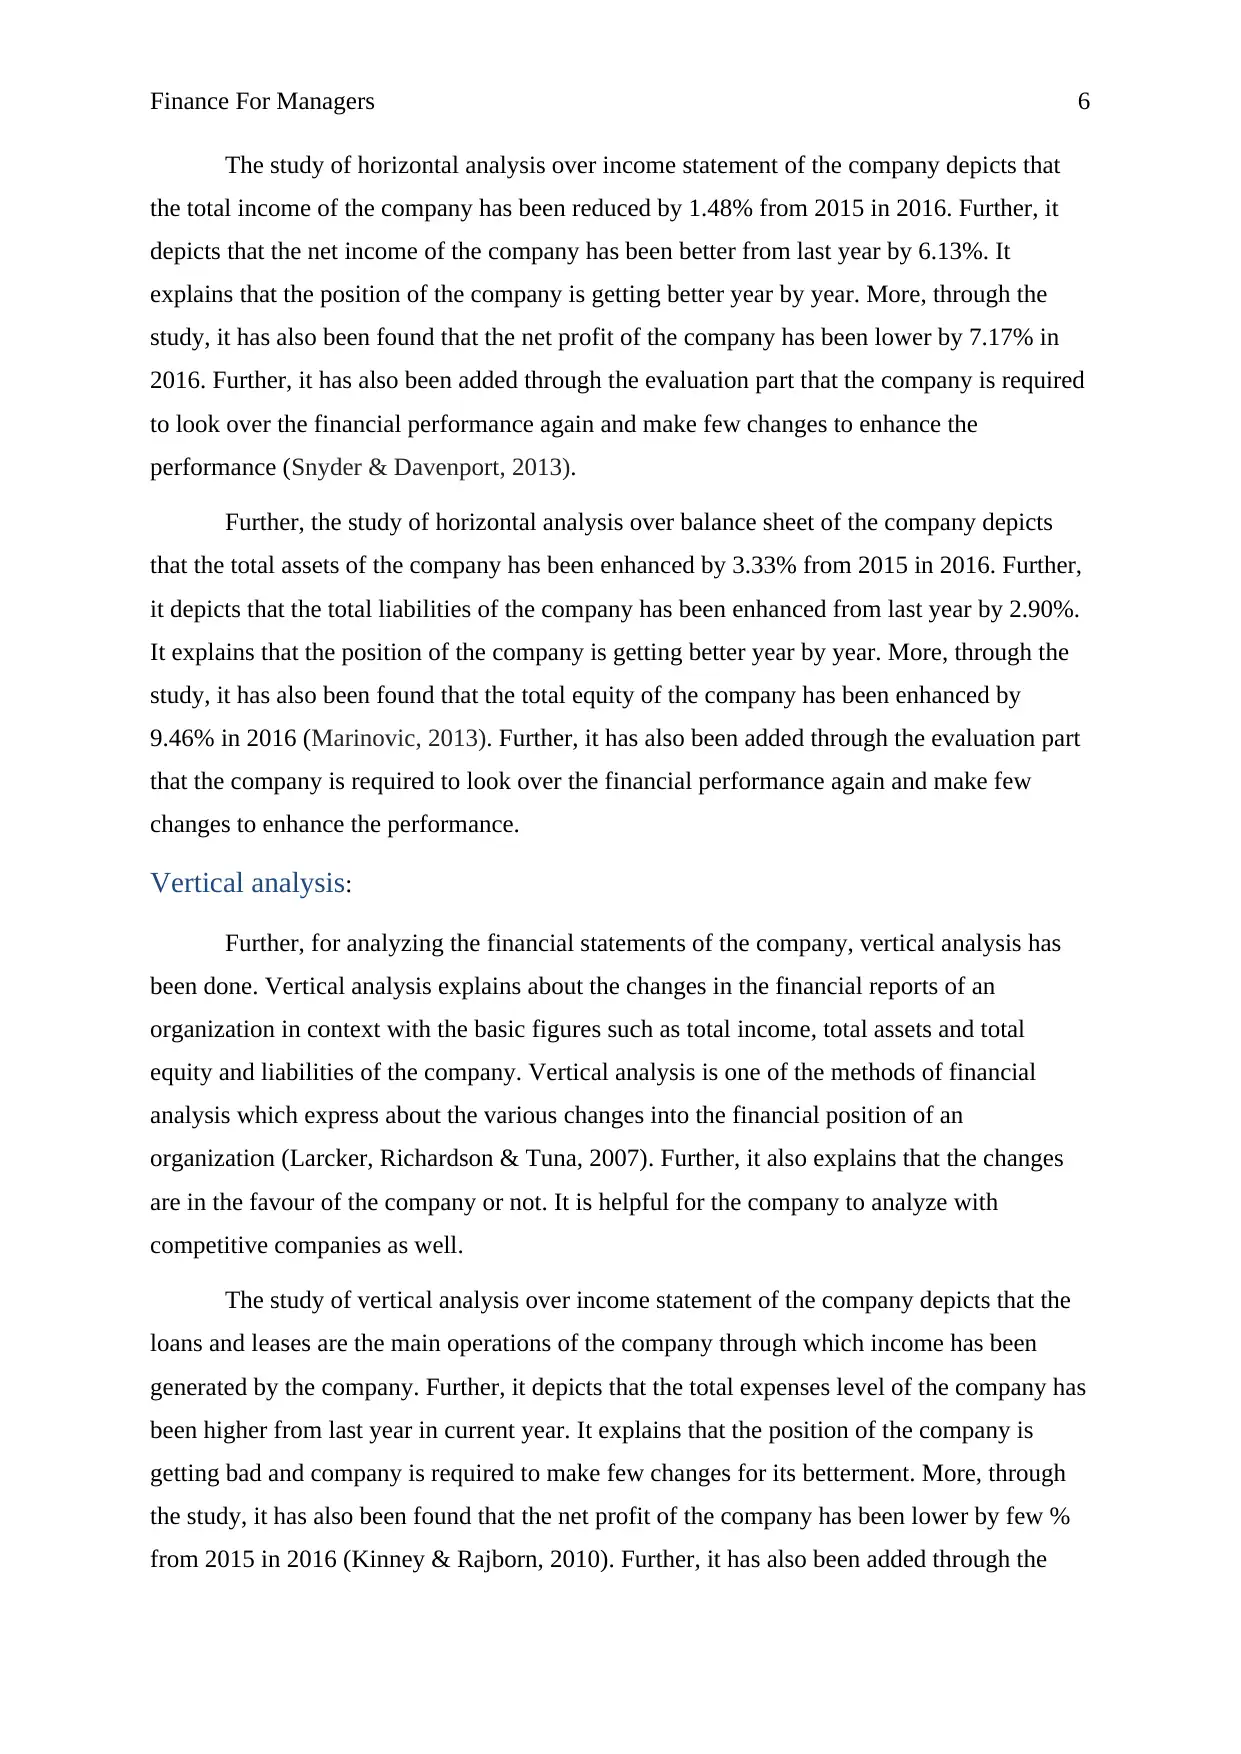
The study of horizontal analysis over income statement of the company depicts that
the total income of the company has been reduced by 1.48% from 2015 in 2016. Further, it
depicts that the net income of the company has been better from last year by 6.13%. It
explains that the position of the company is getting better year by year. More, through the
study, it has also been found that the net profit of the company has been lower by 7.17% in
2016. Further, it has also been added through the evaluation part that the company is required
to look over the financial performance again and make few changes to enhance the
performance (Snyder & Davenport, 2013).
Further, the study of horizontal analysis over balance sheet of the company depicts
that the total assets of the company has been enhanced by 3.33% from 2015 in 2016. Further,
it depicts that the total liabilities of the company has been enhanced from last year by 2.90%.
It explains that the position of the company is getting better year by year. More, through the
study, it has also been found that the total equity of the company has been enhanced by
9.46% in 2016 (Marinovic, 2013). Further, it has also been added through the evaluation part
that the company is required to look over the financial performance again and make few
changes to enhance the performance.
Vertical analysis:
Further, for analyzing the financial statements of the company, vertical analysis has
been done. Vertical analysis explains about the changes in the financial reports of an
organization in context with the basic figures such as total income, total assets and total
equity and liabilities of the company. Vertical analysis is one of the methods of financial
analysis which express about the various changes into the financial position of an
organization (Larcker, Richardson & Tuna, 2007). Further, it also explains that the changes
are in the favour of the company or not. It is helpful for the company to analyze with
competitive companies as well.
The study of vertical analysis over income statement of the company depicts that the
loans and leases are the main operations of the company through which income has been
generated by the company. Further, it depicts that the total expenses level of the company has
been higher from last year in current year. It explains that the position of the company is
getting bad and company is required to make few changes for its betterment. More, through
the study, it has also been found that the net profit of the company has been lower by few %
from 2015 in 2016 (Kinney & Rajborn, 2010). Further, it has also been added through the
⊘ This is a preview!⊘
Do you want full access?
Subscribe today to unlock all pages.
Trusted by 1+ million students worldwide
Finance For Managers 7
evaluation part that the company is required to look over the financial performance again and
make few changes to enhance the performance.
Further, the study of vertical analysis over balance sheet of the company depicts that
the loans are the main assets of the company which has huge part of assets of the company.
Further, it depicts that the total liabilities of the company is almost similar with the total
liabilities of 2015. It explains that the position of the company is almost similar in current
year in comparison of last 2 years. More, through the study, it has also been found that the
total equity of the company is also similar in 2016, 2015 and 2014 (Jiashu, 2009). Further, it
has also been added through the evaluation part that the company is required to look over the
financial performance again and make few changes to enhance the performance.
Cash conversion cycle:
Cash conversion cycle explains about the total cash position of the company. Through
the analysis over cash conversion cycle of the company, it has been analyzed that the
company is suggested to reduce the days of receivable collection days and the patent days are
quite competitive of the company. It would help the company to carry the business with
lower working capital (Kieso, Weygandt & Warfield, 2010).
Competitor’s analysis:
Further, the financial performance of Westpac Banking Corporation has been
analyzed in context with the financial performance of its competitive company, national bank
of Australia. Through the study over the national bank of Australia, it has been found that the
performance of Westpac Banking Corporation is quite better than the performance of
National bank of Australia. National bank of Australia’s profit position is quite lower than the
Westpac Banking Corporation (Weygandt, Kimmel & Kieso, 2015). Further, it has also been
found that the growth rate of Westpac Banking Corporation is quite higher. Thus, through
this analysis, it has been found that this company is suggested to look over few positive
policies of National Bank of Australia to manage the performance and the position of the
company. Further, it has also been found that the Westpac Banking Corporation is
performing way better than the performance of national bank of Australia.
Conclusion:
To conclude, this company is performing very well in the market. The financial
analysis of the company explains that the financial performance of the company is quite
Paraphrase This Document
Need a fresh take? Get an instant paraphrase of this document with our AI Paraphraser

Finance For Managers 8
better in last year’s. The changes have been evaluated into the financial statements of the
company and it has been found that the position of the company is quite better. Though, the
ratio analysis expresses that the company is required to make few changes into its capital
structure to make an optimal capitals structure. Further, it has also been found that the current
assets must be enhanced by the company to maintain the liquidity position and lastly, the
efficiency position of the company is better. Thus the financial performance 0of the company
is way better.
Finance For Managers 9
References:
Dixon, A.D. and Monk, A.H., (2009). The power of finance: accounting harmonization's
effect on pension provision. Journal of Economic Geography, 9(5), pp.619-639.
Gapenski, L.C., (2008). Healthcare finance: an introduction to accounting and financial
management. Health Administration Press.
Hillier, D., Grinblatt, M. and Titman, S., (2011). Financial markets and corporate strategy.
McGraw Hill.
Jiashu, G., (2009). Study on Fair Value Accounting——on the essential characteristics of
financial accounting [J]. Accounting Research, 5, p.003.
Kieso, D. E., Weygandt, J. J., & Warfield, T. D. (2010). Intermediate accounting: IFRS
edition (Vol. 2). John Wiley & Sons.
Kinney M. & Rajborn C. (2010). Cost Accounting: Foundation and Evolution. Cengage
Learning.
Larcker, D.F., Richardson, S.A. & Tuna, I., (2007). Corporate governance, accounting
outcomes, and organizational performance. The Accounting Review, 82(4), pp.963-
1008.
Marinovic, I. (2013). Internal control system, earnings quality, and the dynamics of financial
reporting. The RAND Journal of Economics, 44(1), 145-167.
Sadler P. (2003). Strategic Management. Kogan Page Ltd.
Snyder, H. & Davenport, E., (2013). What does it really cost? Allocating indirect costs. Asian
Libraries.
Stratton, A.J., SAS Institute Inc., (2009). Systems and methods for costing reciprocal
relationships. U.S. Patent 7,634,431.
Turner J. & Thayer J. (2001). Introduction to Analysis of Variance: Design, analysis &
Interpretation. SAGE.
Warren C., Reeve J. & Duchac J. (2011). Financial and Managerail Accounting. Cengage
Learning.
⊘ This is a preview!⊘
Do you want full access?
Subscribe today to unlock all pages.
Trusted by 1+ million students worldwide

Finance For Managers 10
Weygandt J., Kimmel P., Kieso D. (2009). Managerial Accounting:Tools for business
decision making. John Wiley & sons.
Weygandt, J. J., Kimmel, P. D., & Kieso, D. E. (2015). Financial & Managerial Accounting.
John Wiley & Sons.
Weygandt J., Kimmel P., Kieso D. (2009). Managerial Accounting:Tools for business
decision making. John Wiley & sons.
Weygandt, J. J., Kimmel, P. D., & Kieso, D. E. (2015). Financial & Managerial Accounting.
John Wiley & Sons.
Paraphrase This Document
Need a fresh take? Get an instant paraphrase of this document with our AI Paraphraser
Finance For Managers 11
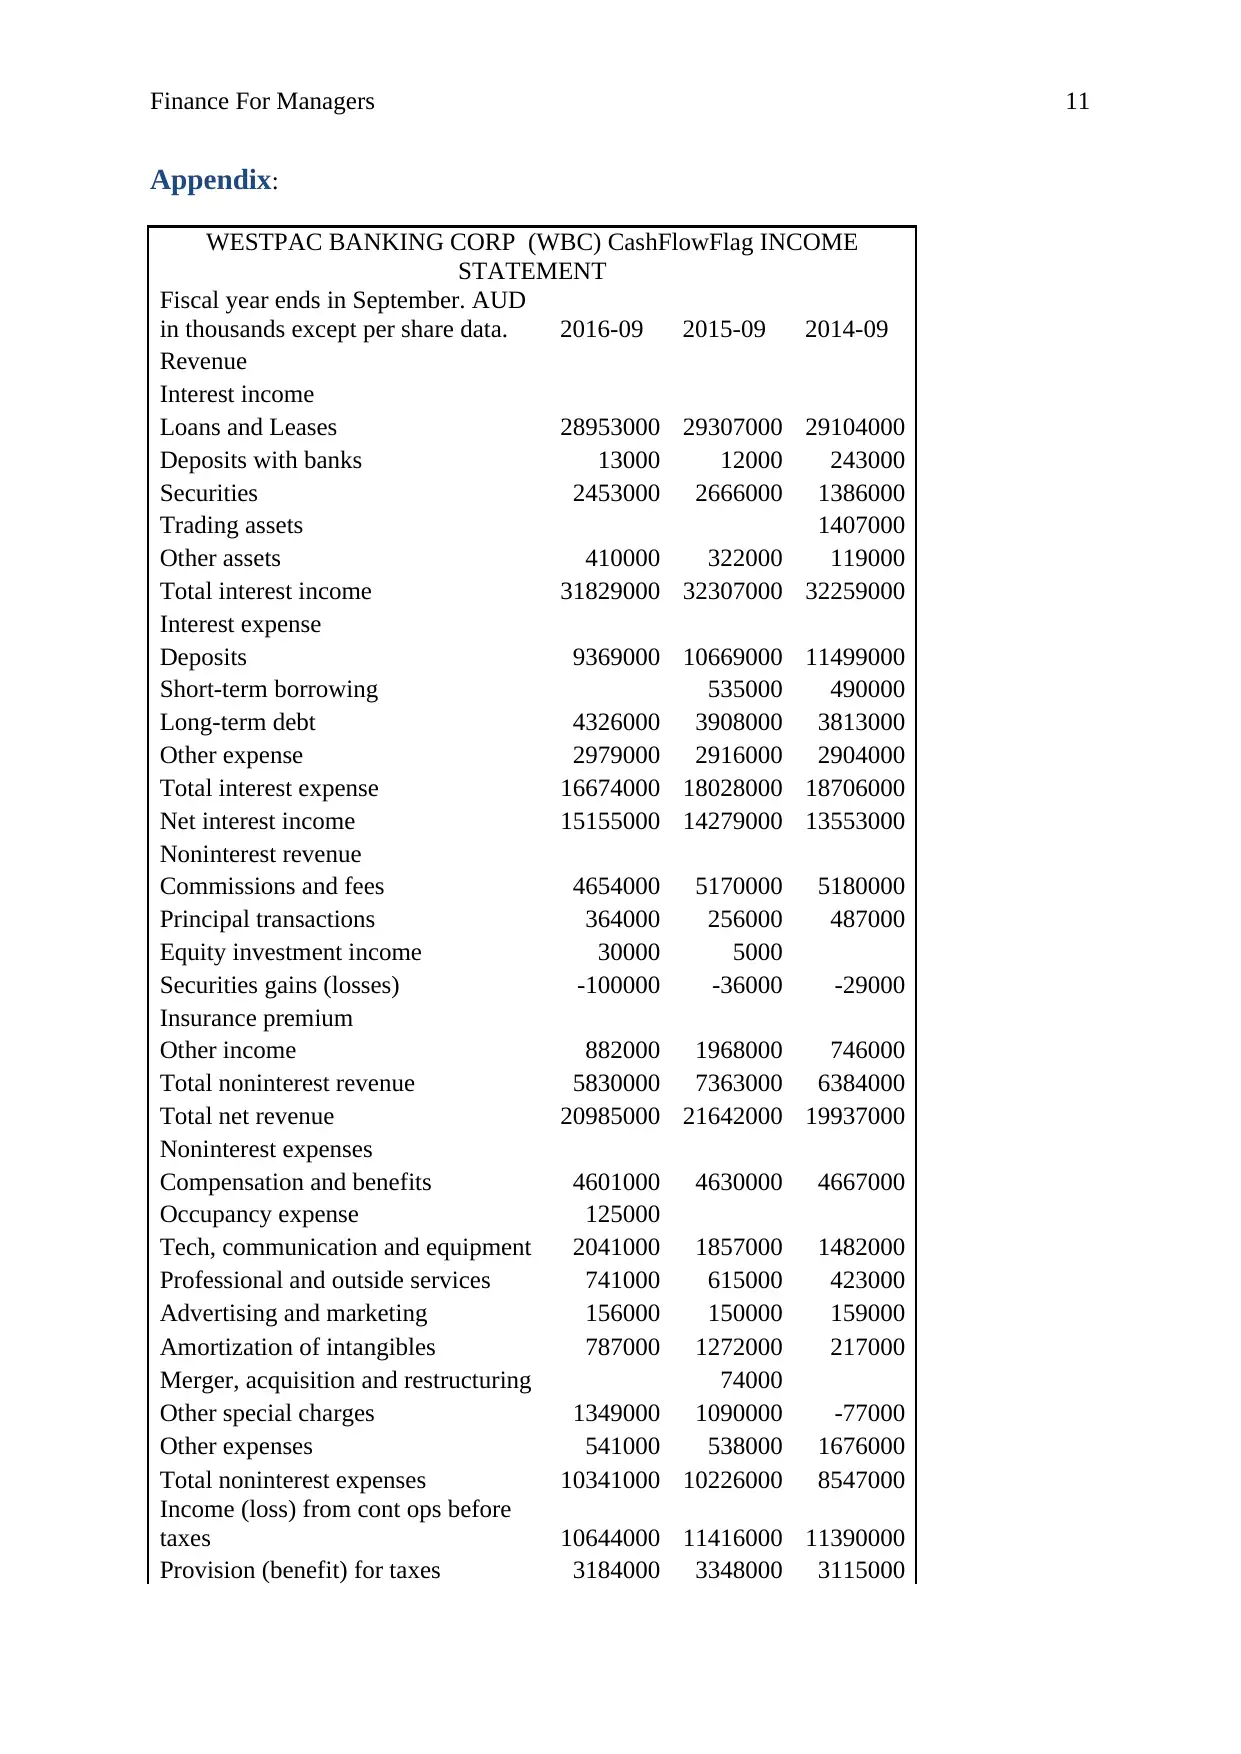
Appendix:
WESTPAC BANKING CORP (WBC) CashFlowFlag INCOME
STATEMENT
Fiscal year ends in September. AUD
in thousands except per share data. 2016-09 2015-09 2014-09
Revenue
Interest income
Loans and Leases 28953000 29307000 29104000
Deposits with banks 13000 12000 243000
Securities 2453000 2666000 1386000
Trading assets 1407000
Other assets 410000 322000 119000
Total interest income 31829000 32307000 32259000
Interest expense
Deposits 9369000 10669000 11499000
Short-term borrowing 535000 490000
Long-term debt 4326000 3908000 3813000
Other expense 2979000 2916000 2904000
Total interest expense 16674000 18028000 18706000
Net interest income 15155000 14279000 13553000
Noninterest revenue
Commissions and fees 4654000 5170000 5180000
Principal transactions 364000 256000 487000
Equity investment income 30000 5000
Securities gains (losses) -100000 -36000 -29000
Insurance premium
Other income 882000 1968000 746000
Total noninterest revenue 5830000 7363000 6384000
Total net revenue 20985000 21642000 19937000
Noninterest expenses
Compensation and benefits 4601000 4630000 4667000
Occupancy expense 125000
Tech, communication and equipment 2041000 1857000 1482000
Professional and outside services 741000 615000 423000
Advertising and marketing 156000 150000 159000
Amortization of intangibles 787000 1272000 217000
Merger, acquisition and restructuring 74000
Other special charges 1349000 1090000 -77000
Other expenses 541000 538000 1676000
Total noninterest expenses 10341000 10226000 8547000
Income (loss) from cont ops before
taxes 10644000 11416000 11390000
Provision (benefit) for taxes 3184000 3348000 3115000
Finance For Managers 12
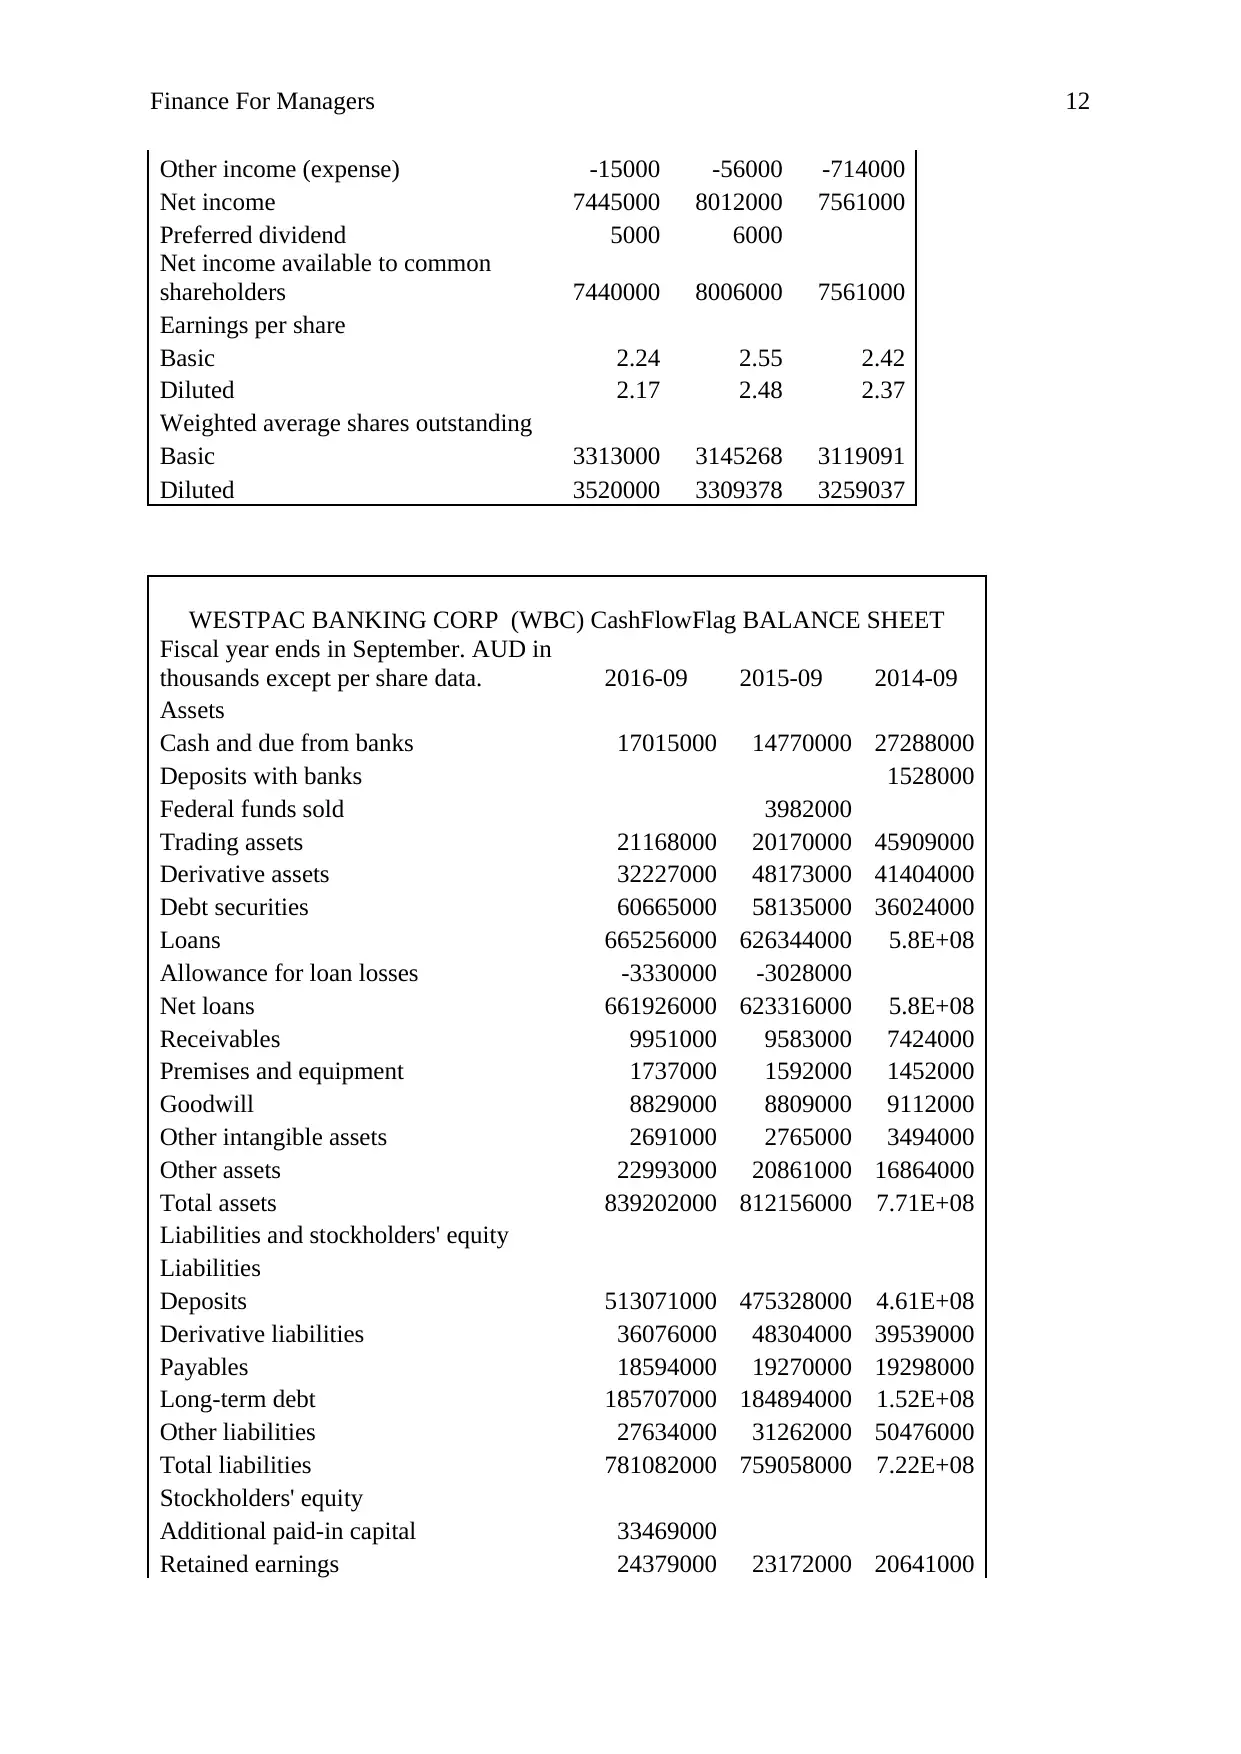
Other income (expense) -15000 -56000 -714000
Net income 7445000 8012000 7561000
Preferred dividend 5000 6000
Net income available to common
shareholders 7440000 8006000 7561000
Earnings per share
Basic 2.24 2.55 2.42
Diluted 2.17 2.48 2.37
Weighted average shares outstanding
Basic 3313000 3145268 3119091
Diluted 3520000 3309378 3259037
WESTPAC BANKING CORP (WBC) CashFlowFlag BALANCE SHEET
Fiscal year ends in September. AUD in
thousands except per share data. 2016-09 2015-09 2014-09
Assets
Cash and due from banks 17015000 14770000 27288000
Deposits with banks 1528000
Federal funds sold 3982000
Trading assets 21168000 20170000 45909000
Derivative assets 32227000 48173000 41404000
Debt securities 60665000 58135000 36024000
Loans 665256000 626344000 5.8E+08
Allowance for loan losses -3330000 -3028000
Net loans 661926000 623316000 5.8E+08
Receivables 9951000 9583000 7424000
Premises and equipment 1737000 1592000 1452000
Goodwill 8829000 8809000 9112000
Other intangible assets 2691000 2765000 3494000
Other assets 22993000 20861000 16864000
Total assets 839202000 812156000 7.71E+08
Liabilities and stockholders' equity
Liabilities
Deposits 513071000 475328000 4.61E+08
Derivative liabilities 36076000 48304000 39539000
Payables 18594000 19270000 19298000
Long-term debt 185707000 184894000 1.52E+08
Other liabilities 27634000 31262000 50476000
Total liabilities 781082000 759058000 7.22E+08
Stockholders' equity
Additional paid-in capital 33469000
Retained earnings 24379000 23172000 20641000
⊘ This is a preview!⊘
Do you want full access?
Subscribe today to unlock all pages.
Trusted by 1+ million students worldwide
1 out of 21
Related Documents


Your All-in-One AI-Powered Toolkit for Academic Success.
+13062052269
info@desklib.com
Available 24*7 on WhatsApp / Email
![[object Object]](/_next/static/media/star-bottom.7253800d.svg)
Unlock your academic potential
Copyright © 2020–2026 A2Z Services. All Rights Reserved. Developed and managed by ZUCOL.