HA1020 Accounting Principles: Westpac Financial Ratio Analysis Report
VerifiedAdded on 2022/11/24
|15
|1297
|437
Report
AI Summary
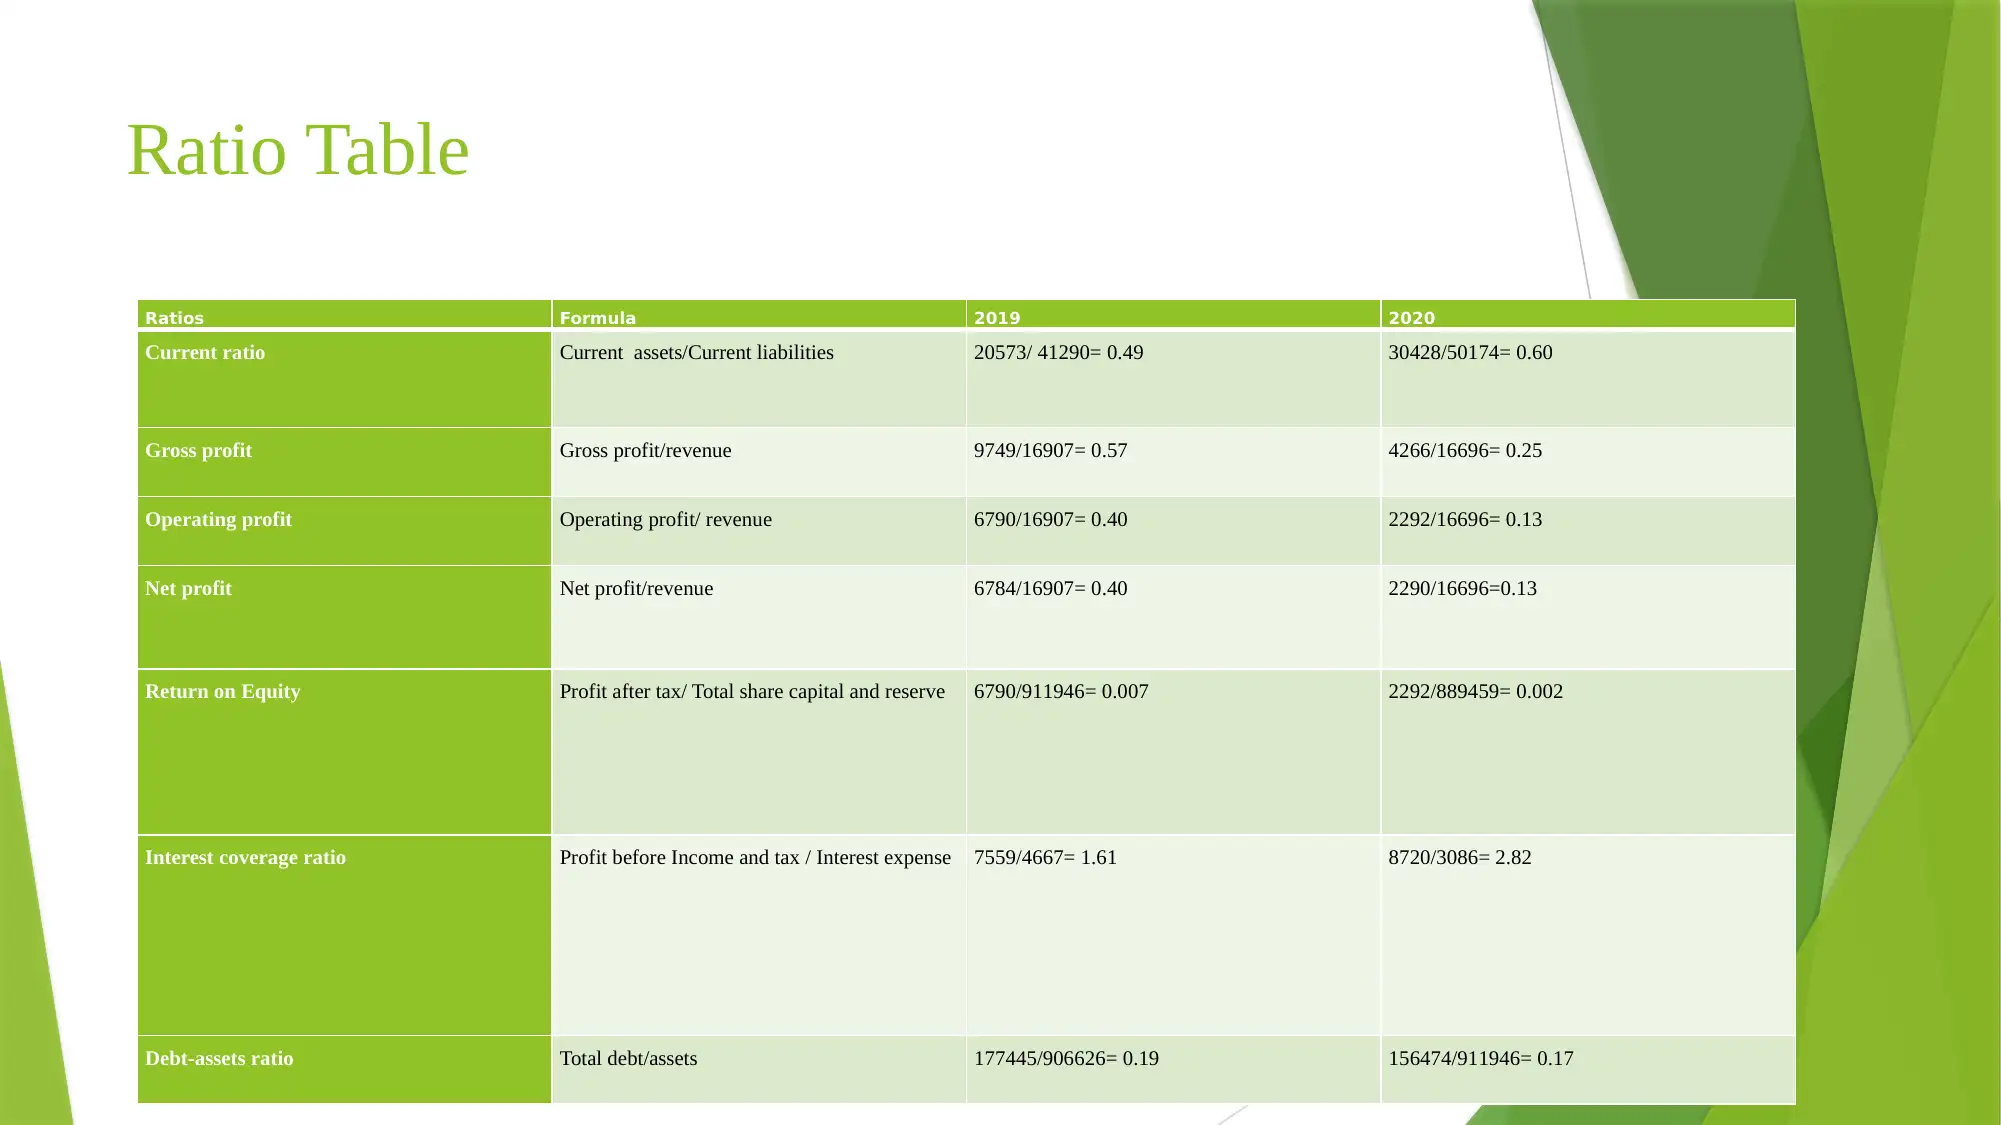
This report presents a financial ratio analysis of Westpac Banking Corporation, evaluating its performance using data from 2019 and 2020. The analysis includes calculations and interpretations of key financial ratios, such as current ratio, gross profit ratio, operating profit ratio, net profit ratio, return on equity, interest coverage ratio, and debt-to-assets ratio. The report assesses Westpac's liquidity, profitability, and solvency, highlighting trends and providing insights into its financial health. The study concludes that while Westpac demonstrates strength in liquidity and solvency, there's a need to improve profitability by controlling operational expenses. The report references relevant academic sources and provides a comprehensive overview of Westpac's financial position.

FINANCIAL RATIO ANALYSIS-
WESTPAC
WESTPAC
Paraphrase This Document
Need a fresh take? Get an instant paraphrase of this document with our AI Paraphraser

Company Background
Westpac is the first Australian Bank and the oldest company there.
It is one of the major banking organisations in Australia and one of largest banks in
New Zealand It was established in 1817 as Bank of New South Wales and the name got
changed to Westpac Banking Corporation later on.
The banking industry names Westpac as one of the leading banks worldwide.
The products which Westpac deals in is wide range of banking and financial services
which include service to customer, other businesses and wealth management solutions.
There is portfolio of financial service brand and business for various institutional
investors.

FINANCIAL RATIOS
The ratio analysis concerns with many financial aspects of the organisation and serves as
a referral for both management and investors to judge the financial performance of the
organisation comparing with previous years and signals where the organisation needs
improvement.
Following are the ratios which tell about the Bank’s financial position:
⊘ This is a preview!⊘
Do you want full access?
Subscribe today to unlock all pages.

Trusted by 1+ million students worldwide

Ratio Table
Ratios Formula 2019 2020
Current ratio Current assets/Current liabilities 20573/ 41290= 0.49 30428/50174= 0.60
Gross profit Gross profit/revenue 9749/16907= 0.57 4266/16696= 0.25
Operating profit Operating profit/ revenue 6790/16907= 0.40 2292/16696= 0.13
Net profit Net profit/revenue 6784/16907= 0.40 2290/16696=0.13
Return on Equity Profit after tax/ Total share capital and reserve 6790/911946= 0.007 2292/889459= 0.002
Interest coverage ratio Profit before Income and tax / Interest expense 7559/4667= 1.61 8720/3086= 2.82
Debt-assets ratio Total debt/assets 177445/906626= 0.19 156474/911946= 0.17
Paraphrase This Document
Need a fresh take? Get an instant paraphrase of this document with our AI Paraphraser

Liquidity ratios
They tell about the liquidity for cash in the company.
It is necessary for shareholders to know how much liquidity company holds to pay off the liabilities
and to them their dividends.
Example of liquidity ratio
Current ratio
This ratio depicts current assets divided by current liabilities.
It speaks about the liquidity possessed by the company.
It tells about how quickly company can pay off the current liabilities and ideal ratio is 1:1.
The current ratio is a metric that determines whether or not a business has sufficient working capital
to continue operating.

Continued
A current ratio of less than three shows that resources are being used to their maximum capacity. It's part of the liquidity
ratios category, which measures a company's capital assets and liabilities.
It demonstrates if a company can meet short-term obligations within a year, as well as how to leverage existing assets to
repay current liabilities and loans, resulting in increased net working capital.
Current assets must be utilised or sold within a year to keep the business running properly.
Cash, cash equivalents, account receivables, inventory, marketable securities, and other financial instruments are among
them.
Short-term loans, accounts payables, and notes payable, among other commitments, must be paid off within a year.
The ratio has increased in 2020 which signals liquidity of the company has increased. This ratio is important from
perspective of Bank as the liquidity is prominent factor in Bank.
⊘ This is a preview!⊘
Do you want full access?
Subscribe today to unlock all pages.

Trusted by 1+ million students worldwide

Profitability ratios
They speak about the efficiency of the company to make profit out of the revenues.
Examples of profitability ratios:
Gross profit ratio
This is the gross margin which is calculated over revenue.
Gross profit margin is calculated using revenue less cost of goods sold divided by revenue.
It's used to assess a company's financial health by calculating how much money is left
over after all products have been purchased.
It's also used to determine how successfully a company manages its operating expenses.
The calculation shows gross profit has declined from the previous year.
Paraphrase This Document
Need a fresh take? Get an instant paraphrase of this document with our AI Paraphraser

Continued
Operating profit ratio
This shows how much the organisation is able to control over the operating expenses.
The calculation shows that operating profit has declined for the bank as gross profit has decreased.
This also signifies the operational expenses have to be decreased.
Net profit ratio
The profit earned as a percentage of revenue is known as net profit.
It shows the profitability of a company's profits.
It demonstrates a company's capacity to keep costs under control while earning revenue.
It is recognised as an important instrument for business evaluation, as well as a beneficial tool for investors
to determine if a company is successful in turning revenues into profit.
It's easy to compare to competitors because it's expressed as a percentage.

Continued
The net profit margin is calculated by dividing net profits by overall sales revenue.
It is a statistic for measuring the profitability of a business.
This margin should also be double-checked by investors.
It's a number that measures a firm's ability to profit from total revenue.
This indicates the profit bank received after deduction all interest expenses and taxes.
It is also known as bottom line for the company and is watched by the investors.
The calculation reflects that net profit has declined from the previous year.
The Bank has to increase its profit by improving efficiency in operations and cutting
down on operational costs.
⊘ This is a preview!⊘
Do you want full access?
Subscribe today to unlock all pages.

Trusted by 1+ million students worldwide

Continued
Return on Equity
Return on equity is calculated as profit after tax divided by total shareholder’s equity and
reserves.
Return on equity is a prominent ratio which is provided to shareholders.
The ratio has decreased in the year 2020 because of less of profit earned.
Return on Equity
Return on equity is calculated as profit after tax divided by total shareholder’s equity and
reserves.
Return on equity is a prominent ratio which is provided to shareholders.
The ratio has decreased in the year 2020 because of less of profit earned.
Paraphrase This Document
Need a fresh take? Get an instant paraphrase of this document with our AI Paraphraser

Solvency ratios
As per name suggests, this indicates the solvency of the company.
Following are the ratios which give insight in the solvency of the organisation.
Interest coverage ratio
Interest coverage ratio is calculated as Profit before Income and tax divided by Interest expense
This ratio measures the number of times organisation can cover its interest payments with
earnings present.
It can be seen that the interest coverage ratio has increased for the company in calculation.

Continued
Debt to assets ratio
The ratio is calculated as debt divided by assets.
It can be seen that the ratio has declined which means debt has declined in comparison to
assets which is a good sign of leverage.
The more company works on equity shall mean less of debt and thus increasing the
solvency of the company.
⊘ This is a preview!⊘
Do you want full access?
Subscribe today to unlock all pages.

Trusted by 1+ million students worldwide
1 out of 15
Related Documents

Your All-in-One AI-Powered Toolkit for Academic Success.
+13062052269
info@desklib.com
Available 24*7 on WhatsApp / Email
Unlock your academic potential
Copyright © 2020–2025 A2Z Services. All Rights Reserved. Developed and managed by ZUCOL.