Strategic Management Accounting: Financial Analysis of Westpac
VerifiedAdded on 2023/06/12
|8
|1224
|311
Report
AI Summary
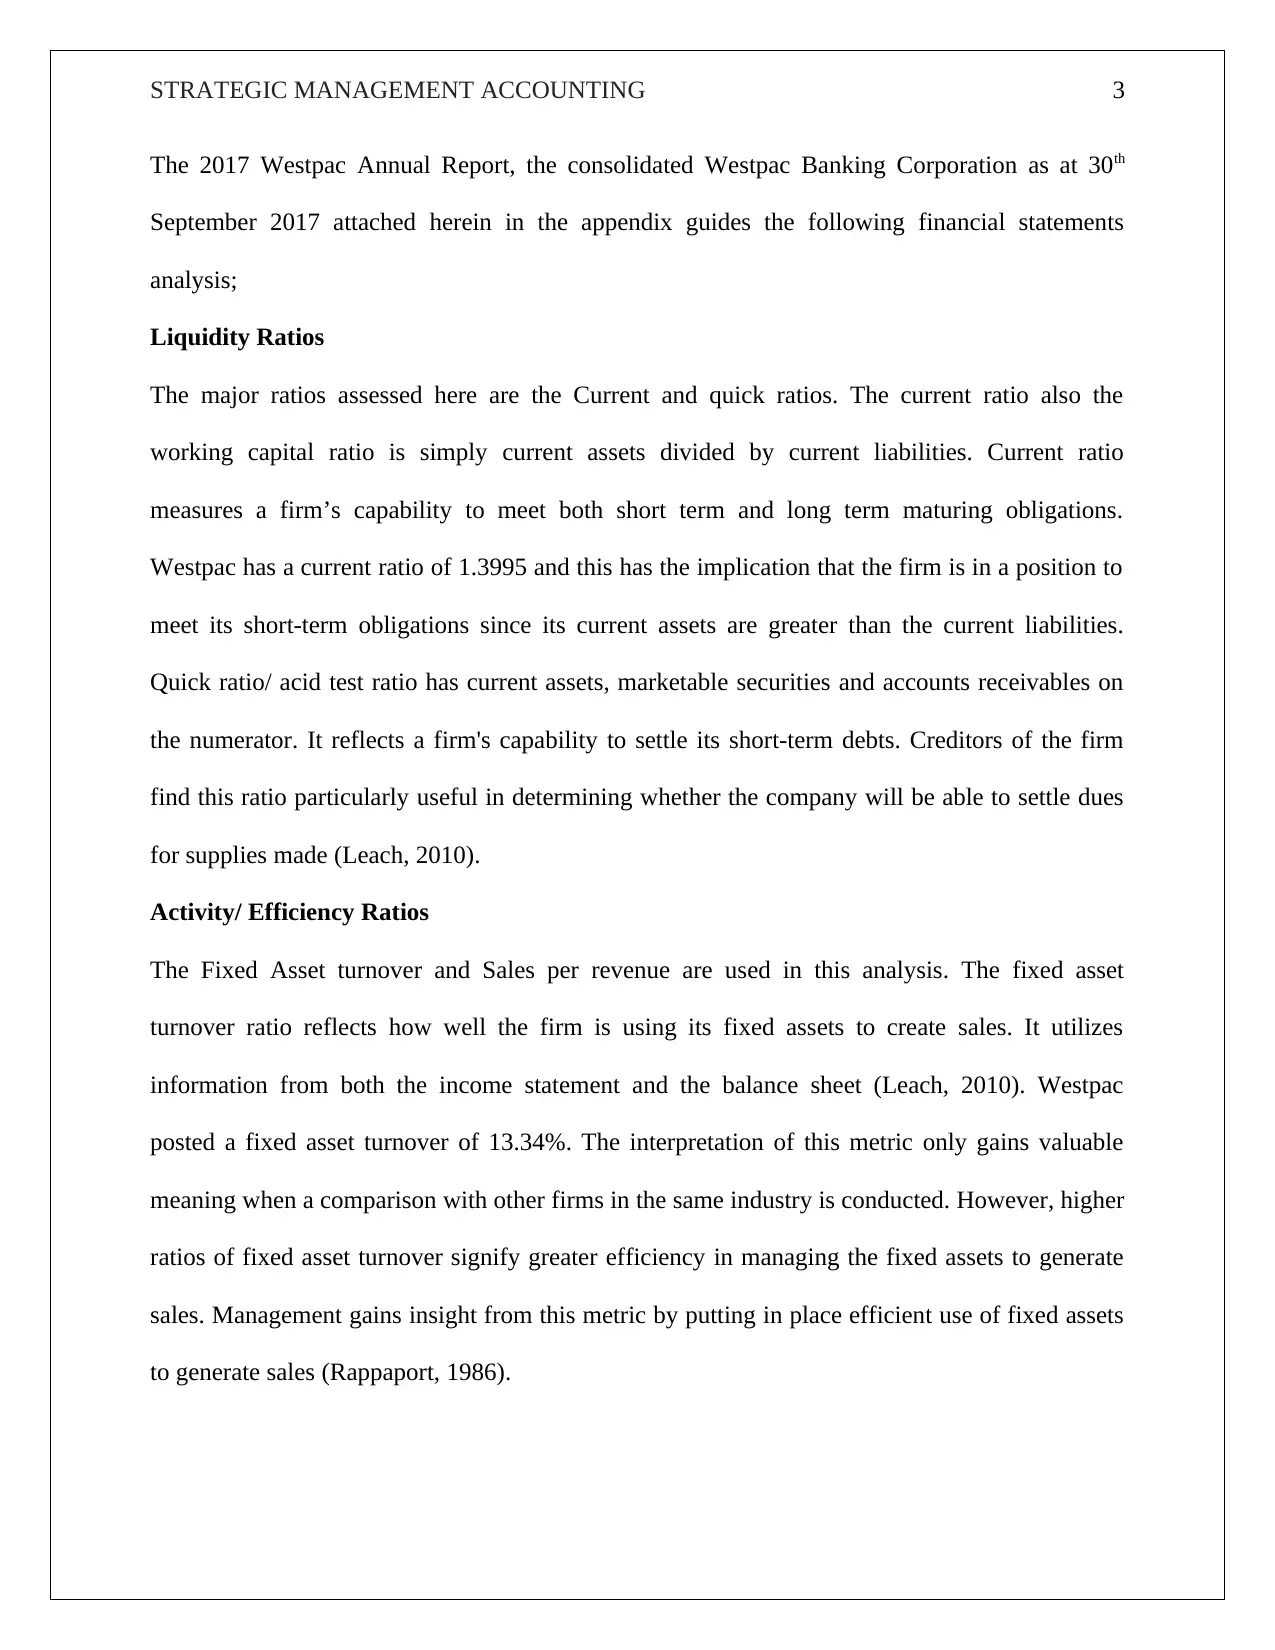
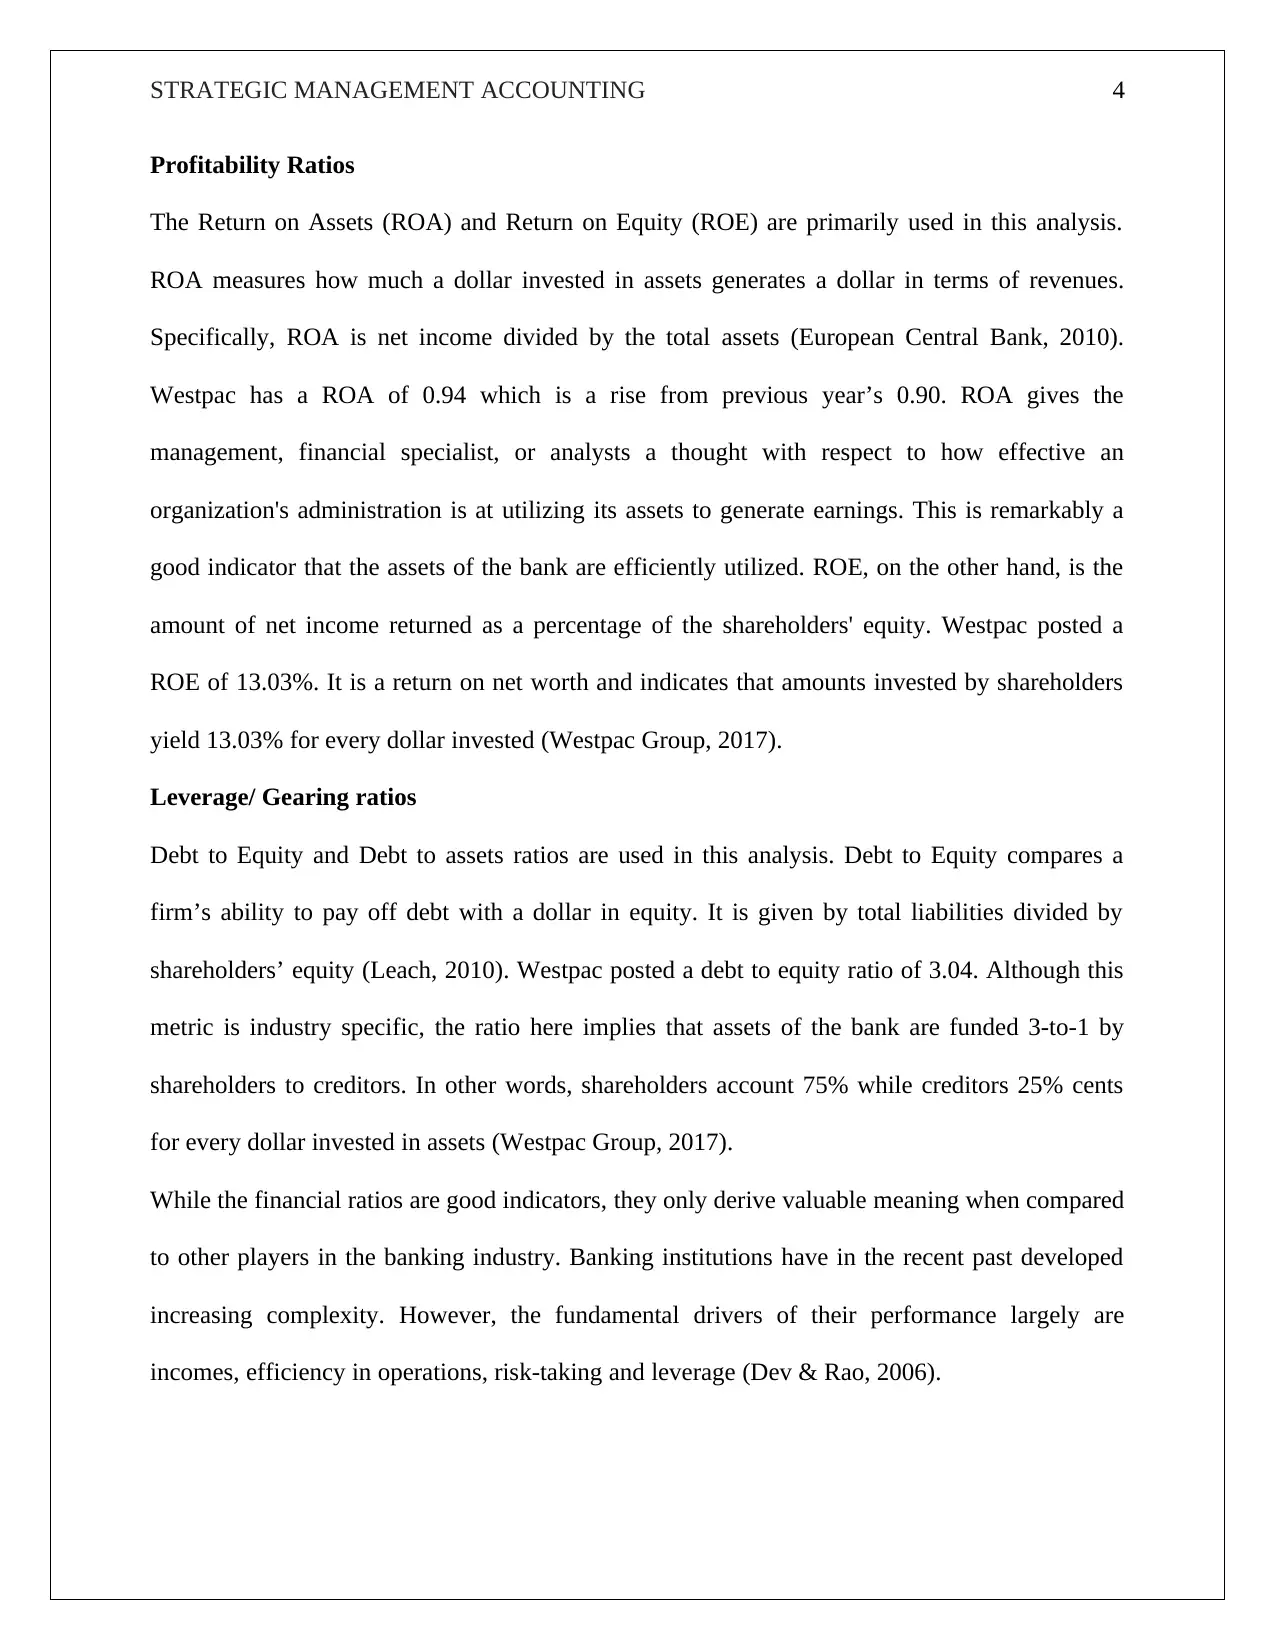
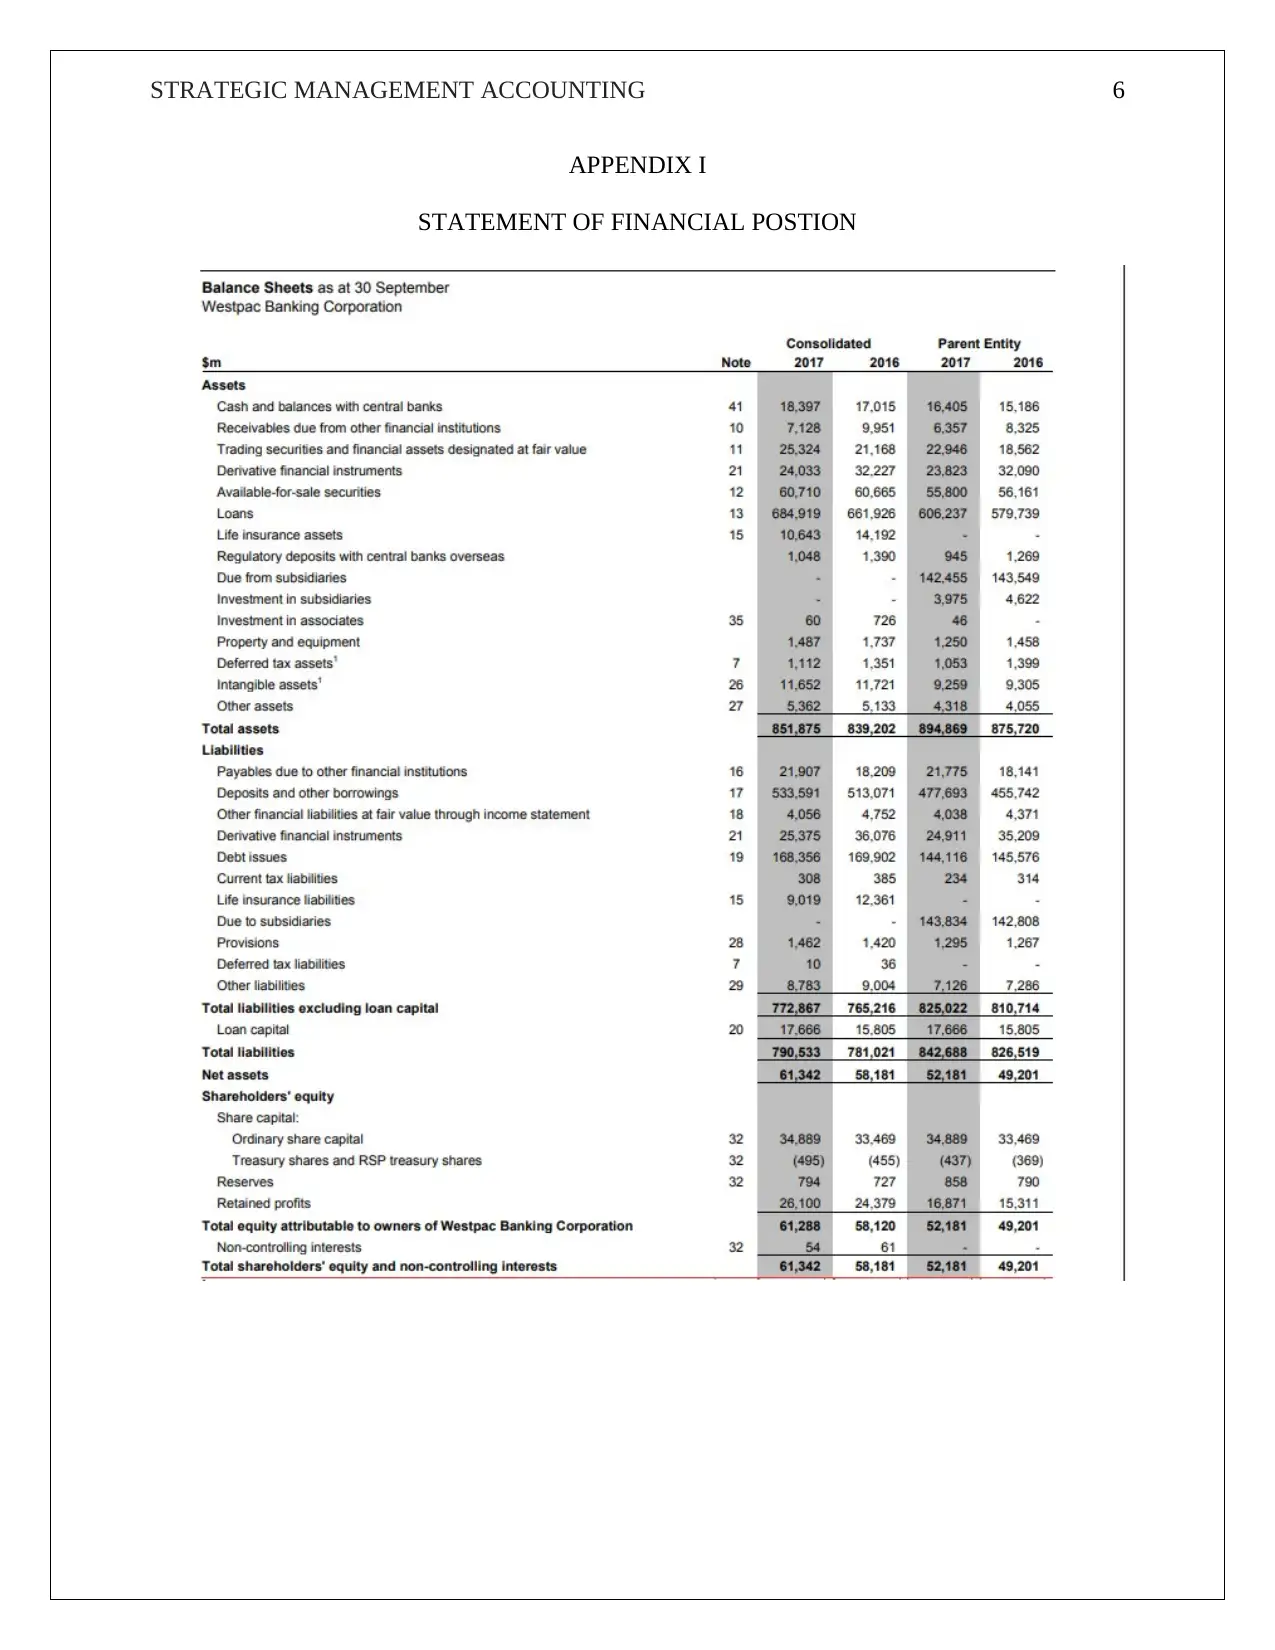
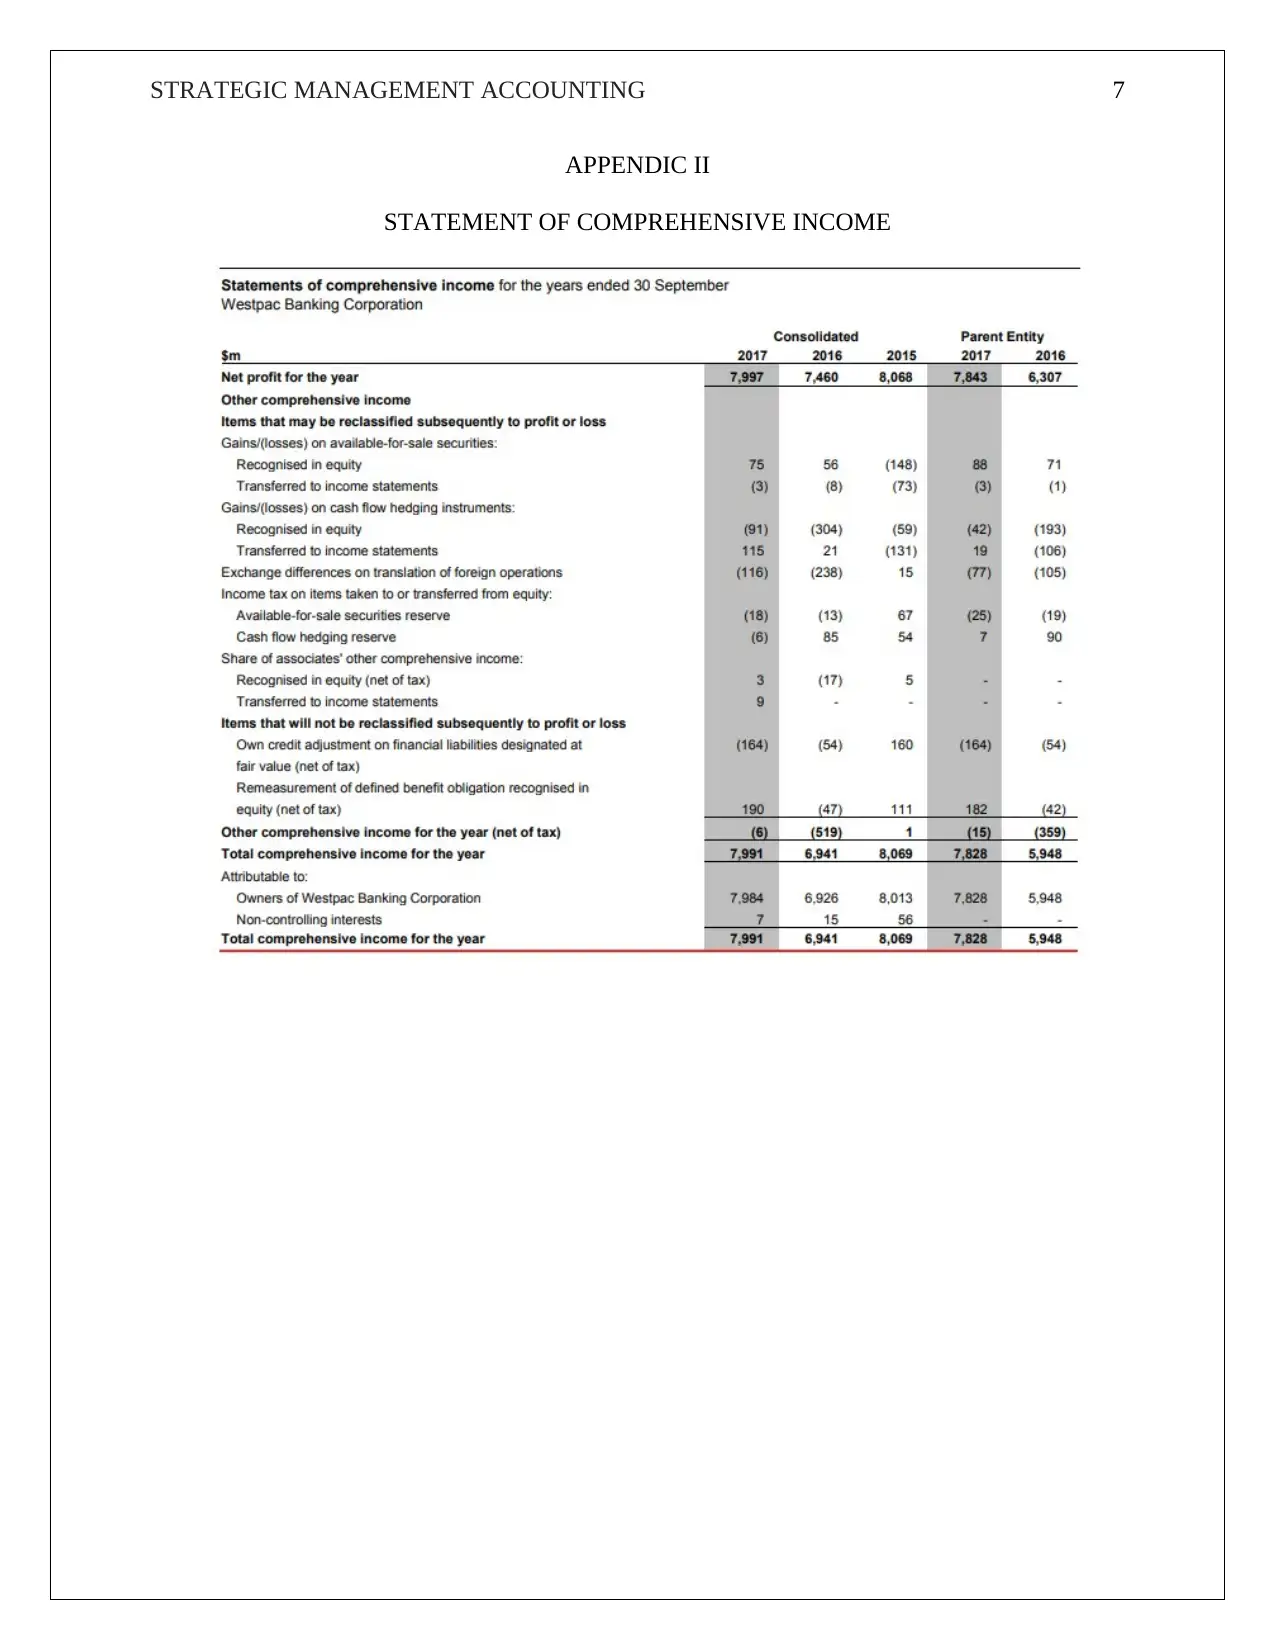
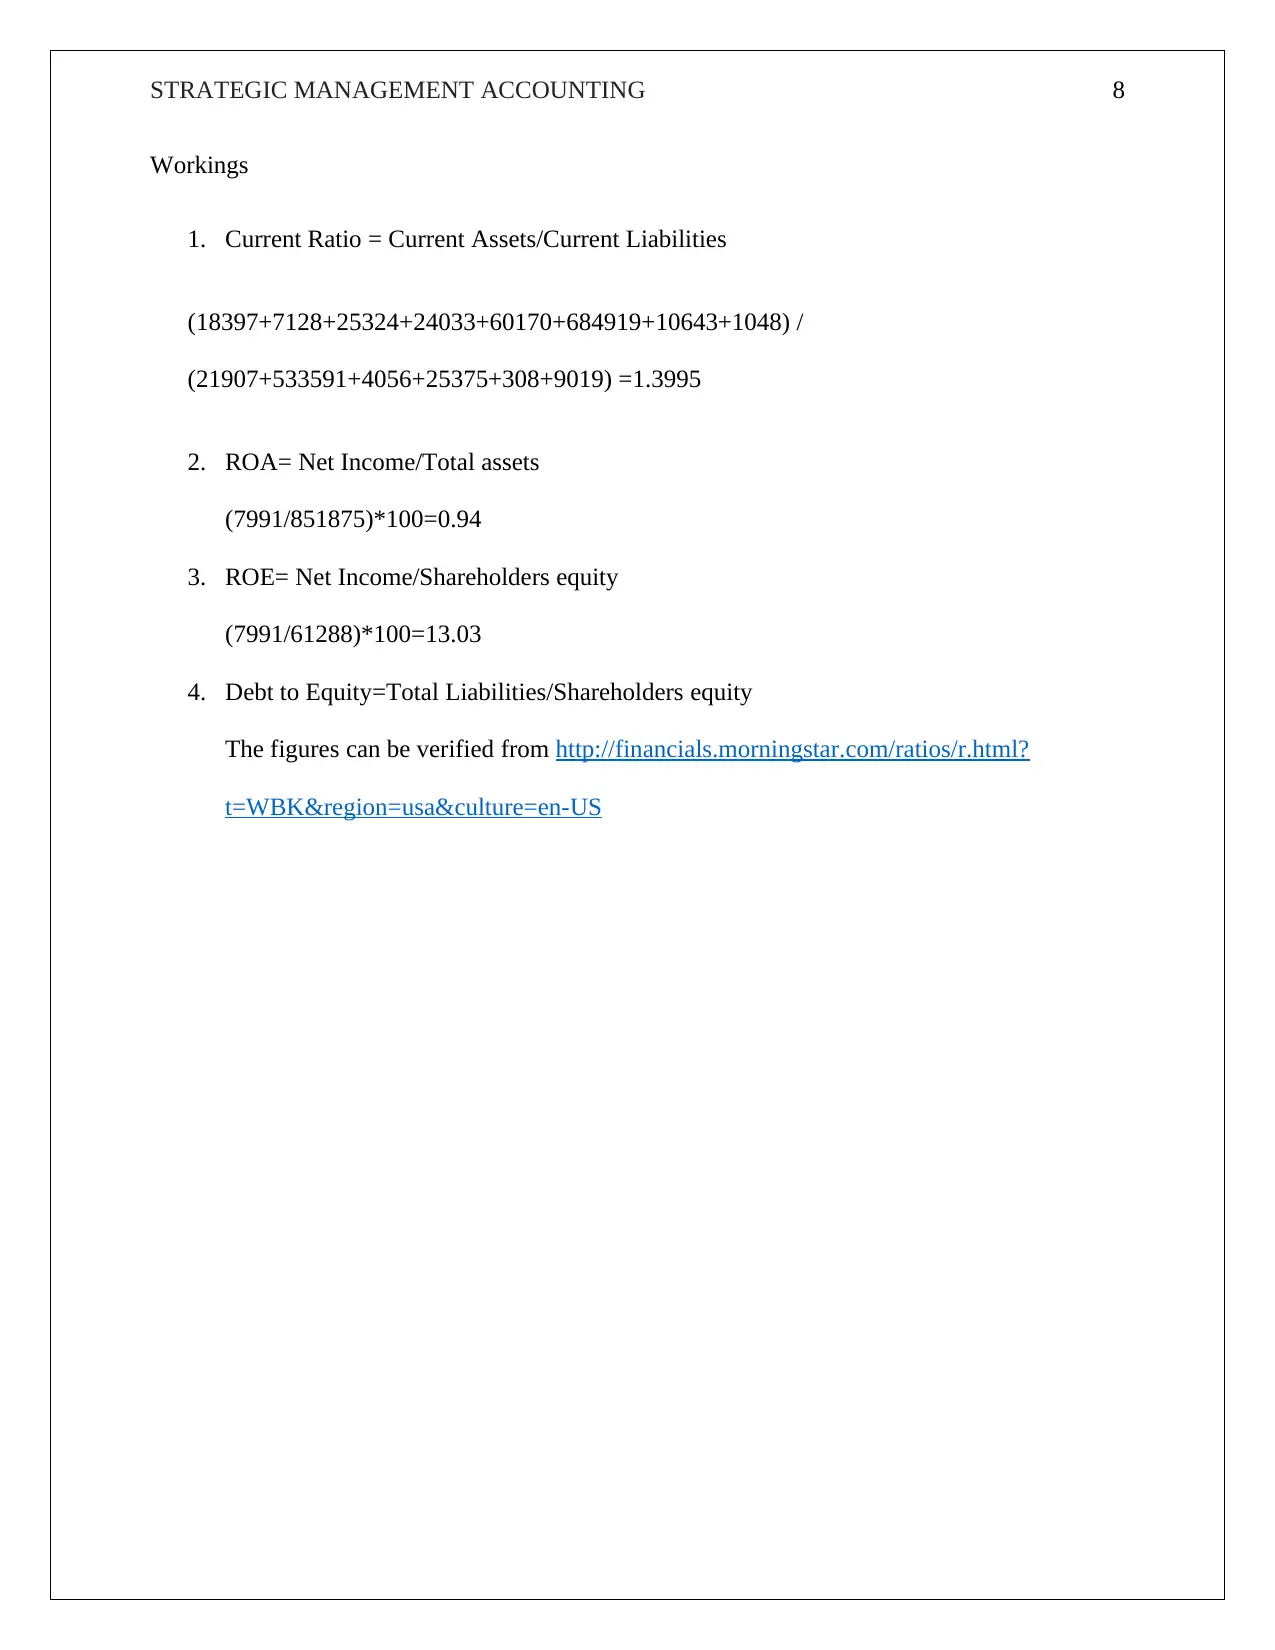
This report provides a comprehensive financial performance evaluation of Westpac Banking Corporation using strategic management accounting principles. It assesses liquidity, activity, profitability, and leverage ratios derived from Westpac's 2017 annual report, including the current ratio, ROA, ROE, and debt-to-equity ratio. The analysis interprets these ratios to provide insights into Westpac's ability to meet obligations, efficiently utilize assets, generate returns for shareholders, and manage debt. The report also emphasizes the importance of comparing these ratios with industry peers to gain a more meaningful understanding of Westpac's financial standing and strategic effectiveness. Financial statements are provided from the annual report with calculations to support the findings.

Running head: STRATEGIC MANAGEMENT ACCOUNTING 1
STRATEGIC MANAGEMENT ACCOUNTING
Institution
Student
Course
Date
STRATEGIC MANAGEMENT ACCOUNTING
Institution
Student
Course
Date
Paraphrase This Document
Need a fresh take? Get an instant paraphrase of this document with our AI Paraphraser

STRATEGIC MANAGEMENT ACCOUNTING 2
3. Evaluate the performance of the company (you can use financial and management
accounting information). NB Performance can be assessed from the perspective of different
stakeholders.
Evaluating financial performance involves the process of quantifying the outcomes of a
company’s policies and operations in monetary terms. Other texts present financial performance
as a subjective measure of efficiently a firm utilizes its assets to create revenues. The term’s
broad approach encompasses the view that it is the measure of a firm’s overall financial health
over a given time frame. Financial statements analysis is the most objective method to evaluate
the financial performance of a given company. The analysis involves assessing a variety of
financial ratios which are principally used as tools for financial analysis. They include
profitability ratios, leverage or gearing ratios, activity ratios and liquidity ratios (Dev & Rao,
2006). They all seek to measure the financial performance of a company under different areas of
interest. Every company is comprised of a number of stakeholders; the management, customers,
creditors, employees, investors, the government and general public among others who all attach a
specific interest in following and tracking that particular company’s performance.
Information that is used in financial statements analysis is derived from the company’s annual
report. All public companies are required by law to publish and provide this document to its
stakeholders containing therein audited, signed, accurate and reliable financial statements to
inform their decision making. The major financial statements required in this analysis are the;
Statement of Comprehensive Income (Income Statement), Cash Flow Statements, and the
Statement of Financial Position or the Balance Sheet (Ittelson, 2011).

STRATEGIC MANAGEMENT ACCOUNTING 3
The 2017 Westpac Annual Report, the consolidated Westpac Banking Corporation as at 30th
September 2017 attached herein in the appendix guides the following financial statements
analysis;
Liquidity Ratios
The major ratios assessed here are the Current and quick ratios. The current ratio also the
working capital ratio is simply current assets divided by current liabilities. Current ratio
measures a firm’s capability to meet both short term and long term maturing obligations.
Westpac has a current ratio of 1.3995 and this has the implication that the firm is in a position to
meet its short-term obligations since its current assets are greater than the current liabilities.
Quick ratio/ acid test ratio has current assets, marketable securities and accounts receivables on
the numerator. It reflects a firm's capability to settle its short-term debts. Creditors of the firm
find this ratio particularly useful in determining whether the company will be able to settle dues
for supplies made (Leach, 2010).
Activity/ Efficiency Ratios
The Fixed Asset turnover and Sales per revenue are used in this analysis. The fixed asset
turnover ratio reflects how well the firm is using its fixed assets to create sales. It utilizes
information from both the income statement and the balance sheet (Leach, 2010). Westpac
posted a fixed asset turnover of 13.34%. The interpretation of this metric only gains valuable
meaning when a comparison with other firms in the same industry is conducted. However, higher
ratios of fixed asset turnover signify greater efficiency in managing the fixed assets to generate
sales. Management gains insight from this metric by putting in place efficient use of fixed assets
to generate sales (Rappaport, 1986).
⊘ This is a preview!⊘
Do you want full access?
Subscribe today to unlock all pages.

Trusted by 1+ million students worldwide

STRATEGIC MANAGEMENT ACCOUNTING 4
Profitability Ratios
The Return on Assets (ROA) and Return on Equity (ROE) are primarily used in this analysis.
ROA measures how much a dollar invested in assets generates a dollar in terms of revenues.
Specifically, ROA is net income divided by the total assets (European Central Bank, 2010).
Westpac has a ROA of 0.94 which is a rise from previous year’s 0.90. ROA gives the
management, financial specialist, or analysts a thought with respect to how effective an
organization's administration is at utilizing its assets to generate earnings. This is remarkably a
good indicator that the assets of the bank are efficiently utilized. ROE, on the other hand, is the
amount of net income returned as a percentage of the shareholders' equity. Westpac posted a
ROE of 13.03%. It is a return on net worth and indicates that amounts invested by shareholders
yield 13.03% for every dollar invested (Westpac Group, 2017).
Leverage/ Gearing ratios
Debt to Equity and Debt to assets ratios are used in this analysis. Debt to Equity compares a
firm’s ability to pay off debt with a dollar in equity. It is given by total liabilities divided by
shareholders’ equity (Leach, 2010). Westpac posted a debt to equity ratio of 3.04. Although this
metric is industry specific, the ratio here implies that assets of the bank are funded 3-to-1 by
shareholders to creditors. In other words, shareholders account 75% while creditors 25% cents
for every dollar invested in assets (Westpac Group, 2017).
While the financial ratios are good indicators, they only derive valuable meaning when compared
to other players in the banking industry. Banking institutions have in the recent past developed
increasing complexity. However, the fundamental drivers of their performance largely are
incomes, efficiency in operations, risk-taking and leverage (Dev & Rao, 2006).
Paraphrase This Document
Need a fresh take? Get an instant paraphrase of this document with our AI Paraphraser

STRATEGIC MANAGEMENT ACCOUNTING 5
REFERENCES
Dev, A. & Rao, V., 2006. Performance Measurement in Financial Institutions in an ERM
framework; A Practitioner Guide. New Delhi: McGraw Hill.
European Central Bank, 2010. Beyond ROE- How to Measure Bank Performance, Frankfurt:
UCB.
Ittelson, T. R., 2011. Financial Statements: A step-by-step Guide to Understanding and Creating
Financial Reports. 2 ed. New Jersey: Career Press Inc.
Leach, R., 2010. Ratios Made Simple: A beginner's guide to the key financial Ratios paperback.
London: Harriman House.
Rappaport, A., 1986. Creating Shareholder Value. New York: The Free Press.
Westpac Group, 2017. Westpac bank Annual Report, Sydney: Westpac Group.

STRATEGIC MANAGEMENT ACCOUNTING 6
APPENDIX I
STATEMENT OF FINANCIAL POSTION
APPENDIX I
STATEMENT OF FINANCIAL POSTION
⊘ This is a preview!⊘
Do you want full access?
Subscribe today to unlock all pages.

Trusted by 1+ million students worldwide

STRATEGIC MANAGEMENT ACCOUNTING 7
APPENDIC II
STATEMENT OF COMPREHENSIVE INCOME
APPENDIC II
STATEMENT OF COMPREHENSIVE INCOME
Paraphrase This Document
Need a fresh take? Get an instant paraphrase of this document with our AI Paraphraser

STRATEGIC MANAGEMENT ACCOUNTING 8
Workings
1. Current Ratio = Current Assets/Current Liabilities
(18397+7128+25324+24033+60170+684919+10643+1048) /
(21907+533591+4056+25375+308+9019) =1.3995
2. ROA= Net Income/Total assets
(7991/851875)*100=0.94
3. ROE= Net Income/Shareholders equity
(7991/61288)*100=13.03
4. Debt to Equity=Total Liabilities/Shareholders equity
The figures can be verified from http://financials.morningstar.com/ratios/r.html?
t=WBK®ion=usa&culture=en-US
1 out of 8