Data Driven Decisions for Business: WFTT Company Analysis Report
VerifiedAdded on 2023/06/18
|14
|3533
|257
Report
AI Summary
This report delves into the importance of data-driven decision-making for businesses, particularly focusing on the impact of marketing campaigns on sales performance. Using data analysis techniques such as graphical and grouping analysis, the report evaluates the sales volume of 'Wood from the Trees' (WFTT) company over three years to determine the effectiveness of their marketing campaign in the UK market. The analysis covers various product segments like bracelets and rings, identifying trends and fluctuations in sales. The report highlights the benefits of data analysis, including informed business decisions and increased customer satisfaction, and recommends strategies for WFTT to optimize their marketing efforts based on the insights gained from the data. The report concludes by emphasizing the need for continuous data analysis to adapt to market dynamics and improve overall business performance. Desklib provides access to this and many other solved assignments.
Data Driven Decisions for
Business
Business
Paraphrase This Document
Need a fresh take? Get an instant paraphrase of this document with our AI Paraphraser
TABLE OF CONTENTS
INTRODUCTION...........................................................................................................................2
Key changes and trends that are leading importance of data analysis.........................................2
Justification of analytical approach, used for business analysis..................................................3
DATA ANALYSIS..........................................................................................................................4
Steps of cleaning data..................................................................................................................4
Relevant analytical techniques for data analysis.........................................................................4
Recommendations to Wood from the trees company regarding data analysis techniques..........7
CONCLUSION................................................................................................................................9
REFERENCES..............................................................................................................................10
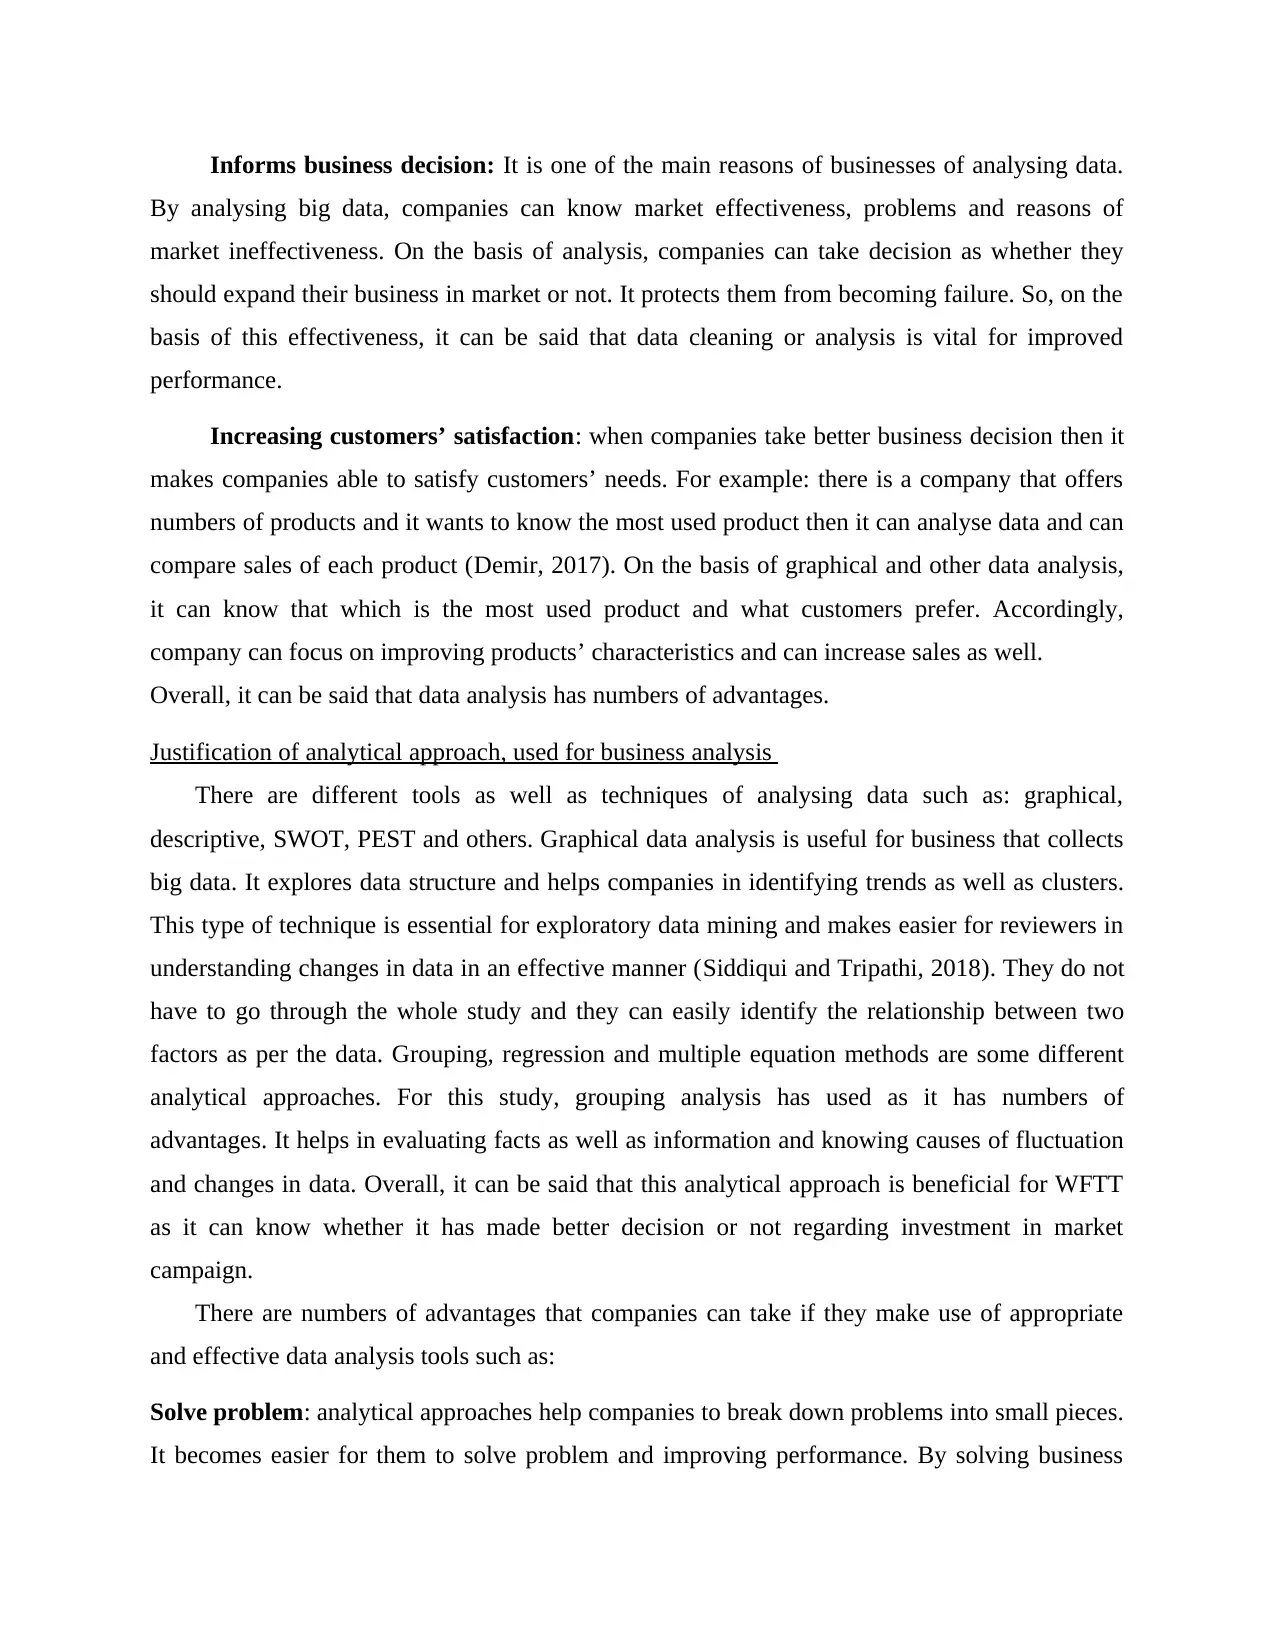
INTRODUCTION
Data driven decision is a process or way of making decision on the basis of facts, metrics
and data (Ma and et.al., 2020). Decision making regarding business plays a vital role as it helps
in improving performance and it can be improved when data are being analysed with appropriate
analysis method. This study is going to discuss impact of marketing campaign on sales and for
knowing effectiveness, data of sales volume of 3 years will be analysed. It can help out in
comparing sales volume and knowing effectiveness of market. It will further discuss some
reasons and key trends that lead importance of analysing data by businesses.
Key changes and trends that are leading importance of data analysis
In regard to data analysis, it can be said that it has became important for businesses as
businesses find easier in making decision on the basis of analysis. Competition is increasing day
by day and companies of all sectors are striving hard for being in the competition. There are
some trends and changes have happened that has lead importance of data analysis. By knowing
trends, importance of data analysis can also be known that can help WFTT company in knowing
effectiveness of its decision of investing in marketing campaign.
Automation: In regard to success of businesses in this modern or digital world, it can be
said that data quality is the main key. But due to increasing competition it becomes complex to
analyse big data. So, companies are trying to automate the process of data as it can save their
time. Automation of data is the main change that has happened in this modern world and it is
increasing importance of analysing big data and making decision (Malgieri and Comandé, 2017).
Automation frees up the analyst to focus on high value add activities. Some industries have made
themselves beneficial with this key trend and change.
Users’ experience: Users’ experience is getting recognition from business to business
organizations. Internet has changed the world and people have knowledge about using smart
phones and apps with convenient features. Users prefer easier interaction and some automation
platforms are satisfying their needs. Users find easier in practicing good data storytelling. So, on
the basis of this trend, it can be said that users’ experience and great knowledge is increasing
importance of data analysis (Hsu and Chen, 2018).
Along with these trends and changes, some advantages can be known of data analysis that
is leading importance. All these advantages can help out in knowing as why companies are
focusing more on analysing and cleaning data.
⊘ This is a preview!⊘
Do you want full access?
Subscribe today to unlock all pages.
Trusted by 1+ million students worldwide
Informs business decision: It is one of the main reasons of businesses of analysing data.
By analysing big data, companies can know market effectiveness, problems and reasons of
market ineffectiveness. On the basis of analysis, companies can take decision as whether they
should expand their business in market or not. It protects them from becoming failure. So, on the
basis of this effectiveness, it can be said that data cleaning or analysis is vital for improved
performance.
Increasing customers’ satisfaction: when companies take better business decision then it
makes companies able to satisfy customers’ needs. For example: there is a company that offers
numbers of products and it wants to know the most used product then it can analyse data and can
compare sales of each product (Demir, 2017). On the basis of graphical and other data analysis,
it can know that which is the most used product and what customers prefer. Accordingly,
company can focus on improving products’ characteristics and can increase sales as well.
Overall, it can be said that data analysis has numbers of advantages.
Justification of analytical approach, used for business analysis
There are different tools as well as techniques of analysing data such as: graphical,
descriptive, SWOT, PEST and others. Graphical data analysis is useful for business that collects
big data. It explores data structure and helps companies in identifying trends as well as clusters.
This type of technique is essential for exploratory data mining and makes easier for reviewers in
understanding changes in data in an effective manner (Siddiqui and Tripathi, 2018). They do not
have to go through the whole study and they can easily identify the relationship between two
factors as per the data. Grouping, regression and multiple equation methods are some different
analytical approaches. For this study, grouping analysis has used as it has numbers of
advantages. It helps in evaluating facts as well as information and knowing causes of fluctuation
and changes in data. Overall, it can be said that this analytical approach is beneficial for WFTT
as it can know whether it has made better decision or not regarding investment in market
campaign.
There are numbers of advantages that companies can take if they make use of appropriate
and effective data analysis tools such as:
Solve problem: analytical approaches help companies to break down problems into small pieces.
It becomes easier for them to solve problem and improving performance. By solving business
Paraphrase This Document
Need a fresh take? Get an instant paraphrase of this document with our AI Paraphraser
related problems, it can improve its image in the market by which it can attract customers.
Customers stay with businesses that have improved image and have an ability to solve complex
problems in a timely and effective manner (Kalinic, Marinkovic, Molinillo and Liébana-
Cabanillas, 2019). It can help this company out in taking competitive advantages and becoming
the market leader.
So, on the basis of above discussed advantages, it can be said that graphical and grouping
analytical approach is effective one.
DATA ANALYSIS
Steps of cleaning data
There are some steps that need to be followed for analysing and cleaning data. The main
aim of cleaning and analysing data is to make decision regarding investment and others. Some
common steps that need to be followed for data analysis include: removing duplicate data or
observation, fixing structural errors or removing all data that is not available. After that, there is
need to filter unwanted outliers such as improper data entry and then need to handle missing
data. By following this steps, data of bangle market of UK has analysed in an effective manner.
Relevant analytical techniques for data analysis
As Wood from the trees is reputed firm, recruit less experienced people and help them out in
increasing knowledge regarding ways of analyzing data for making better decision. Improved
decision is the main key of success. There are some data related to sales of bangles and other
ornaments of UK. It wants to know effectiveness of UK market as it invested in marketing
campaign in the UK. So, for taking advantages and making marketing campaign successful, it
wants to know actual condition of UK market. With data analysis, actual UK’s market condition
can be known.
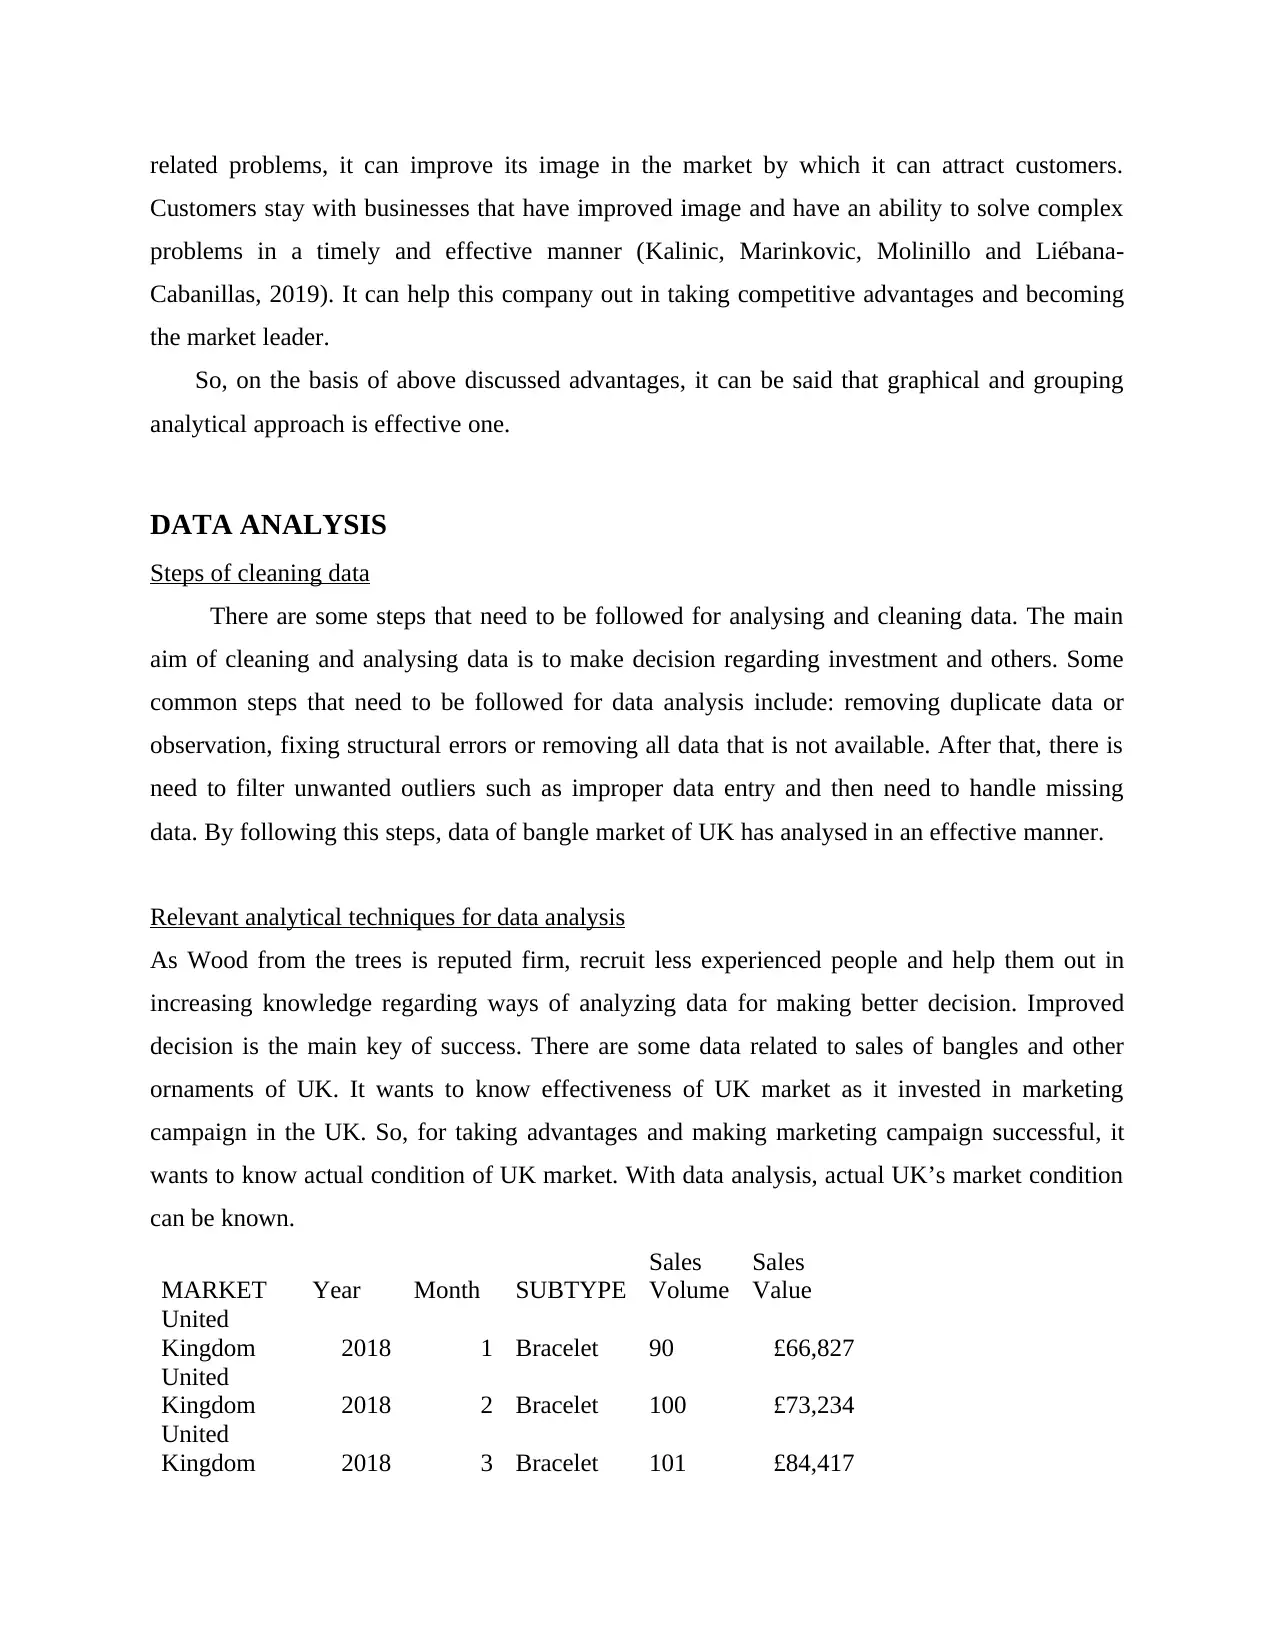
MARKET Year Month SUBTYPE
Sales
Volume
Sales
Value
United
Kingdom 2018 1 Bracelet 90 £66,827
United
Kingdom 2018 2 Bracelet 100 £73,234
United
Kingdom 2018 3 Bracelet 101 £84,417
Customers stay with businesses that have improved image and have an ability to solve complex
problems in a timely and effective manner (Kalinic, Marinkovic, Molinillo and Liébana-
Cabanillas, 2019). It can help this company out in taking competitive advantages and becoming
the market leader.
So, on the basis of above discussed advantages, it can be said that graphical and grouping
analytical approach is effective one.
DATA ANALYSIS
Steps of cleaning data
There are some steps that need to be followed for analysing and cleaning data. The main
aim of cleaning and analysing data is to make decision regarding investment and others. Some
common steps that need to be followed for data analysis include: removing duplicate data or
observation, fixing structural errors or removing all data that is not available. After that, there is
need to filter unwanted outliers such as improper data entry and then need to handle missing
data. By following this steps, data of bangle market of UK has analysed in an effective manner.
Relevant analytical techniques for data analysis
As Wood from the trees is reputed firm, recruit less experienced people and help them out in
increasing knowledge regarding ways of analyzing data for making better decision. Improved
decision is the main key of success. There are some data related to sales of bangles and other
ornaments of UK. It wants to know effectiveness of UK market as it invested in marketing
campaign in the UK. So, for taking advantages and making marketing campaign successful, it
wants to know actual condition of UK market. With data analysis, actual UK’s market condition
can be known.
MARKET Year Month SUBTYPE
Sales
Volume
Sales
Value
United
Kingdom 2018 1 Bracelet 90 £66,827
United
Kingdom 2018 2 Bracelet 100 £73,234
United
Kingdom 2018 3 Bracelet 101 £84,417
United
Kingdom 2018 4 Bracelet 112 £68,567
United
Kingdom 2018 5 Bracelet 101 £80,533
United
Kingdom 2018 6 Bracelet 104 £81,612
United
Kingdom 2018 7 Bracelet 102 £83,083
United
Kingdom 2018 8 Bracelet 94 £76,245
United
Kingdom 2018 9 Bracelet 115 £87,373
United
Kingdom 2018 10 Bracelet 57 £39,123
United
Kingdom 2018 11 Bracelet 77 £56,305
United
Kingdom 2018 12 Bracelet 121 £95,581
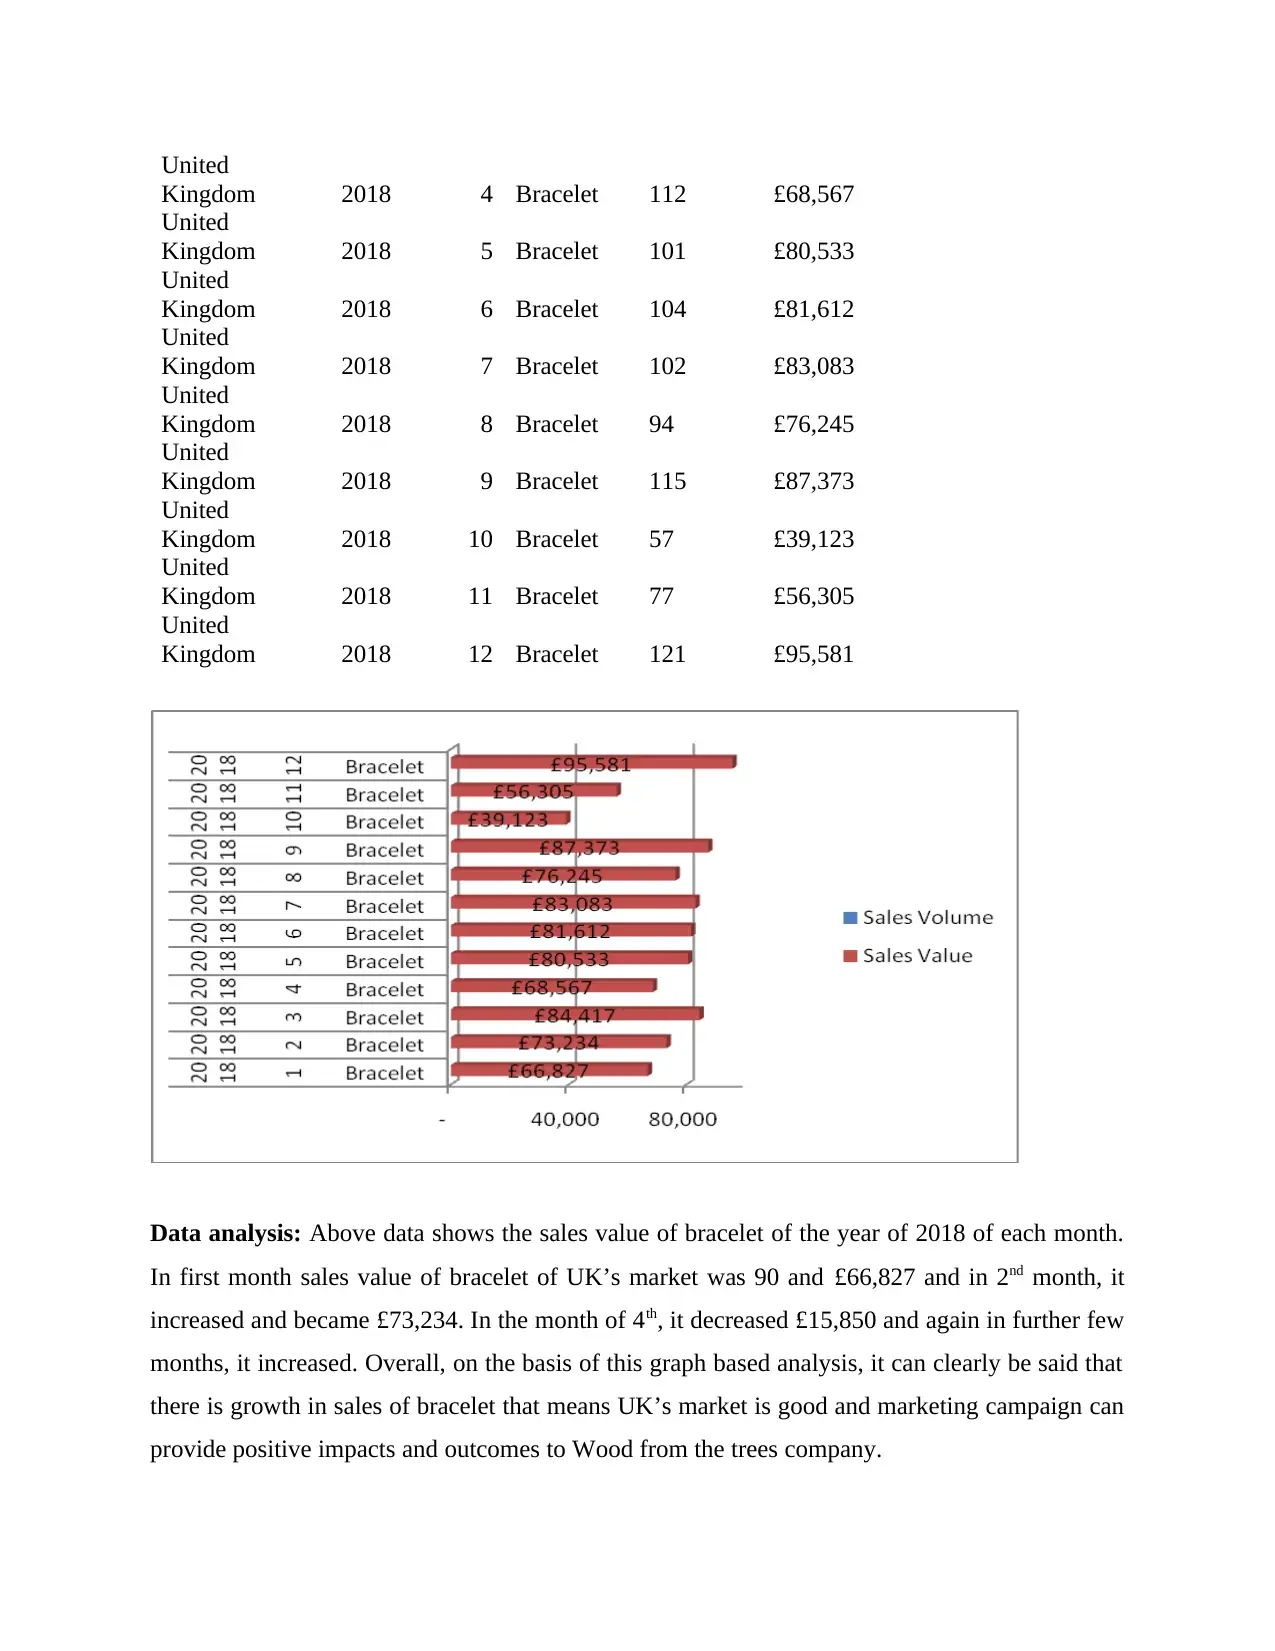
Data analysis: Above data shows the sales value of bracelet of the year of 2018 of each month.
In first month sales value of bracelet of UK’s market was 90 and £66,827 and in 2nd month, it
increased and became £73,234. In the month of 4th, it decreased £15,850 and again in further few
months, it increased. Overall, on the basis of this graph based analysis, it can clearly be said that
there is growth in sales of bracelet that means UK’s market is good and marketing campaign can
provide positive impacts and outcomes to Wood from the trees company.
Kingdom 2018 4 Bracelet 112 £68,567
United
Kingdom 2018 5 Bracelet 101 £80,533
United
Kingdom 2018 6 Bracelet 104 £81,612
United
Kingdom 2018 7 Bracelet 102 £83,083
United
Kingdom 2018 8 Bracelet 94 £76,245
United
Kingdom 2018 9 Bracelet 115 £87,373
United
Kingdom 2018 10 Bracelet 57 £39,123
United
Kingdom 2018 11 Bracelet 77 £56,305
United
Kingdom 2018 12 Bracelet 121 £95,581
Data analysis: Above data shows the sales value of bracelet of the year of 2018 of each month.
In first month sales value of bracelet of UK’s market was 90 and £66,827 and in 2nd month, it
increased and became £73,234. In the month of 4th, it decreased £15,850 and again in further few
months, it increased. Overall, on the basis of this graph based analysis, it can clearly be said that
there is growth in sales of bracelet that means UK’s market is good and marketing campaign can
provide positive impacts and outcomes to Wood from the trees company.
⊘ This is a preview!⊘
Do you want full access?
Subscribe today to unlock all pages.
Trusted by 1+ million students worldwide
MARKET Year Month SUBTYPE
Sales
Volume
Sales
Value
United
Kingdom 2020 1 Bracelet 117 £88,598
United
Kingdom 2020 2 Bracelet 124 £92,995
United
Kingdom 2020 3 Bracelet 174 £129,807
United
Kingdom 2020 4 Bracelet 149 £119,557
United
Kingdom 2020 5 Bracelet 278 £239,261
United
Kingdom 2020 6 Bracelet 316 £247,992
United
Kingdom 2020 7 Bracelet 221 £189,480
United
Kingdom 2020 8 Bracelet 190 £142,539
United
Kingdom 2020 9 Bracelet 160 £201,433
United
Kingdom 2020 10 Bracelet 120 £109,739
United
Kingdom 2020 11 Bracelet 132 £115,607
United
Kingdom 2020 12 Bracelet 97 £86,543
Sales
Volume
Sales
Value
United
Kingdom 2020 1 Bracelet 117 £88,598
United
Kingdom 2020 2 Bracelet 124 £92,995
United
Kingdom 2020 3 Bracelet 174 £129,807
United
Kingdom 2020 4 Bracelet 149 £119,557
United
Kingdom 2020 5 Bracelet 278 £239,261
United
Kingdom 2020 6 Bracelet 316 £247,992
United
Kingdom 2020 7 Bracelet 221 £189,480
United
Kingdom 2020 8 Bracelet 190 £142,539
United
Kingdom 2020 9 Bracelet 160 £201,433
United
Kingdom 2020 10 Bracelet 120 £109,739
United
Kingdom 2020 11 Bracelet 132 £115,607
United
Kingdom 2020 12 Bracelet 97 £86,543
Paraphrase This Document
Need a fresh take? Get an instant paraphrase of this document with our AI Paraphraser
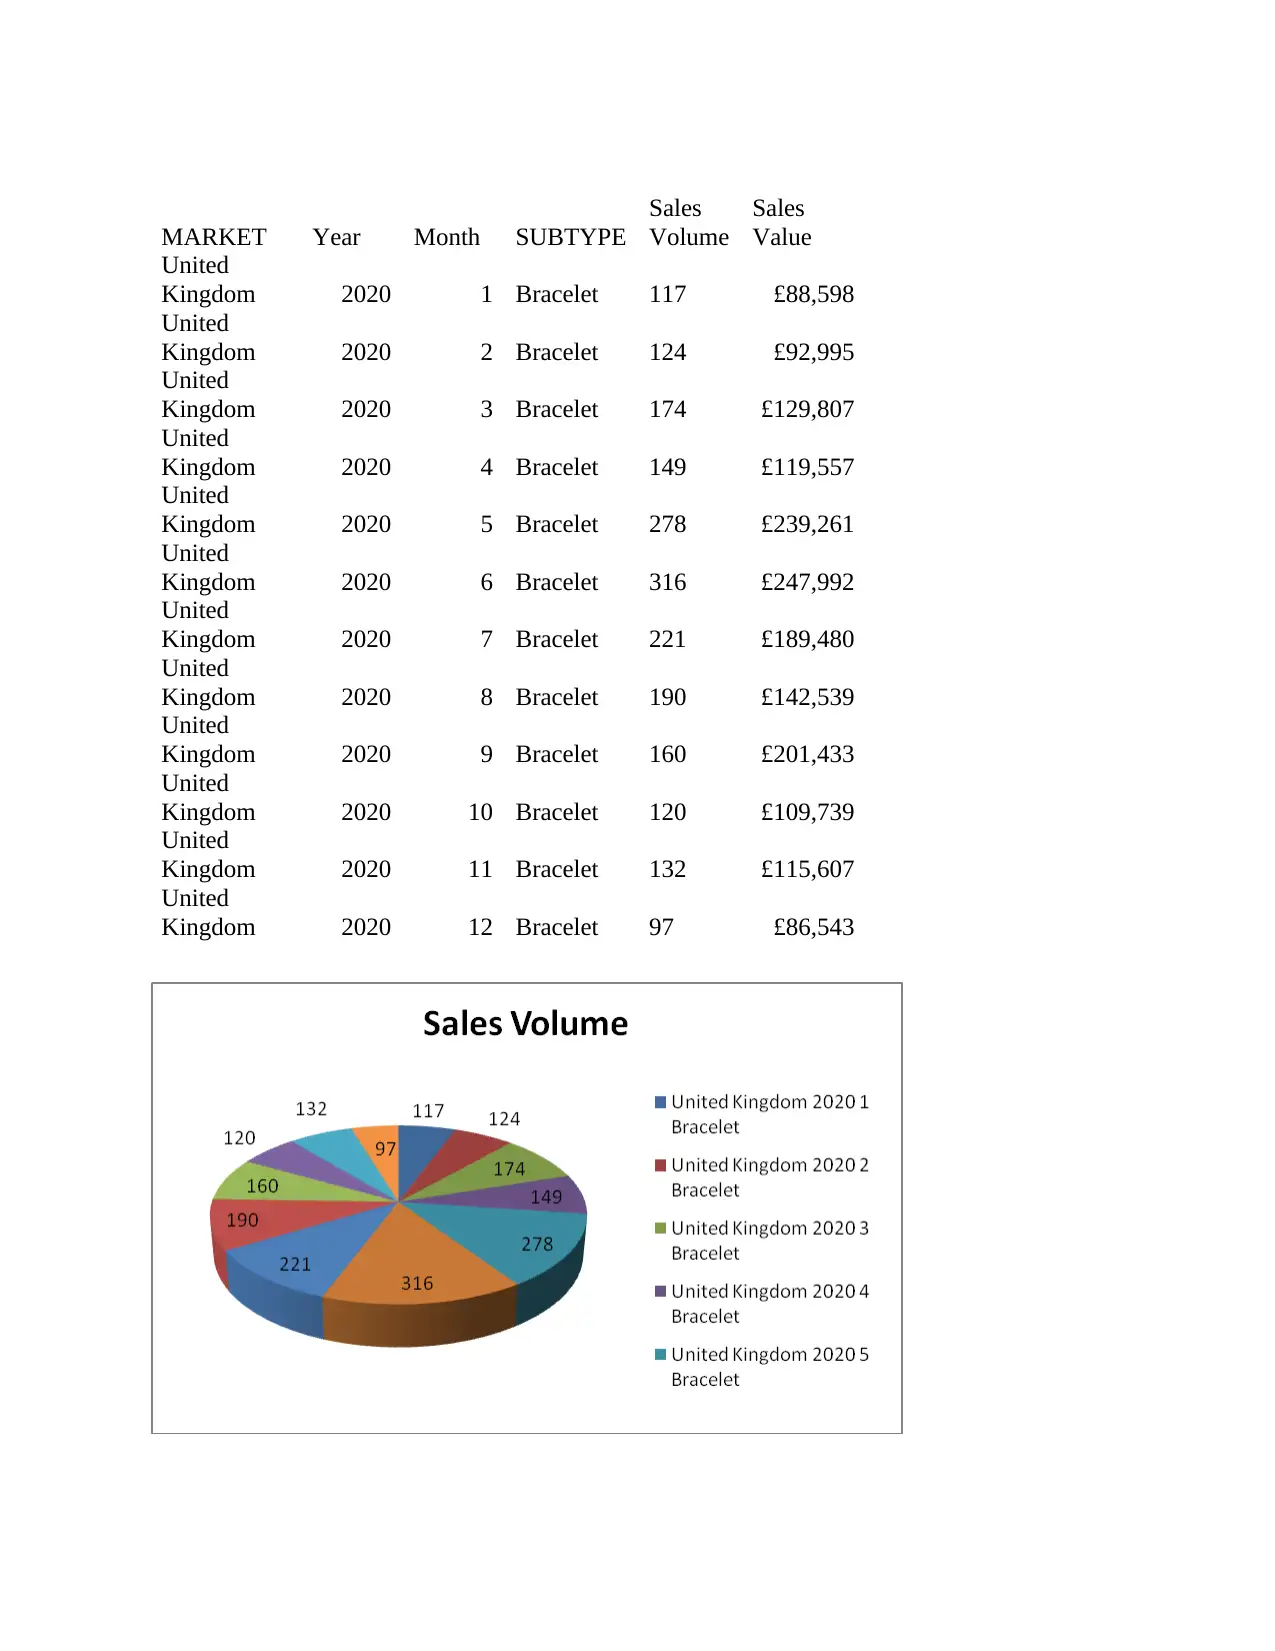
Data analysis: Above data shows sales volume of bracelet of each month of 2020. The reason of
analyzing data is to know UK’s market effectiveness in order to help WFTT in knowing impact
of marketing campaign. In the first month of 2020, sales volume of bracelet was £88,598 in
second as well as third month, it increased. In 4th month, it was decreased but again in 5th and 6th
months increased by great extent. There is fluctuation in sales volume so, on the basis of this
analysis of data of 2020, it can be said that market was not improved to the great extent.
Company needs to identify reasons and can increase positive impacts of marketing campaign on
sales performance.
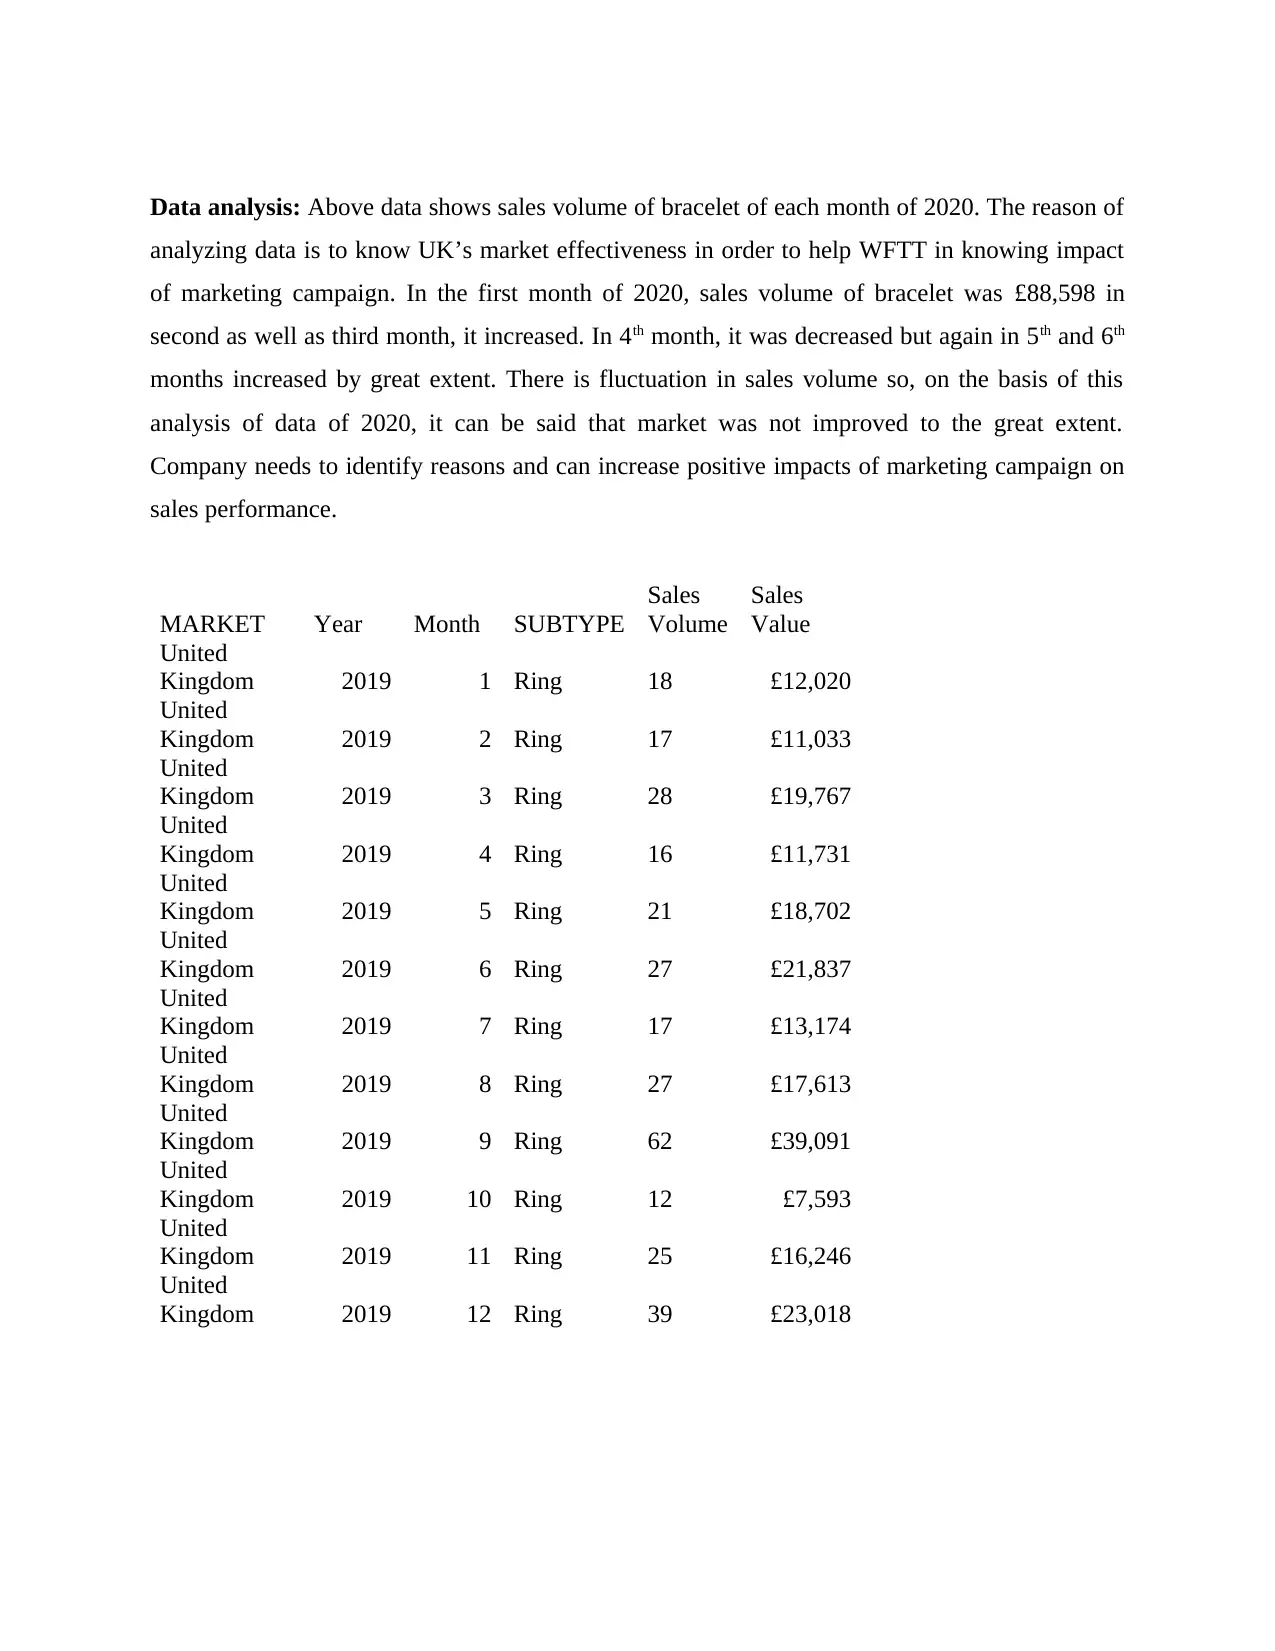
MARKET Year Month SUBTYPE
Sales
Volume
Sales
Value
United
Kingdom 2019 1 Ring 18 £12,020
United
Kingdom 2019 2 Ring 17 £11,033
United
Kingdom 2019 3 Ring 28 £19,767
United
Kingdom 2019 4 Ring 16 £11,731
United
Kingdom 2019 5 Ring 21 £18,702
United
Kingdom 2019 6 Ring 27 £21,837
United
Kingdom 2019 7 Ring 17 £13,174
United
Kingdom 2019 8 Ring 27 £17,613
United
Kingdom 2019 9 Ring 62 £39,091
United
Kingdom 2019 10 Ring 12 £7,593
United
Kingdom 2019 11 Ring 25 £16,246
United
Kingdom 2019 12 Ring 39 £23,018
analyzing data is to know UK’s market effectiveness in order to help WFTT in knowing impact
of marketing campaign. In the first month of 2020, sales volume of bracelet was £88,598 in
second as well as third month, it increased. In 4th month, it was decreased but again in 5th and 6th
months increased by great extent. There is fluctuation in sales volume so, on the basis of this
analysis of data of 2020, it can be said that market was not improved to the great extent.
Company needs to identify reasons and can increase positive impacts of marketing campaign on
sales performance.
MARKET Year Month SUBTYPE
Sales
Volume
Sales
Value
United
Kingdom 2019 1 Ring 18 £12,020
United
Kingdom 2019 2 Ring 17 £11,033
United
Kingdom 2019 3 Ring 28 £19,767
United
Kingdom 2019 4 Ring 16 £11,731
United
Kingdom 2019 5 Ring 21 £18,702
United
Kingdom 2019 6 Ring 27 £21,837
United
Kingdom 2019 7 Ring 17 £13,174
United
Kingdom 2019 8 Ring 27 £17,613
United
Kingdom 2019 9 Ring 62 £39,091
United
Kingdom 2019 10 Ring 12 £7,593
United
Kingdom 2019 11 Ring 25 £16,246
United
Kingdom 2019 12 Ring 39 £23,018
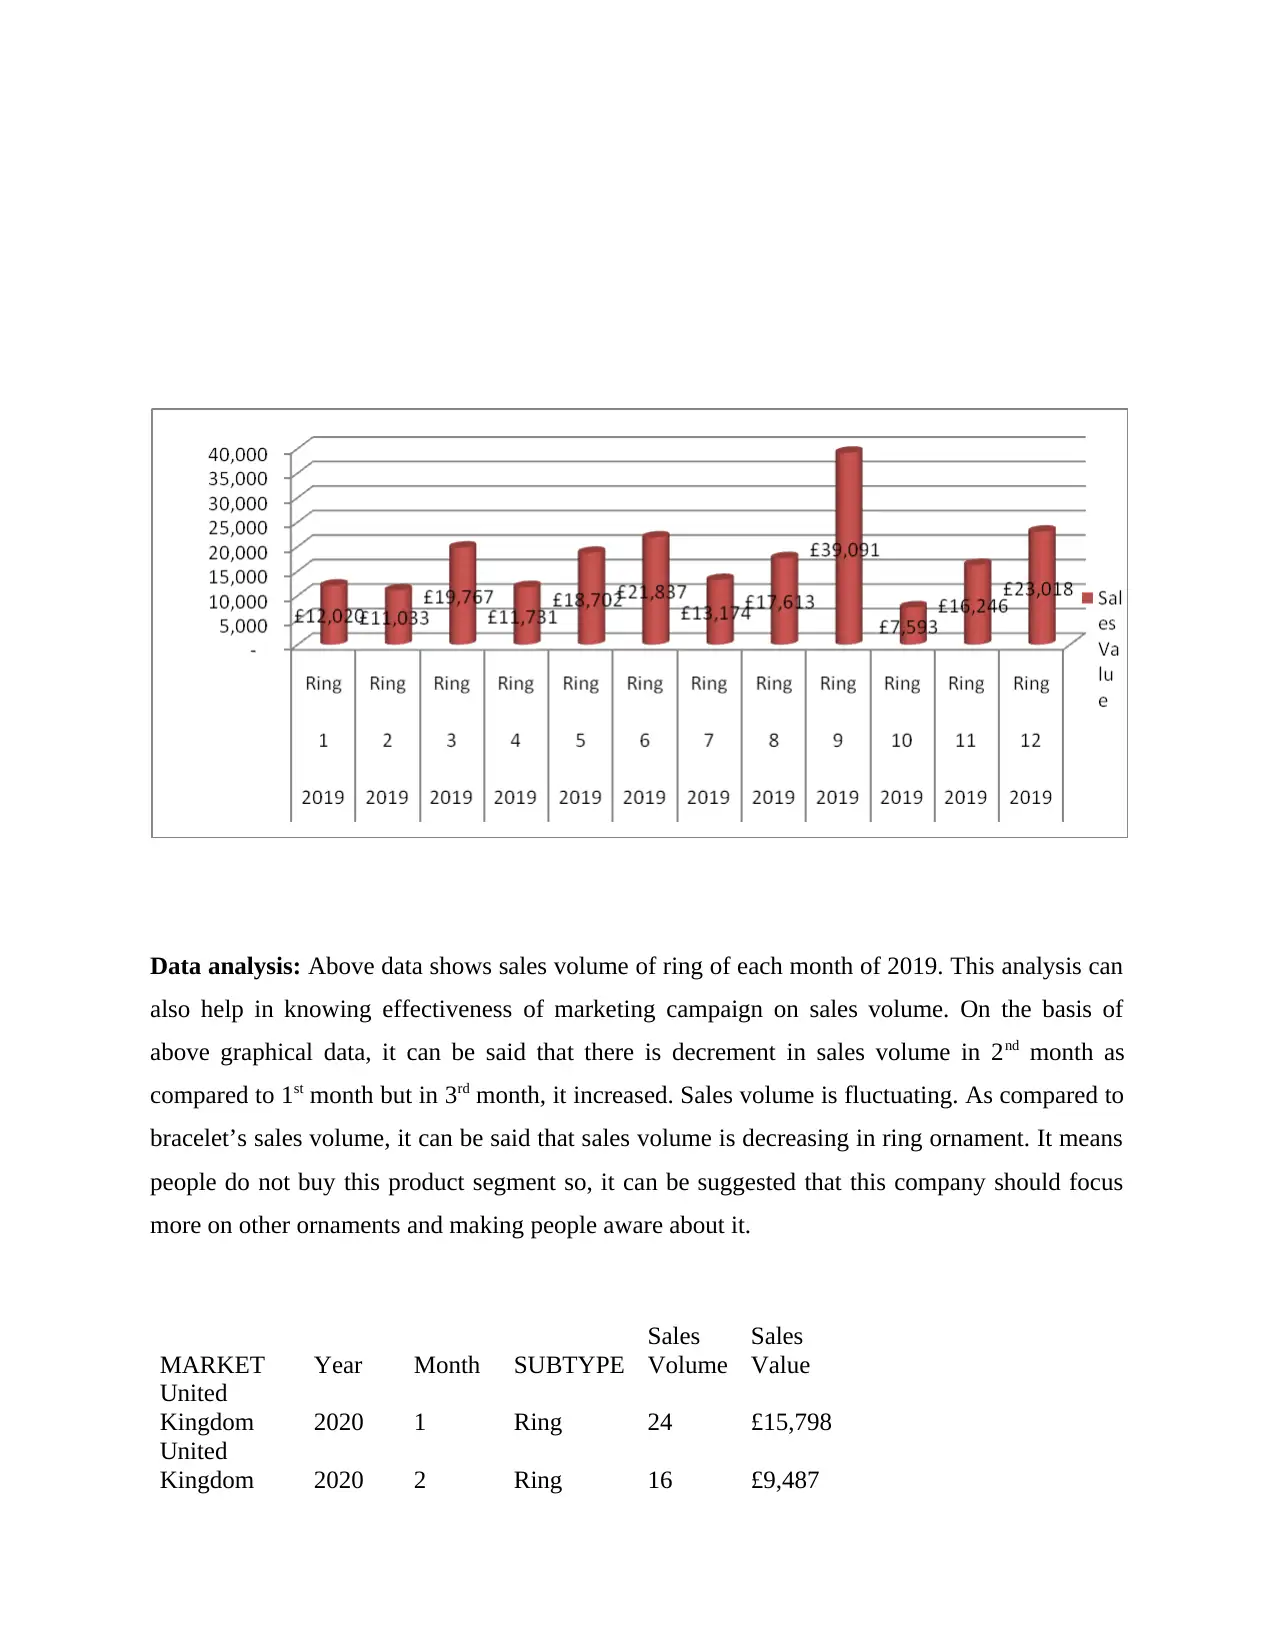
Data analysis: Above data shows sales volume of ring of each month of 2019. This analysis can
also help in knowing effectiveness of marketing campaign on sales volume. On the basis of
above graphical data, it can be said that there is decrement in sales volume in 2nd month as
compared to 1st month but in 3rd month, it increased. Sales volume is fluctuating. As compared to
bracelet’s sales volume, it can be said that sales volume is decreasing in ring ornament. It means
people do not buy this product segment so, it can be suggested that this company should focus
more on other ornaments and making people aware about it.
MARKET Year Month SUBTYPE
Sales
Volume
Sales
Value
United
Kingdom 2020 1 Ring 24 £15,798
United
Kingdom 2020 2 Ring 16 £9,487
⊘ This is a preview!⊘
Do you want full access?
Subscribe today to unlock all pages.
Trusted by 1+ million students worldwide
United
Kingdom 2020 3 Ring 20 £10,271
United
Kingdom 2020 4 Ring 13 £7,767
United
Kingdom 2020 5 Ring 18 £13,382
United
Kingdom 2020 6 Ring 17 £14,287
United
Kingdom 2020 7 Ring 14 £11,775
United
Kingdom 2020 8 Ring 19 £12,167
United
Kingdom 2020 9 Ring 51 £32,193
United
Kingdom 2020 10 Ring 5 £2,665
United
Kingdom 2020 11 Ring 4 £2,058
United
Kingdom 2020 12 Ring 3 £1,565
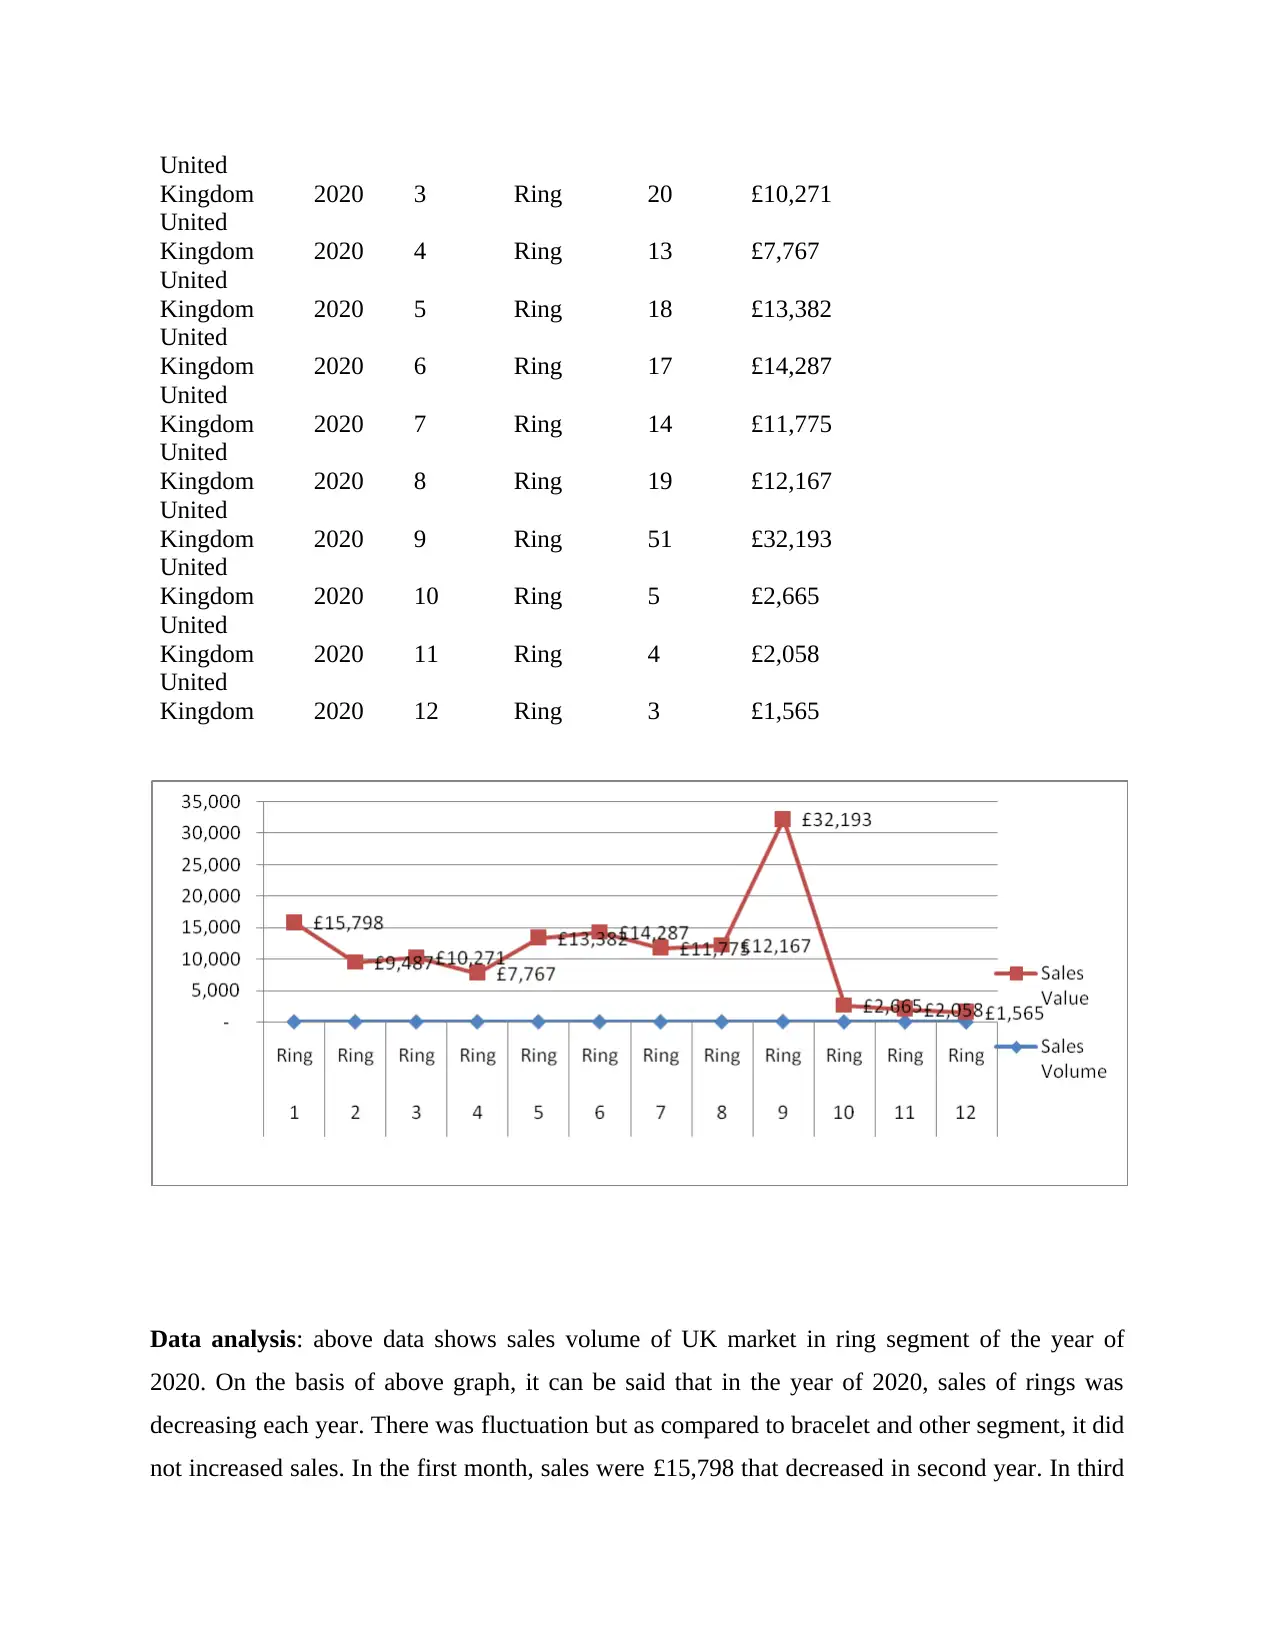
Data analysis: above data shows sales volume of UK market in ring segment of the year of
2020. On the basis of above graph, it can be said that in the year of 2020, sales of rings was
decreasing each year. There was fluctuation but as compared to bracelet and other segment, it did
not increased sales. In the first month, sales were £15,798 that decreased in second year. In third
Kingdom 2020 3 Ring 20 £10,271
United
Kingdom 2020 4 Ring 13 £7,767
United
Kingdom 2020 5 Ring 18 £13,382
United
Kingdom 2020 6 Ring 17 £14,287
United
Kingdom 2020 7 Ring 14 £11,775
United
Kingdom 2020 8 Ring 19 £12,167
United
Kingdom 2020 9 Ring 51 £32,193
United
Kingdom 2020 10 Ring 5 £2,665
United
Kingdom 2020 11 Ring 4 £2,058
United
Kingdom 2020 12 Ring 3 £1,565
Data analysis: above data shows sales volume of UK market in ring segment of the year of
2020. On the basis of above graph, it can be said that in the year of 2020, sales of rings was
decreasing each year. There was fluctuation but as compared to bracelet and other segment, it did
not increased sales. In the first month, sales were £15,798 that decreased in second year. In third
Paraphrase This Document
Need a fresh take? Get an instant paraphrase of this document with our AI Paraphraser
year, it again increased but gradually it was decreasing. In the last month, sales was only £1,565.
As compared to sales of first month, it can clearly be said that there was decrement of sales in
this segment that affected UK’s bangle market. So, on this, basis, it can be said that in this year,
marketing campaign did not has positive impact on sales. It means there were some problems
and all causes can be known with econometric analysis.
Overall, it can be said that data analysis plays a vital role in making decision and knowing
effectiveness of marketing and other functions.
Recommendations to Wood from the trees company regarding data analysis techniques
As it is known that there is fluctuation in sales of wood from Trees Company and it wants
to expand its business by knowing the best valuable product. Among all its ornaments such as:
ring, bracelet, hair band, bracelet. On the basis of some secondary data of UK’s bangles market,
it can be said that bracelet is the most used type of ornaments by people. It has used some data
analysis techniques for knowing changes in sales of bangles and other ornaments but it is facing
some problems (Burkhanov, 2020).
Econometric analysis: For helping this company out in becoming the market leader, it can
be suggested that it should focus on econometric analysis. It is statistical and mathematical
analysis that helps in knowing economic relationship as a basis of economic forecasting. By
making use of this analysis, this company can predict economy condition and can also know
about economic policies. By knowing all about economy, it can make better pricing and product
related decisions. The main aim of making use of this analysis method is to convert qualitative
statements that show positive relationship between 2 variables into quantitative statement. It can
help in knowing reasons of increasing and decreasing in sales value of ornaments or bangle
market. By knowing relationship between variables such as: relationship of disposable income
on investment, better decision can be taken. There are three main goals that this company can
accomplish by making use of this analytical method such as: estimation, forecasting and
analyzing. By forecasting about demand of bracelet as per the economic condition, it can develop
its products accordingly (Feng and Wang, 2019). By estimating pricing strategies and sales
value, it can expand its business and can increase market shares. Overall, it can be said that by
changing data analysis techniques, market share of UK’s bangles can be improved that can lead
improved economic condition.
In addition, it is also known that it wants to improve effectiveness of marketing campaign so, in
this regard; it can be recommended that it should focus on making an official page on social
media. Social media is one of the best sources or platform by which people can be made aware
about effectiveness of products and marketing campaign. By updating information and detailed
description of bangles and all ornaments, it can grab attention of people and can motivate them
for buying products. Advertising plays a vital role as it helps in promoting products of companies
and improve image in the market. Customers should be allowed sharing their views regarding
products’ effectiveness on social media platforms. It makes them feel valued when they provide
suggestions and companies consider their suggestions and needs. Overall, it can be said that by
making use of this suggested data analysis method and advertising way, it can take better
decision and can know impact of marketing campaign on sales performance (Wali, 2018).
Along with this, it can also be recommended to Wood from Trees Company that it should
focus on conducting survey and questionnaire by asking questions related to ornaments. It can
help this company out in knowing the most preferred type of ornament and features that can
improve UK’s bangle market and increase sales as well. Online customers’ survey can save time
as well as cost and by making changes in products and bangle market accordingly; it can make
customers’ feel valued. When customers get products as per their needs and types then they are
more likely to become loyal towards market and it increase sales as well as productivity of this
company.
CONCLUSION
It has been summarised from the above study that data analysis plays a vital role as it helps
companies in improving their business decision. Improved business decision is the main key of
success of business and helps companies in increasing sales by satisfying customers’ needs. This
above study has discussed some key trends that has lead importance of data analysis or for which
companies have to focus more on cleaning and transforming big data. Automation has discussed
as one of the main key trend and with automation, companies find easier in analysing big data
and it makes them able to be in the competition. It has also shown graphical data analysis on
sales volume of 3 years in order to identify whether marketing campaign have positive impacts
on sales or not. Graphical data analysis is one of the effective ways and it helps viewers in
knowing changes in data. Marketing campaign has direct relationship with sales as marketing
⊘ This is a preview!⊘
Do you want full access?
Subscribe today to unlock all pages.
Trusted by 1+ million students worldwide
1 out of 14
Related Documents


Your All-in-One AI-Powered Toolkit for Academic Success.
+13062052269
info@desklib.com
Available 24*7 on WhatsApp / Email
![[object Object]](/_next/static/media/star-bottom.7253800d.svg)
Unlock your academic potential
Copyright © 2020–2026 A2Z Services. All Rights Reserved. Developed and managed by ZUCOL.