Comparative Analysis: Phenological Development of Six Wheat Varieties
VerifiedAdded on 2020/05/04
|8
|2440
|91
Report
AI Summary
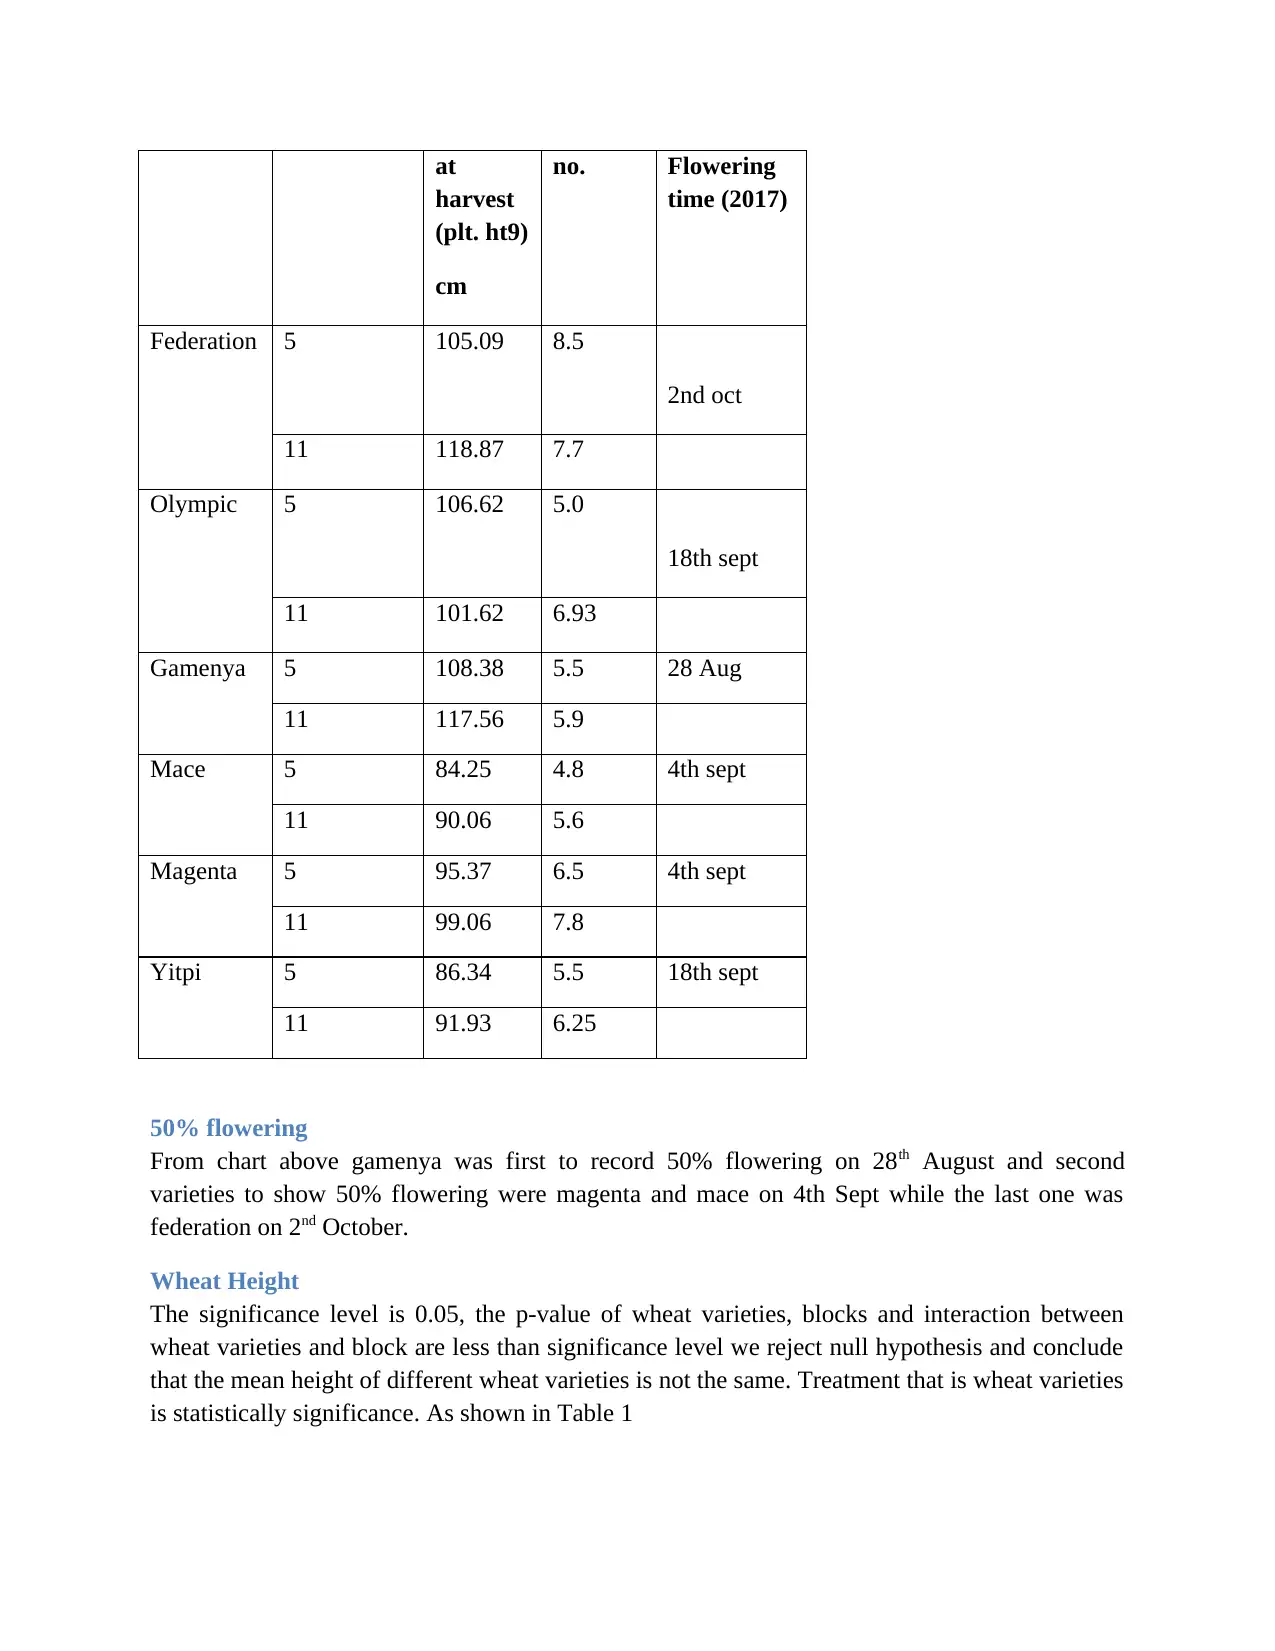
This report presents a comparative analysis of the phenological development of six wheat varieties: Federation, Olympic, Gamenya (old varieties) and Mace, Magenta, and Yitpi (new varieties). Conducted at Curtin University, the study investigated plant height, tiller number, flowering time, dry matter weight, and yield. The methodology included field trials, growth measurements, and statistical analysis using ANOVA. Results indicated significant differences in plant height and tiller number, with older varieties generally exhibiting greater height and more tillers. However, there was no statistically significant difference in dry matter weight or yield between the varieties. The discussion highlights the impact of wheat genotypes on yields and morphological traits, the adaptability of existing genotypes, and the need for further research. The report concludes that while older varieties showed better morphological traits, the yield was the same, and that the new varieties have been changed their genotype in order to survive in Mediterranean condition. Key findings include that the mean height of old varieties is better compared to new varieties and that the mean yield and mean weight of wheat plant were same for the six varieties of wheat.
Contribute Materials
Your contribution can guide someone’s learning journey. Share your
documents today.

Phenological Development of Six
Different Varieties of Wheat
Name:
Date:
Different Varieties of Wheat
Name:
Date:
Secure Best Marks with AI Grader
Need help grading? Try our AI Grader for instant feedback on your assignments.

Key Messages
Comparison between new and old varieties wheat provides information on changes
occurring on environment which can be changed through technological advancement and
which varieties are better in term of yield and rate of growth and development.
Introduction
Drought and extreme temperature are main constraints to wheat production. Different wheat
varieties do well in different temperature and climate. Wheat is one type of grass family which
mainly grown for its seed, it is staple food worldwide, (Venkateswarlu & Shanker, 2012). Wheat
has many species that together make up genus Triticum. The most common species is Triticum
aestivum. Wheat trade is largest in world and it is most produced cereal after maize. It is on high
demand globally as it is source of carbohydrates and source of vegetal protein necessary for
human consumption, (D’souza & Jellife, 2012). The most common cultivated types of wheat are
T. aestivum, T. spelta, T. durum, T. dicoccon, T. turanicum and T. monococcum.
Due to change of global environmental features and population increase, water resources and
crop production are on increase. It is necessary to come up with wheat genotypes which are
tolerant to drought and heat t o counter the rising food demand, (Buck et al., 2007). Though this
requires a lot of capital and time, thus the faster and quicker way is to test adaptability of already
existing genotype. The world requires more than 50% increase in production of wheat, maize and
rice to sustain its projected population by 2045, (Godfray et al., 2010).
Wheat usually requires between 110 days and 130 days between sowing time and harvest time
which will be affected by climate, soil conditions and seed species. Growth regulators,
fungicides, herbicides and fertilizers are applied in specifics wheat development stages. There
several systems to identify crop development stages which include Feekes and Zadoks scale the
most common. Wheat genetics differs from other domesticated species, some species are diploid
like T. monococcum, and others are tetraploid such as emmer and durum and hexaploid. This
different genetics version is necessary for yields.
Aims
The research questions answered in study are
How wheat genotype affect wheat yields and morphological system of wheat that
is number of leaves, biomass and wheat grain.
Which is the best variety of wheat to be plant in order to get higher yield and
harvest?
Hypothesis
The study tries to identify important genotype features that help wheat to give more yields and
also to compare old varieties of wheat and new varieties. Which is the best varieties to grow and
get high yield.

Methodology
Description of the experimental site
Curtin university is in Bentley, Western Australia; 30000’22”S 115053’36”. The climatic
condition of this area is hot Mediterranean climate with wet winter; average temperature is 13.7-
260c.
Plant material
This study made use of six different wheat varieties with different realised time. Old varieties
were federation, olympic and gamenya while relatively new varieties were mace, magenta and
yitpi. The seeds of all varieties of heat were sown at 25 May 2017 in the Field Trial Area (FTA)
of Curtin University. The seeds sown depth was at 30 cm row spacing with 13 g seeds of each
variety per row and there were 26 rows in each block.
Growing condition
The growing area had two blocks with clay soil and in the previous year, faba bean was sown in
same block. The pre-season treatment had approx. 6kg/m2 calcium bentonite. The base
fertilisers were 100kg/ha Urea; 100kg/ha Sulphate of potash; 90 kg/ha trace mix and 220kg/ha
Super phosphate. One side dress 2kg of Nitraphoska special had applied on planted area. Both
plots had tebuconazole 1ml/L, plus 2ml/L hasten applied approx. 300 L/ha.
Measurements
Growth measurements were plant height, number of tillers and Zadock score. These data was
collected every week until harvest. Dry matter weight was measured by weighting the stem after
putting them in the oven at 60oC for 48 hours in separate bags.
Experiment design and Statistical analysis
This experiment used completely randomised block design (CRBD) with four replications.
Treatments which were varieties of wheat were applied to blocks at random. ANOVA (α=0.05)
analysed all data using R studio following tests of normality and homogeneity of variance.
Tukey’s post hoc test was performed, to check if there was any significant difference following
any of the ANOVA test to identify the treatments that are significantly different.
Results
Chart 1
Varieties Blocks Plant ht. Tiller 50%

at
harvest
(plt. ht9)
cm
no. Flowering
time (2017)
Federation 5 105.09 8.5
2nd oct
11 118.87 7.7
Olympic 5 106.62 5.0
18th sept
11 101.62 6.93
Gamenya 5 108.38 5.5 28 Aug
11 117.56 5.9
Mace 5 84.25 4.8 4th sept
11 90.06 5.6
Magenta 5 95.37 6.5 4th sept
11 99.06 7.8
Yitpi 5 86.34 5.5 18th sept
11 91.93 6.25
50% flowering
From chart above gamenya was first to record 50% flowering on 28th August and second
varieties to show 50% flowering were magenta and mace on 4th Sept while the last one was
federation on 2nd October.
Wheat Height
The significance level is 0.05, the p-value of wheat varieties, blocks and interaction between
wheat varieties and block are less than significance level we reject null hypothesis and conclude
that the mean height of different wheat varieties is not the same. Treatment that is wheat varieties
is statistically significance. As shown in Table 1
Secure Best Marks with AI Grader
Need help grading? Try our AI Grader for instant feedback on your assignments.

From Table 2 the mean height of gamenya is highest with mean of 112.69, federation with
112.69, olympic with 104 and magenta, yitpi and maze have mean less than 100.
Tiller Number
Table 3. ANOVA table of wheat tiller number
Response: Tiller
Df Sum Sq Mean Sq F value Pr(>F)
Varieites 5 190.42 38.083 11.4012 1.435e-09 ***
Block 1 24.08 24.083 7.2100 0.007928 **
Varieites:Block 5 32.73 6.546 1.9597 0.086752 .
Residuals 180 601.25 3.340
---
Signif. codes: 0 ‘***’ 0.001 ‘**’ 0.01 ‘*’ 0.05 ‘.’ 0.1 ‘ ’ 1
The p-value of mean number of varieties is less than significance level of 0.005. Thus the mean number
of number of tiller is significance different. Different wheat varieties have different number of tillers.
Federation wheat has high number of tiller as compared all other wheat varieties, followed by magenta
and gamenya. The two old varieties wheat that is gamenya and federation are doing good as compared
to the other.
Fig. no.1 : Regression on tiller number in response to wheat varieties.
1880 1900 1920 1940 1960 1980 2000 2020
0
1
2
3
4
5
6
7
8
9
f(x) = − 0.0160709451620388 x + 38.0511302111532
The regression analysis also found higher tillers in old varieties as compared to new varieties of wheat.
Thus in term of number of shoot old varieties show more shoot compared to new varieties
Dry weight
Kruskal-Wallis rank sum test
data: Dry by Varieties
Kruskal-Wallis chi-squared = 1.4615, df = 5, p-value = 0.9175
The p- value from Kruskal-Wallis test of dry matter is 0.9175 which is greater than 0.05 and we

conclude the mean weight of dry matter of different varieties are insignificance difference. There is not
statistical difference between mean of old and new varieties.
Yield
Analysis of Variance Table
Response: yield
Df Sum Sq Mean Sq F value Pr(>F)
Varieties 5 2.5549 0.51097 4.0066 0.003652 **
Residuals 54 6.8869 0.12753
---
Signif. codes: 0 ‘***’ 0.001 ‘**’ 0.01 ‘*’ 0.05 ‘.’ 0.1 ‘ ’ 1
The p-value is 0.003 at 0.001 significance level and we conclude that the mean yield is statistically
insignificance. There was no evidence that the six varieties had different mean yield. Their yield were
almost the same
Discussion
From discussion from above it is evident that different genotype of wheat give different yields.
From previous research wheat genotypes and tolerant to drought and heat are correlated, (Buck
et al., 2007). The study found that old wheat varieties that is federation, Olympic and gamenya
produced more morphological features such tiller and plant height as compared to new varieties
of wheat. Ancient wheat are better compared to modern one, they are mainly in organic farming
system while new wheat varieties are usually bred for intensive high input systems. It is
therefore necessary to perform cultivators on different sites to identify interaction between
environment and genotype, (Heun M. Et al., 1997). Strong evidence can be found from study of
various research papers that genetic change determines the crop yield potential. Various varieties
are released having variable genes that hive high yield potential, resistant to disease, various
unfavourable environmental conditions like drought, (Perry & Antuono, 1989).
They are many wheat varieties and some being modified to suit certain climatic condition. Some
varieties do well in rainy climatic condition and other do well in Mediterranean countries where
drought follow the spring and they take a lot time to flower and ripen, (Canavara et al, 1994).
Old varieties of wheat did better in flowering, height and number of tiller than new varieties but
the yield was the same. The new varieties have being modified to suit the climatic condition.
The research assumes that if the research was replicated in different regions and restricted to
same condition will find the same results. The study only made use of morphological features
such as tiller, height and biomass to make conclusion not yields or the nutrients content further
research can conducted on the same.

Conclusions
The mean height of old varieties is better compared to new varieties. The mean height of
gamenya is highest and federation second highest and olympic third highest. Also the two old
varieties wheat that is gamenya and federation has high tiller number as compared to the other.
Ancient wheats are better compared to modern one. The mean yield and mean weight of wheat
plant were same for the six varieties of wheat, new varieties have been change their genotype in
order to survive in Mediterranean condition.
Key words
ANOVA- analysis of variance
CRBD- completely randomised design.
Appendices
Table 1. ANOVA table
Response: Height9
Df Sum Sq Mean Sq F value Pr(>F)
Varieites 5 19401.7 3880.3 112.2561 < 2.2e-16 ***
Block 1 1551.6 1551.6 44.8855 2.585e-10 ***
Varieites:Block 5 1544.8 309.0 8.9383 1.333e-07 ***
Residuals 180 6222.0 34.6
---
Signif. codes: 0 ‘***’ 0.001 ‘**’ 0.01 ‘*’ 0.05 ‘.’ 0.1 ‘ ’ 1
Table 2. Multiple comparison of mean height of different varieties
Varieites Block Height9.mean Height9.sd Height9.num Height9.se
1 NA NA 712 NA
2 Federation A 105.09375 6.763182 16 1.6907954
3 Federation B 118.87500 5.931554 16 1.4828885
4 Gamenya A 108.38125 9.582569 16 2.3956422
5 Gamenya B 117.56250 4.830028 16 1.2075069
6 Mace A 84.25000 7.056912 16 1.7642279
7 Mace B 90.93750 5.638779 16 1.4096949
8 Magenta A 95.37500 3.237798 16 0.8094494
9 Magenta B 99.06250 4.999583 16 1.2498958
10 Olympic A 106.44375 4.079864 16 1.0199660
11 Olympic B 101.62500 5.289928 16 1.3224819
12 Yitpi A 86.34375 6.871969 16 1.7179923
Paraphrase This Document
Need a fresh take? Get an instant paraphrase of this document with our AI Paraphraser

13 Yitpi B 91.93750 3.129830 16 0.7824574
Table 4. Turkey test
Fit: lm(formula = Tiller ~ Varieites * Block, data = Data)
Linear Hypotheses:
Estimate Std. Error t value Pr(>|t|)
Gamenya - Federation == 0 -3.0000 0.6462 -4.643 <0.001 ***
Mace - Federation == 0 -3.7500 0.6462 -5.803 <0.001 ***
Magenta - Federation == 0 -2.0000 0.6462 -3.095 0.0271 *
Olympic - Federation == 0 -3.5000 0.6462 -5.417 <0.001 ***
Yitpi - Federation == 0 -3.0625 0.6462 -4.739 <0.001 ***
Mace - Gamenya == 0 -0.7500 0.6462 -1.161 0.8548
Magenta - Gamenya == 0 1.0000 0.6462 1.548 0.6340
Olympic - Gamenya == 0 -0.5000 0.6462 -0.774 0.9716
Yitpi - Gamenya == 0 -0.0625 0.6462 -0.097 1.0000
Magenta - Mace == 0 1.7500 0.6462 2.708 0.0787 .
Olympic - Mace == 0 0.2500 0.6462 0.387 0.9989
Yitpi - Mace == 0 0.6875 0.6462 1.064 0.8950
Olympic - Magenta == 0 -1.5000 0.6462 -2.321 0.1908
Yitpi - Magenta == 0 -1.0625 0.6462 -1.644 0.5703
Yitpi - Olympic == 0 0.4375 0.6462 0.677 0.9843
---
Signif. codes: 0 ‘***’ 0.001 ‘**’ 0.01 ‘*’ 0.05 ‘.’ 0.1 ‘ ’ 1
(Adjusted p values reported -- single-step method)
References
Blum A. (2011). Plant water relations, plant stress and plant production. New York, Ny:
Springer.
Canavara M., Romani M., Corbellini M., et al., (1994). Evolutionary trends in morphological,
physiological and agronomical trait in old wheat: Europe Journal of Agronomy vol. 3 pg. 175-
185.
Buck H., Nisi J., Salomon N. (2007). Wheat production in stressed environments; Springer
Science and Business media, vol. 12, pg. 456-460.
D’souza A. & Jollife D. (2012). Food security and wheat prices in Afghanistan: in World Bank
policy research working paper; Washington DC
Godfray H., Beddington J., Crute I., Lawrence D., et al. (2010). Food security: the challenge of
feeding 9 billion people. Science, Vol. 327, pg 812-818.
Huen M., Schafer R., D Klawan et al., (1997). Site of einkorn wheat domestication identified by
DNA fingerprinting; Science, vol 278, pg 1312-1314.
1 out of 8
Related Documents

Your All-in-One AI-Powered Toolkit for Academic Success.
+13062052269
info@desklib.com
Available 24*7 on WhatsApp / Email
Unlock your academic potential
© 2024 | Zucol Services PVT LTD | All rights reserved.