Whitehaven Coal Ltd: Financial Ratio Analysis and Comparison Report
VerifiedAdded on 2021/06/17
|11
|2419
|34
Report
AI Summary
This report provides a comprehensive financial analysis of Whitehaven Coal Ltd, focusing on the calculation and interpretation of key financial ratios, including current ratio, quick ratio, gross profit margin, return on equity, and return on assets. The analysis compares Whitehaven Coal Ltd's performance with two other companies in the same industry, Wollongong Coal Ltd and White Energy Co Ltd, using data from 2016 and 2017. The report examines the company's liquidity, profitability, and efficiency, offering insights into its financial health and making recommendations to potential shareholders regarding investment decisions. The executive summary highlights the core objectives, including the analysis of financial statements, computation of key ratios, comparison with industry peers, and the provision of investment recommendations.
Running head: ACCOUNTING FOR BUSINESS
Accounting for Business
Name of the Student:
Name of the University:
Author’s Note:
Accounting for Business
Name of the Student:
Name of the University:
Author’s Note:
Paraphrase This Document
Need a fresh take? Get an instant paraphrase of this document with our AI Paraphraser
1
ACCOUNTING FOR BUSINESS
Executive Summary
The main purpose of this assignment is to analyze the financial statements of Whitehaven Coal
ltd and compute significant key financial ratios of the business. The key ratios which are selected
are to be discussed and then analyzed for the purpose of this assignment. The assignment will
also be selecting two other companies which belong to the same Industry and the comparing the
performance of Whitehaven Coal ltd. The assignment will be recommending to potential
shareholders as to whether they should invest in the shares of the company.
2
ACCOUNTING FOR BUSINESS
Table of Contents
Introduction......................................................................................................................................3
Overview of the Company...............................................................................................................3
Ratio Analysis..................................................................................................................................3
Current Ratio...............................................................................................................................4
Quick Ratio..................................................................................................................................5
Gross Profit Margin.....................................................................................................................5
Return on Equity..........................................................................................................................6
Return on Assets..........................................................................................................................6
Reference.........................................................................................................................................9
⊘ This is a preview!⊘
Do you want full access?
Subscribe today to unlock all pages.
Trusted by 1+ million students worldwide
3
ACCOUNTING FOR BUSINESS
Introduction
The assignment will be focusing on the analysis of performance of Whitehaven coal ltd
and will be computing financial ratios for the purpose of analysis. The ratio which will be
computed will be of significance and will be analyzed as per the requirement of the assignment.
The companies which are selected for comparing the financial performance of the business are
Wollongong Coal Ltd and White Energy Co ltd. Both theses companies are listed in Australian
stock exchange and are is engaged in the same industry as Whitehaven Coal Ltd.
Overview of the Company
Whitehaven Coal ltd is engaged in the business of development and operation of coal
mines in Australia. The company has basically two business segments which are open cut
operations and underground operations. The business is recognized to be one of the leading
company in generation and operation in coals. The company has been able to generate net sales
of $ 1.77 billion and the company has achieved a growth of 52.28% in terms of sales growth.
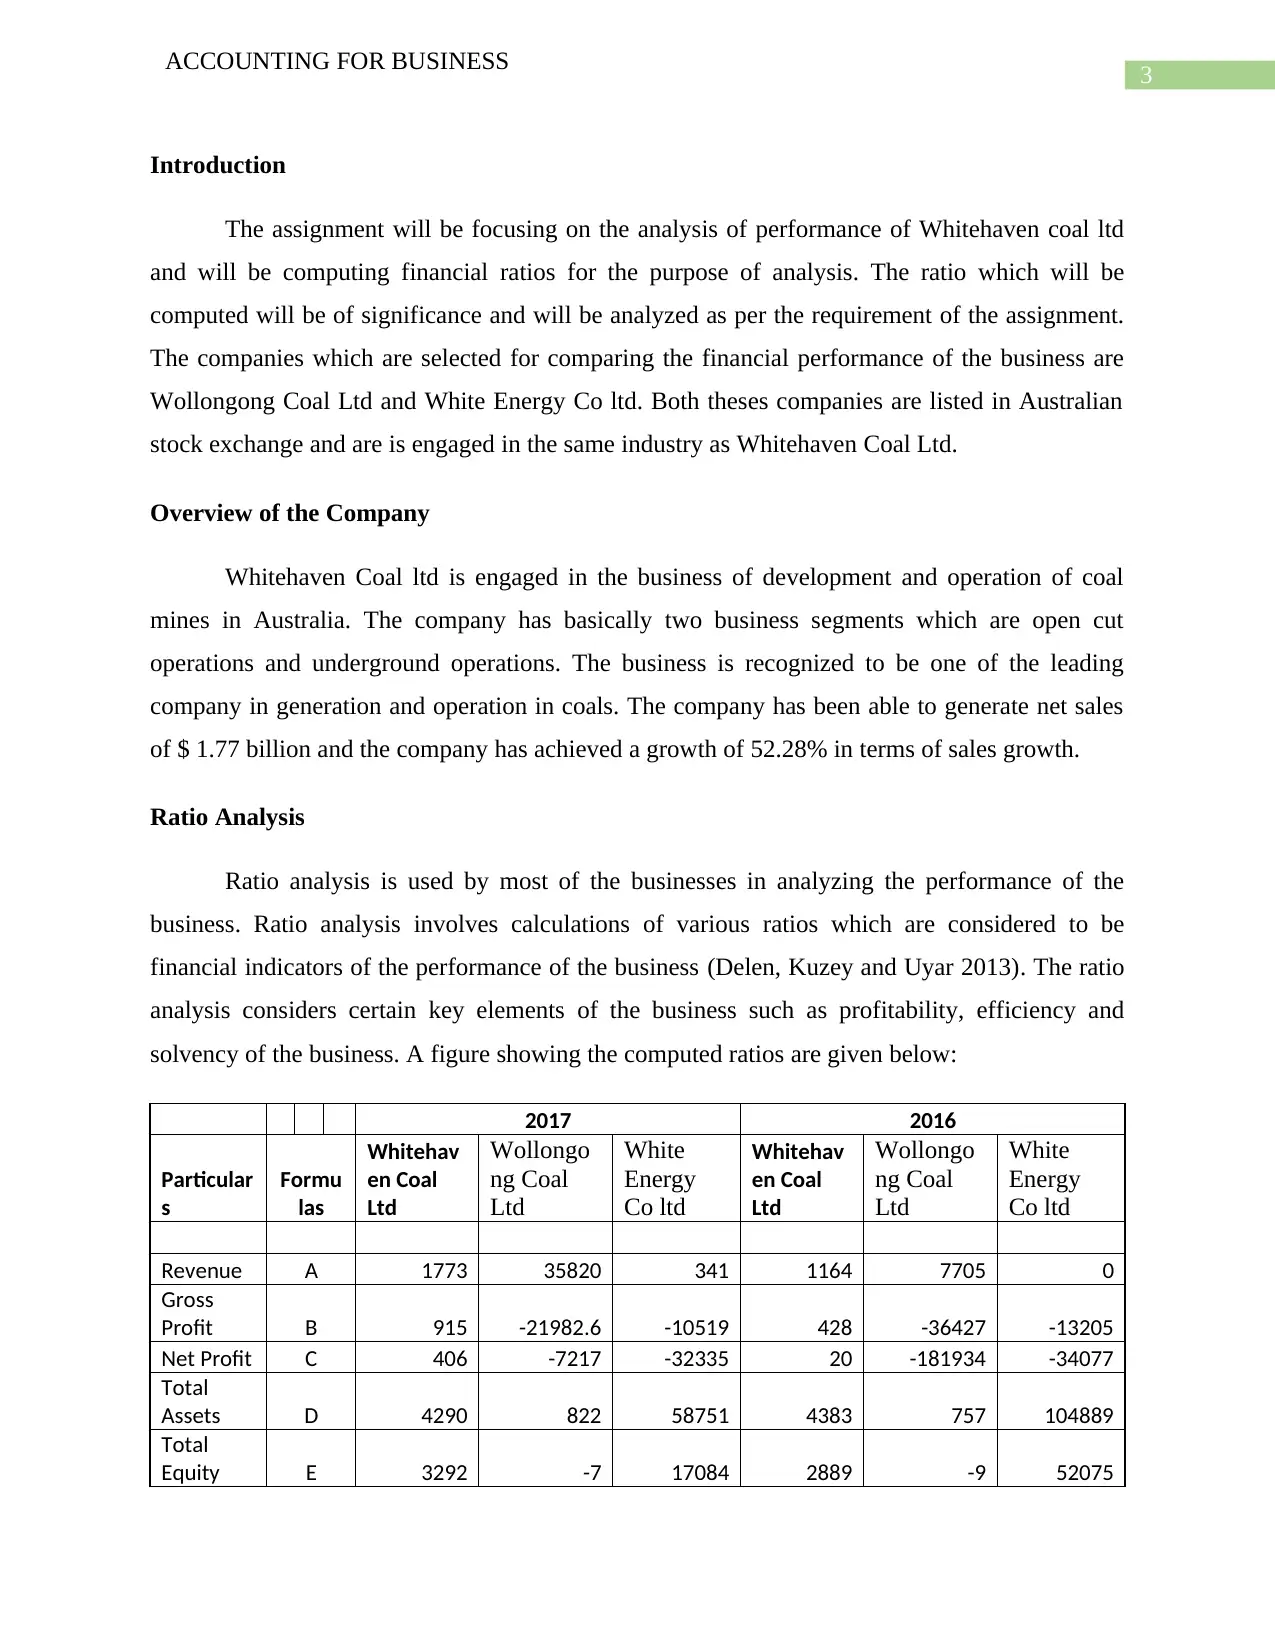
Ratio Analysis
Ratio analysis is used by most of the businesses in analyzing the performance of the
business. Ratio analysis involves calculations of various ratios which are considered to be
financial indicators of the performance of the business (Delen, Kuzey and Uyar 2013). The ratio
analysis considers certain key elements of the business such as profitability, efficiency and
solvency of the business. A figure showing the computed ratios are given below:
2017 2016
Particular
s
Formu
las
Whitehav
en Coal
Ltd
Wollongo
ng Coal
Ltd
White
Energy
Co ltd
Whitehav
en Coal
Ltd
Wollongo
ng Coal
Ltd
White
Energy
Co ltd
Revenue A 1773 35820 341 1164 7705 0
Gross
Profit B 915 -21982.6 -10519 428 -36427 -13205
Net Profit C 406 -7217 -32335 20 -181934 -34077
Total
Assets D 4290 822 58751 4383 757 104889
Total
Equity E 3292 -7 17084 2889 -9 52075
ACCOUNTING FOR BUSINESS
Introduction
The assignment will be focusing on the analysis of performance of Whitehaven coal ltd
and will be computing financial ratios for the purpose of analysis. The ratio which will be
computed will be of significance and will be analyzed as per the requirement of the assignment.
The companies which are selected for comparing the financial performance of the business are
Wollongong Coal Ltd and White Energy Co ltd. Both theses companies are listed in Australian
stock exchange and are is engaged in the same industry as Whitehaven Coal Ltd.
Overview of the Company
Whitehaven Coal ltd is engaged in the business of development and operation of coal
mines in Australia. The company has basically two business segments which are open cut
operations and underground operations. The business is recognized to be one of the leading
company in generation and operation in coals. The company has been able to generate net sales
of $ 1.77 billion and the company has achieved a growth of 52.28% in terms of sales growth.
Ratio Analysis
Ratio analysis is used by most of the businesses in analyzing the performance of the
business. Ratio analysis involves calculations of various ratios which are considered to be
financial indicators of the performance of the business (Delen, Kuzey and Uyar 2013). The ratio
analysis considers certain key elements of the business such as profitability, efficiency and
solvency of the business. A figure showing the computed ratios are given below:
2017 2016
Particular
s
Formu
las
Whitehav
en Coal
Ltd
Wollongo
ng Coal
Ltd
White
Energy
Co ltd
Whitehav
en Coal
Ltd
Wollongo
ng Coal
Ltd
White
Energy
Co ltd
Revenue A 1773 35820 341 1164 7705 0
Gross
Profit B 915 -21982.6 -10519 428 -36427 -13205
Net Profit C 406 -7217 -32335 20 -181934 -34077
Total
Assets D 4290 822 58751 4383 757 104889
Total
Equity E 3292 -7 17084 2889 -9 52075
Paraphrase This Document
Need a fresh take? Get an instant paraphrase of this document with our AI Paraphraser
4
ACCOUNTING FOR BUSINESS
Current
Assets F 302 24 31389 233 20 20194
Current
Liabilities G 215 795 45164 179 741 36878
Inventori
es H 99 6 0 69 7 1763
Current
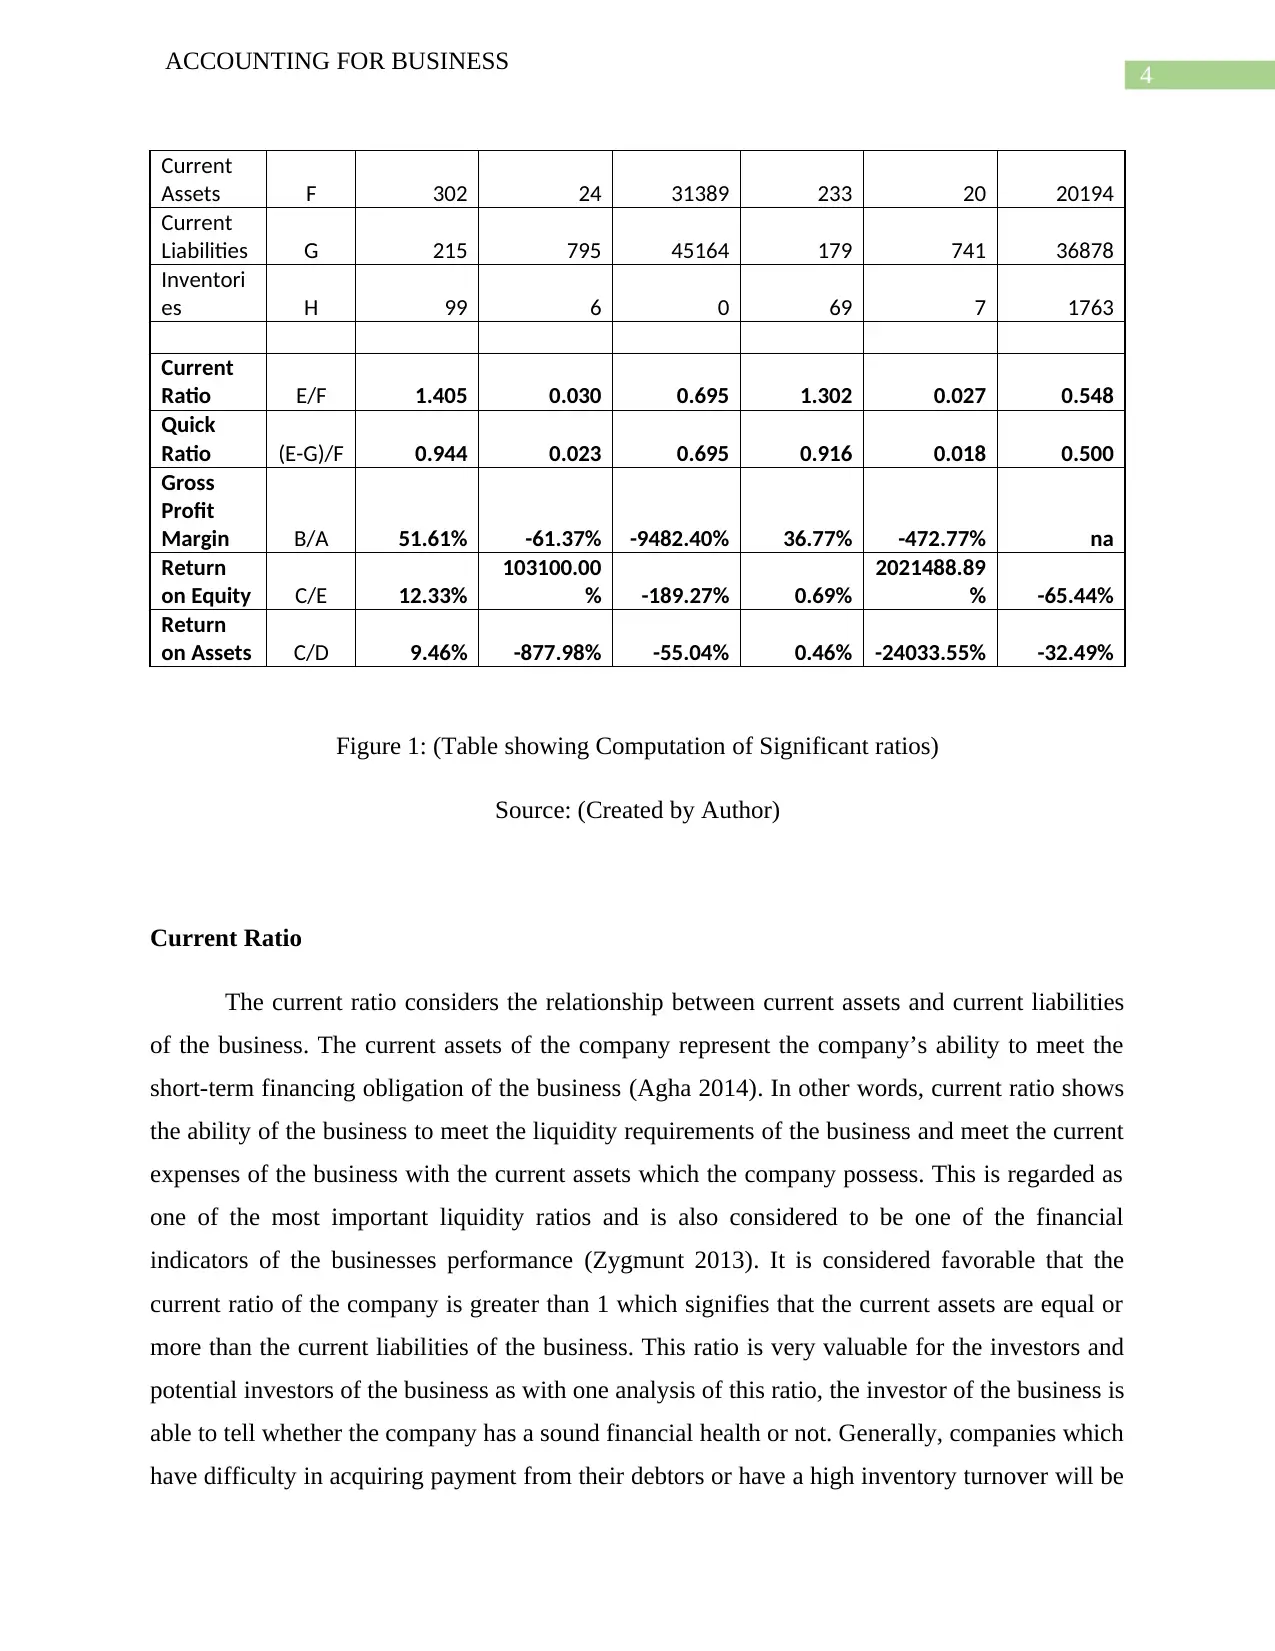
Ratio E/F 1.405 0.030 0.695 1.302 0.027 0.548
Quick
Ratio (E-G)/F 0.944 0.023 0.695 0.916 0.018 0.500
Gross
Profit
Margin B/A 51.61% -61.37% -9482.40% 36.77% -472.77% na
Return
on Equity C/E 12.33%
103100.00
% -189.27% 0.69%
2021488.89
% -65.44%
Return
on Assets C/D 9.46% -877.98% -55.04% 0.46% -24033.55% -32.49%
Figure 1: (Table showing Computation of Significant ratios)
Source: (Created by Author)
Current Ratio
The current ratio considers the relationship between current assets and current liabilities
of the business. The current assets of the company represent the company’s ability to meet the
short-term financing obligation of the business (Agha 2014). In other words, current ratio shows
the ability of the business to meet the liquidity requirements of the business and meet the current
expenses of the business with the current assets which the company possess. This is regarded as
one of the most important liquidity ratios and is also considered to be one of the financial
indicators of the businesses performance (Zygmunt 2013). It is considered favorable that the
current ratio of the company is greater than 1 which signifies that the current assets are equal or
more than the current liabilities of the business. This ratio is very valuable for the investors and
potential investors of the business as with one analysis of this ratio, the investor of the business is
able to tell whether the company has a sound financial health or not. Generally, companies which
have difficulty in acquiring payment from their debtors or have a high inventory turnover will be
ACCOUNTING FOR BUSINESS
Current
Assets F 302 24 31389 233 20 20194
Current
Liabilities G 215 795 45164 179 741 36878
Inventori
es H 99 6 0 69 7 1763
Current
Ratio E/F 1.405 0.030 0.695 1.302 0.027 0.548
Quick
Ratio (E-G)/F 0.944 0.023 0.695 0.916 0.018 0.500
Gross
Profit
Margin B/A 51.61% -61.37% -9482.40% 36.77% -472.77% na
Return
on Equity C/E 12.33%
103100.00
% -189.27% 0.69%
2021488.89
% -65.44%
Return
on Assets C/D 9.46% -877.98% -55.04% 0.46% -24033.55% -32.49%
Figure 1: (Table showing Computation of Significant ratios)
Source: (Created by Author)
Current Ratio
The current ratio considers the relationship between current assets and current liabilities
of the business. The current assets of the company represent the company’s ability to meet the
short-term financing obligation of the business (Agha 2014). In other words, current ratio shows
the ability of the business to meet the liquidity requirements of the business and meet the current
expenses of the business with the current assets which the company possess. This is regarded as
one of the most important liquidity ratios and is also considered to be one of the financial
indicators of the businesses performance (Zygmunt 2013). It is considered favorable that the
current ratio of the company is greater than 1 which signifies that the current assets are equal or
more than the current liabilities of the business. This ratio is very valuable for the investors and
potential investors of the business as with one analysis of this ratio, the investor of the business is
able to tell whether the company has a sound financial health or not. Generally, companies which
have difficulty in acquiring payment from their debtors or have a high inventory turnover will be
5
ACCOUNTING FOR BUSINESS
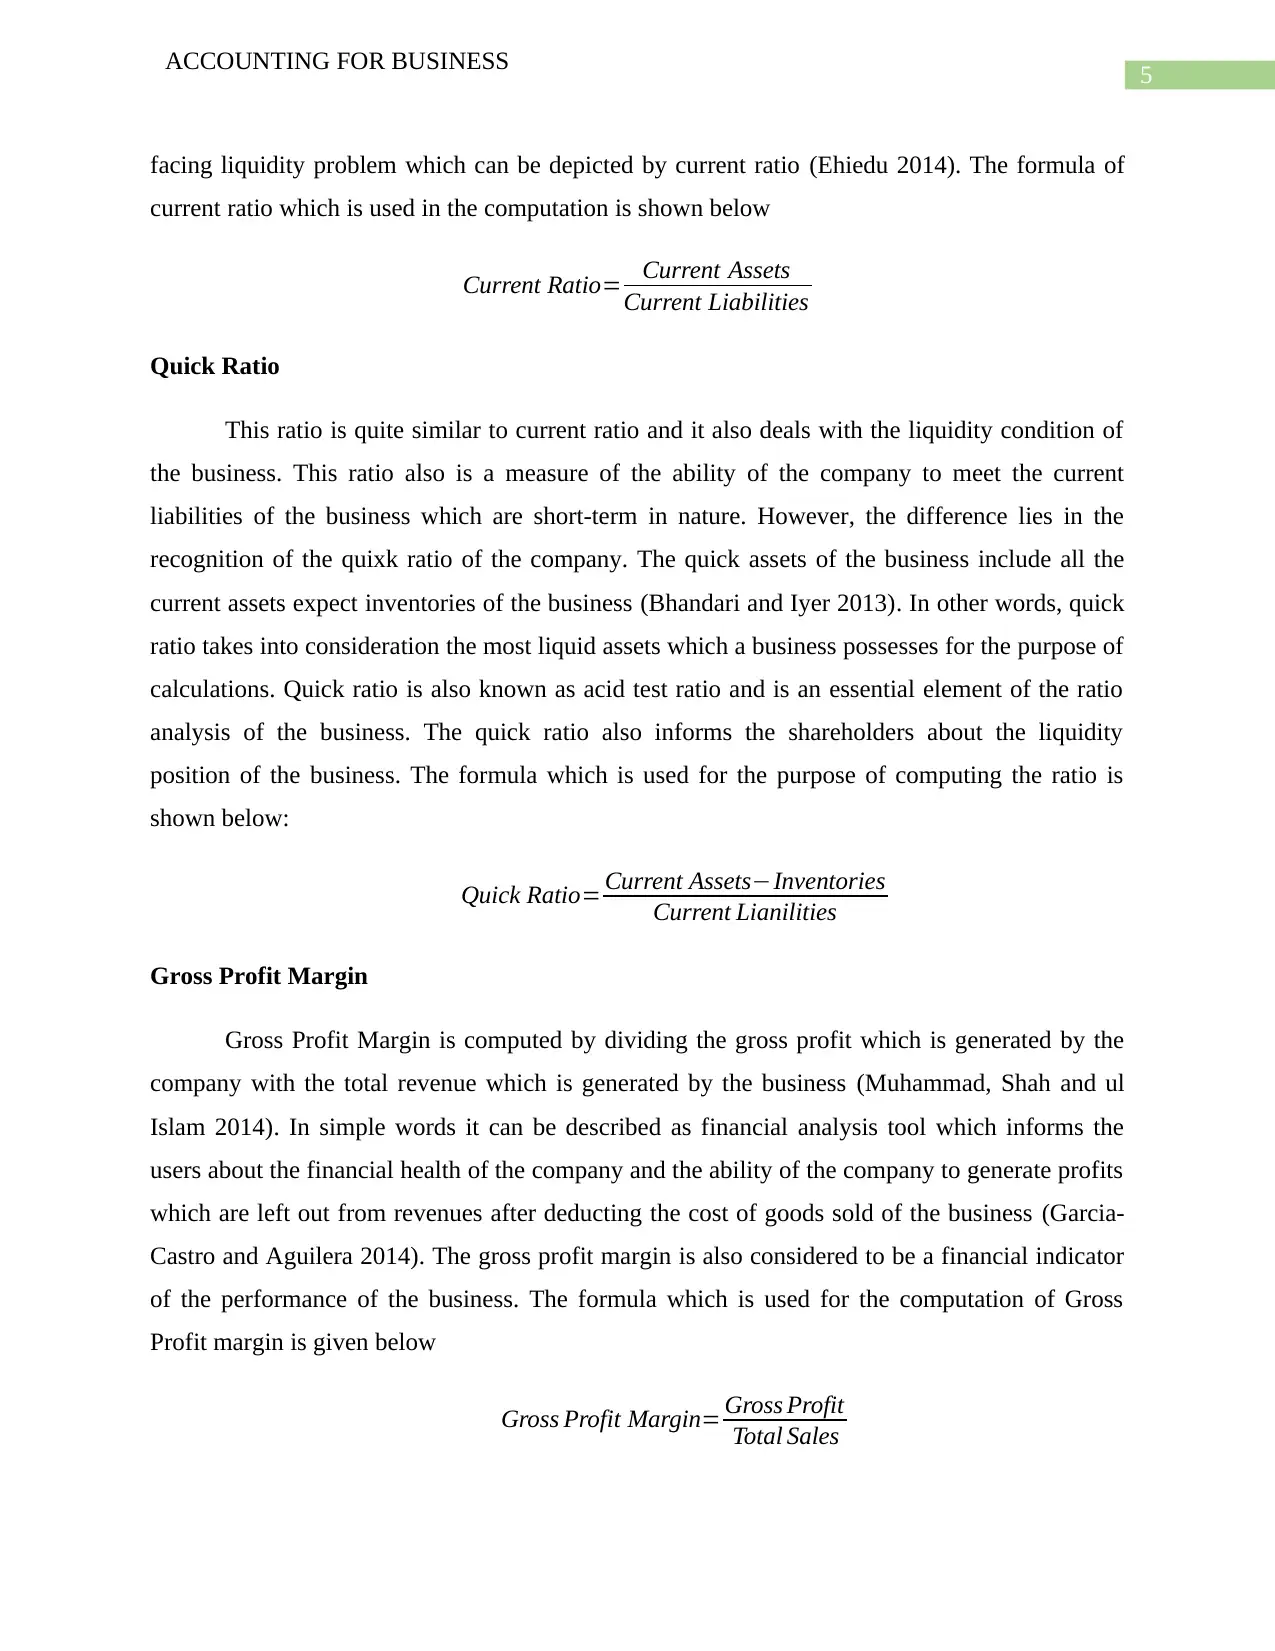
facing liquidity problem which can be depicted by current ratio (Ehiedu 2014). The formula of
current ratio which is used in the computation is shown below
Current Ratio= Current Assets
Current Liabilities
Quick Ratio
This ratio is quite similar to current ratio and it also deals with the liquidity condition of
the business. This ratio also is a measure of the ability of the company to meet the current
liabilities of the business which are short-term in nature. However, the difference lies in the
recognition of the quixk ratio of the company. The quick assets of the business include all the
current assets expect inventories of the business (Bhandari and Iyer 2013). In other words, quick
ratio takes into consideration the most liquid assets which a business possesses for the purpose of
calculations. Quick ratio is also known as acid test ratio and is an essential element of the ratio
analysis of the business. The quick ratio also informs the shareholders about the liquidity
position of the business. The formula which is used for the purpose of computing the ratio is
shown below:
Quick Ratio= Current Assets−Inventories
Current Lianilities
Gross Profit Margin
Gross Profit Margin is computed by dividing the gross profit which is generated by the
company with the total revenue which is generated by the business (Muhammad, Shah and ul
Islam 2014). In simple words it can be described as financial analysis tool which informs the
users about the financial health of the company and the ability of the company to generate profits
which are left out from revenues after deducting the cost of goods sold of the business (Garcia-
Castro and Aguilera 2014). The gross profit margin is also considered to be a financial indicator
of the performance of the business. The formula which is used for the computation of Gross
Profit margin is given below
Gross Profit Margin= Gross Profit
Total Sales
ACCOUNTING FOR BUSINESS
facing liquidity problem which can be depicted by current ratio (Ehiedu 2014). The formula of
current ratio which is used in the computation is shown below
Current Ratio= Current Assets
Current Liabilities
Quick Ratio
This ratio is quite similar to current ratio and it also deals with the liquidity condition of
the business. This ratio also is a measure of the ability of the company to meet the current
liabilities of the business which are short-term in nature. However, the difference lies in the
recognition of the quixk ratio of the company. The quick assets of the business include all the
current assets expect inventories of the business (Bhandari and Iyer 2013). In other words, quick
ratio takes into consideration the most liquid assets which a business possesses for the purpose of
calculations. Quick ratio is also known as acid test ratio and is an essential element of the ratio
analysis of the business. The quick ratio also informs the shareholders about the liquidity
position of the business. The formula which is used for the purpose of computing the ratio is
shown below:
Quick Ratio= Current Assets−Inventories
Current Lianilities
Gross Profit Margin
Gross Profit Margin is computed by dividing the gross profit which is generated by the
company with the total revenue which is generated by the business (Muhammad, Shah and ul
Islam 2014). In simple words it can be described as financial analysis tool which informs the
users about the financial health of the company and the ability of the company to generate profits
which are left out from revenues after deducting the cost of goods sold of the business (Garcia-
Castro and Aguilera 2014). The gross profit margin is also considered to be a financial indicator
of the performance of the business. The formula which is used for the computation of Gross
Profit margin is given below
Gross Profit Margin= Gross Profit
Total Sales
⊘ This is a preview!⊘
Do you want full access?
Subscribe today to unlock all pages.
Trusted by 1+ million students worldwide
6
ACCOUNTING FOR BUSINESS
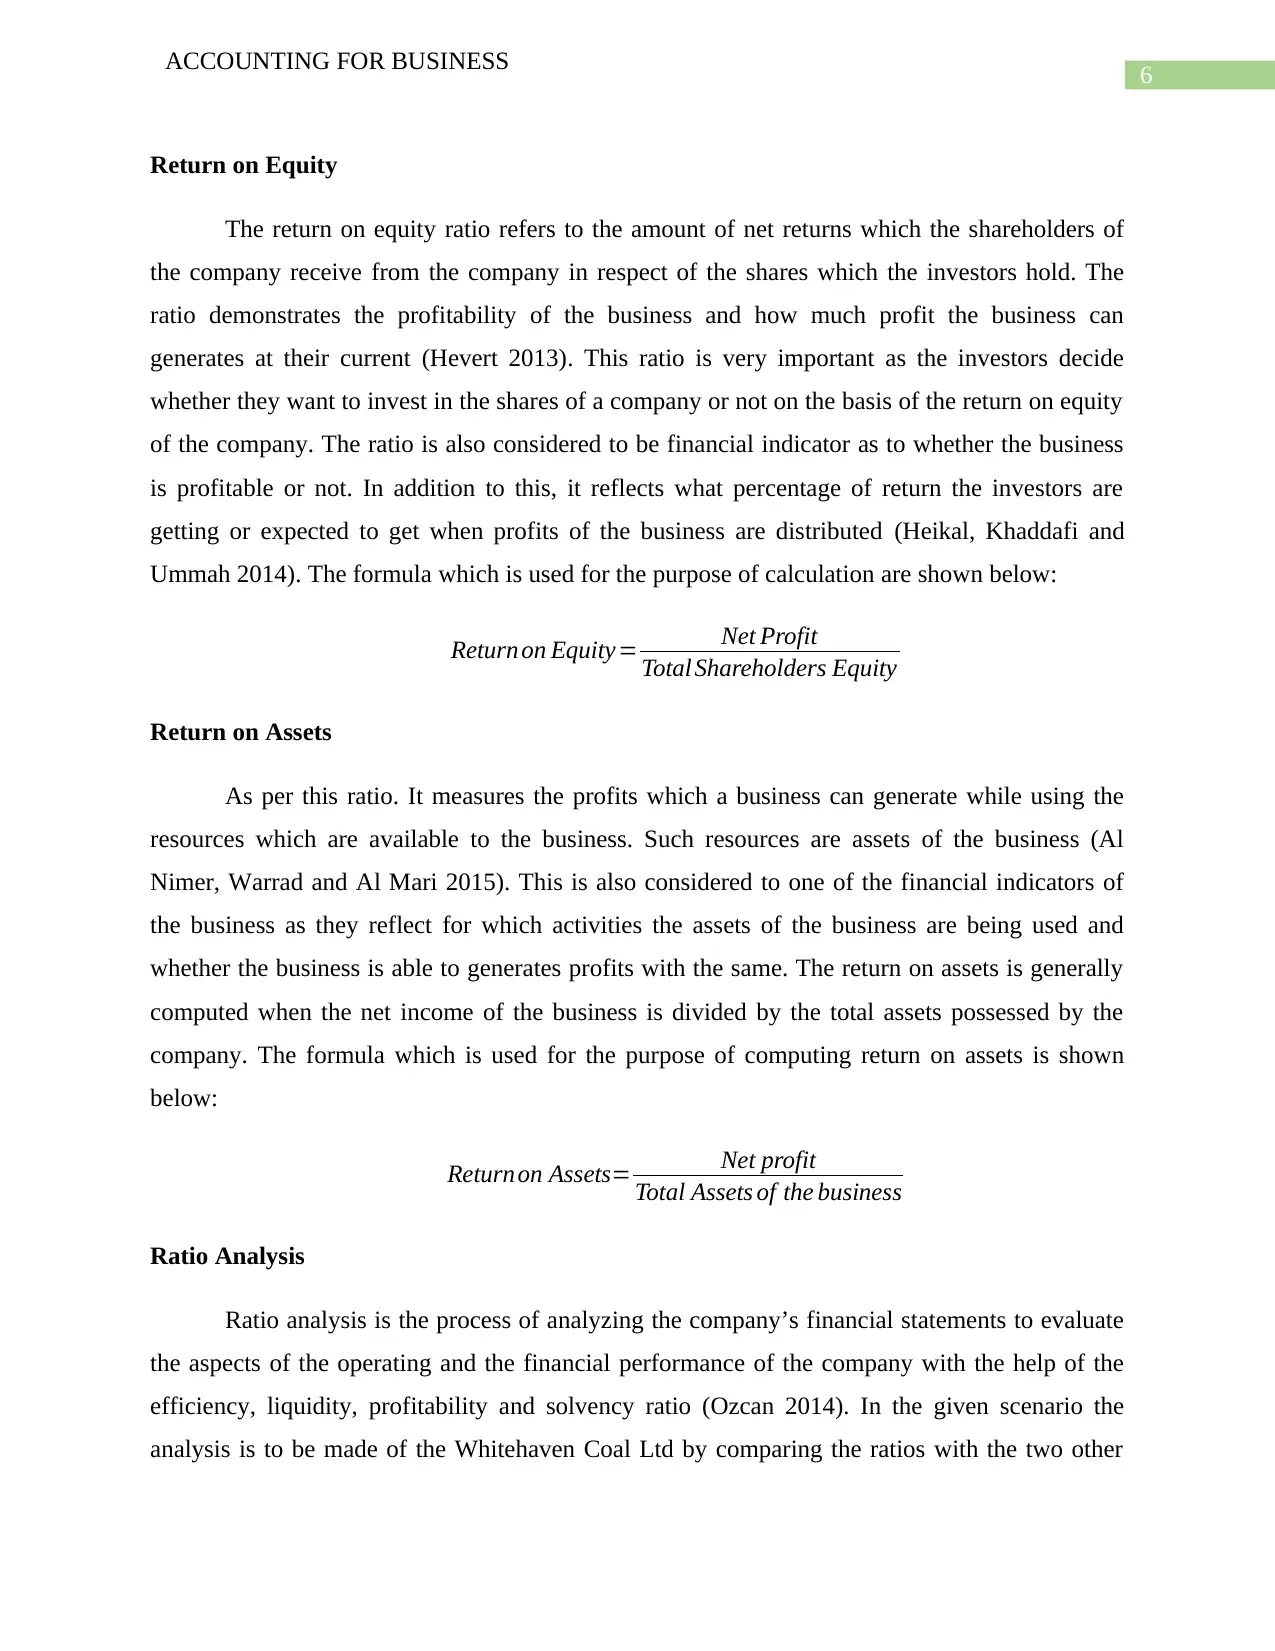
Return on Equity
The return on equity ratio refers to the amount of net returns which the shareholders of
the company receive from the company in respect of the shares which the investors hold. The
ratio demonstrates the profitability of the business and how much profit the business can
generates at their current (Hevert 2013). This ratio is very important as the investors decide
whether they want to invest in the shares of a company or not on the basis of the return on equity
of the company. The ratio is also considered to be financial indicator as to whether the business
is profitable or not. In addition to this, it reflects what percentage of return the investors are
getting or expected to get when profits of the business are distributed (Heikal, Khaddafi and
Ummah 2014). The formula which is used for the purpose of calculation are shown below:
Return on Equity= Net Profit
Total Shareholders Equity
Return on Assets
As per this ratio. It measures the profits which a business can generate while using the
resources which are available to the business. Such resources are assets of the business (Al
Nimer, Warrad and Al Mari 2015). This is also considered to one of the financial indicators of
the business as they reflect for which activities the assets of the business are being used and
whether the business is able to generates profits with the same. The return on assets is generally
computed when the net income of the business is divided by the total assets possessed by the
company. The formula which is used for the purpose of computing return on assets is shown
below:
Return on Assets= Net profit
Total Assets of the business
Ratio Analysis
Ratio analysis is the process of analyzing the company’s financial statements to evaluate
the aspects of the operating and the financial performance of the company with the help of the
efficiency, liquidity, profitability and solvency ratio (Ozcan 2014). In the given scenario the
analysis is to be made of the Whitehaven Coal Ltd by comparing the ratios with the two other
ACCOUNTING FOR BUSINESS
Return on Equity
The return on equity ratio refers to the amount of net returns which the shareholders of
the company receive from the company in respect of the shares which the investors hold. The
ratio demonstrates the profitability of the business and how much profit the business can
generates at their current (Hevert 2013). This ratio is very important as the investors decide
whether they want to invest in the shares of a company or not on the basis of the return on equity
of the company. The ratio is also considered to be financial indicator as to whether the business
is profitable or not. In addition to this, it reflects what percentage of return the investors are
getting or expected to get when profits of the business are distributed (Heikal, Khaddafi and
Ummah 2014). The formula which is used for the purpose of calculation are shown below:
Return on Equity= Net Profit
Total Shareholders Equity
Return on Assets
As per this ratio. It measures the profits which a business can generate while using the
resources which are available to the business. Such resources are assets of the business (Al
Nimer, Warrad and Al Mari 2015). This is also considered to one of the financial indicators of
the business as they reflect for which activities the assets of the business are being used and
whether the business is able to generates profits with the same. The return on assets is generally
computed when the net income of the business is divided by the total assets possessed by the
company. The formula which is used for the purpose of computing return on assets is shown
below:
Return on Assets= Net profit
Total Assets of the business
Ratio Analysis
Ratio analysis is the process of analyzing the company’s financial statements to evaluate
the aspects of the operating and the financial performance of the company with the help of the
efficiency, liquidity, profitability and solvency ratio (Ozcan 2014). In the given scenario the
analysis is to be made of the Whitehaven Coal Ltd by comparing the ratios with the two other
Paraphrase This Document
Need a fresh take? Get an instant paraphrase of this document with our AI Paraphraser
7
ACCOUNTING FOR BUSINESS
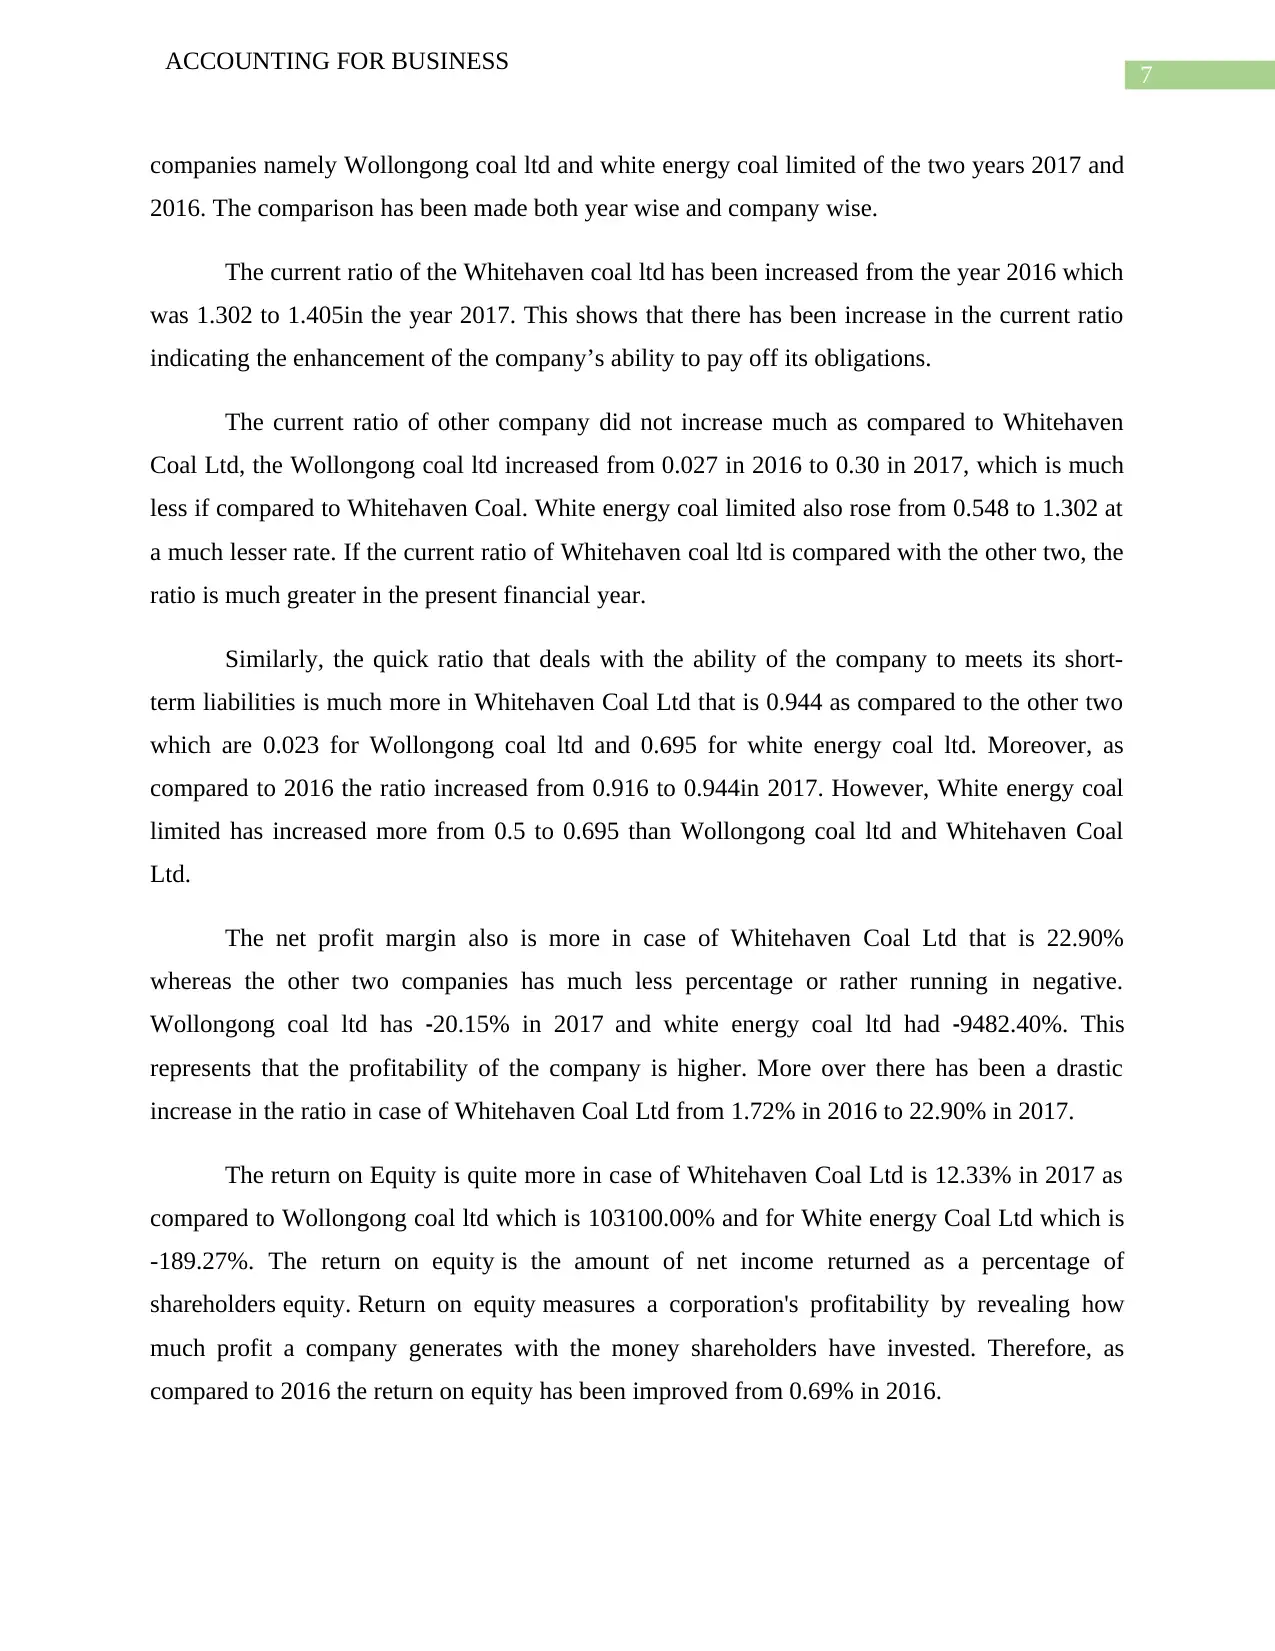
companies namely Wollongong coal ltd and white energy coal limited of the two years 2017 and
2016. The comparison has been made both year wise and company wise.
The current ratio of the Whitehaven coal ltd has been increased from the year 2016 which
was 1.302 to 1.405in the year 2017. This shows that there has been increase in the current ratio
indicating the enhancement of the company’s ability to pay off its obligations.
The current ratio of other company did not increase much as compared to Whitehaven
Coal Ltd, the Wollongong coal ltd increased from 0.027 in 2016 to 0.30 in 2017, which is much
less if compared to Whitehaven Coal. White energy coal limited also rose from 0.548 to 1.302 at
a much lesser rate. If the current ratio of Whitehaven coal ltd is compared with the other two, the
ratio is much greater in the present financial year.
Similarly, the quick ratio that deals with the ability of the company to meets its short-
term liabilities is much more in Whitehaven Coal Ltd that is 0.944 as compared to the other two
which are 0.023 for Wollongong coal ltd and 0.695 for white energy coal ltd. Moreover, as
compared to 2016 the ratio increased from 0.916 to 0.944in 2017. However, White energy coal
limited has increased more from 0.5 to 0.695 than Wollongong coal ltd and Whitehaven Coal
Ltd.
The net profit margin also is more in case of Whitehaven Coal Ltd that is 22.90%
whereas the other two companies has much less percentage or rather running in negative.
Wollongong coal ltd has -20.15% in 2017 and white energy coal ltd had -9482.40%. This
represents that the profitability of the company is higher. More over there has been a drastic
increase in the ratio in case of Whitehaven Coal Ltd from 1.72% in 2016 to 22.90% in 2017.
The return on Equity is quite more in case of Whitehaven Coal Ltd is 12.33% in 2017 as
compared to Wollongong coal ltd which is 103100.00% and for White energy Coal Ltd which is
-189.27%. The return on equity is the amount of net income returned as a percentage of
shareholders equity. Return on equity measures a corporation's profitability by revealing how
much profit a company generates with the money shareholders have invested. Therefore, as
compared to 2016 the return on equity has been improved from 0.69% in 2016.
ACCOUNTING FOR BUSINESS
companies namely Wollongong coal ltd and white energy coal limited of the two years 2017 and
2016. The comparison has been made both year wise and company wise.
The current ratio of the Whitehaven coal ltd has been increased from the year 2016 which
was 1.302 to 1.405in the year 2017. This shows that there has been increase in the current ratio
indicating the enhancement of the company’s ability to pay off its obligations.
The current ratio of other company did not increase much as compared to Whitehaven
Coal Ltd, the Wollongong coal ltd increased from 0.027 in 2016 to 0.30 in 2017, which is much
less if compared to Whitehaven Coal. White energy coal limited also rose from 0.548 to 1.302 at
a much lesser rate. If the current ratio of Whitehaven coal ltd is compared with the other two, the
ratio is much greater in the present financial year.
Similarly, the quick ratio that deals with the ability of the company to meets its short-
term liabilities is much more in Whitehaven Coal Ltd that is 0.944 as compared to the other two
which are 0.023 for Wollongong coal ltd and 0.695 for white energy coal ltd. Moreover, as
compared to 2016 the ratio increased from 0.916 to 0.944in 2017. However, White energy coal
limited has increased more from 0.5 to 0.695 than Wollongong coal ltd and Whitehaven Coal
Ltd.
The net profit margin also is more in case of Whitehaven Coal Ltd that is 22.90%
whereas the other two companies has much less percentage or rather running in negative.
Wollongong coal ltd has -20.15% in 2017 and white energy coal ltd had -9482.40%. This
represents that the profitability of the company is higher. More over there has been a drastic
increase in the ratio in case of Whitehaven Coal Ltd from 1.72% in 2016 to 22.90% in 2017.
The return on Equity is quite more in case of Whitehaven Coal Ltd is 12.33% in 2017 as
compared to Wollongong coal ltd which is 103100.00% and for White energy Coal Ltd which is
-189.27%. The return on equity is the amount of net income returned as a percentage of
shareholders equity. Return on equity measures a corporation's profitability by revealing how
much profit a company generates with the money shareholders have invested. Therefore, as
compared to 2016 the return on equity has been improved from 0.69% in 2016.
8
ACCOUNTING FOR BUSINESS
Return on assets that represents the profit percentage a company earns in relation to its
overall resources is 9.46% for Whitehaven Coal Ltd which is much higher as compared to the
other two company which is -877.98% for Wollongong coal ltd -55.04% for White energy Coal
Ltd. Therefore, Whitehaven earns more profit. Moreover, there has been a rise in the return on
assets from 2016 which was 0.46%. The rate of increase is also more than White Energy Coal
Ltd and Wollongong coal ltd.
⊘ This is a preview!⊘
Do you want full access?
Subscribe today to unlock all pages.
Trusted by 1+ million students worldwide
9
ACCOUNTING FOR BUSINESS
Reference
Agha, H., 2014. Impact of working capital management on profitability. European Scientific
Journal, ESJ, 10(1).
Al Nimer, M., Warrad, L. and Al Mari, R., 2015. The Impact of liquidity on Jordanian banks
profitability through return on assets. European Journal of Business and Management, 7(7),
pp.229-232.
Bhandari, S.B. and Iyer, R., 2013. Predicting business failure using cash flow statement based
measures. Managerial Finance, 39(7), pp.667-676.
Delen, D., Kuzey, C. and Uyar, A., 2013. Measuring firm performance using financial ratios: A
decision tree approach. Expert Systems with Applications, 40(10), pp.3970-3983.
Ehiedu, V.C., 2014. The impact of liquidity on profitability of some selected companies: The
financial statement analysis (FSA) approach. Research Journal of Finance and Accounting, 5(5),
pp.81-90.
Garcia-Castro, R. and Aguilera, R.V., 2014. Family involvement in business and financial
performance: A set-theoretic cross-national inquiry. Journal of Family Business Strategy, 5(1),
pp.85-96.
Heikal, M., Khaddafi, M. and Ummah, A., 2014. Influence analysis of return on assets (ROA),
return on equity (ROE), net profit margin (NPM), debt to equity ratio (DER), and current ratio
(CR), against corporate profit growth in automotive in Indonesia Stock Exchange. International
Journal of Academic Research in Business and Social Sciences, 4(12), p.101.
Hevert, S.R.B., 2013. Return on Equity.
Muhammad, H., Shah, B. and ul Islam, Z., 2014. The impact of capital structure on firm
performance: Evidence from Pakistan. Journal of Industrial Distribution & Business, 5(2),
pp.13-20.
Paraphrase This Document
Need a fresh take? Get an instant paraphrase of this document with our AI Paraphraser

10
ACCOUNTING FOR BUSINESS
Ozcan, Y.A., 2014. Evaluation of Performance in Health Care. In Health Care Benchmarking
and Performance Evaluation(pp. 3-14). Springer, Boston, MA.
Zygmunt, J., 2013, March. Does liquidity impact on profitability. In Conference of informatics
and management sciences, March (pp. 38-49).
1 out of 11
Related Documents


Your All-in-One AI-Powered Toolkit for Academic Success.
+13062052269
info@desklib.com
Available 24*7 on WhatsApp / Email
![[object Object]](/_next/static/media/star-bottom.7253800d.svg)
Unlock your academic potential
Copyright © 2020–2026 A2Z Services. All Rights Reserved. Developed and managed by ZUCOL.