Detailed Financial Ratio Analysis Report for Whole Foods Market Inc.
VerifiedAdded on 2021/04/21
|12
|1650
|29
Report
AI Summary
This report presents a financial analysis of Whole Foods Market Inc., an American supermarket chain, focusing on ratio comparisons over the past five years. The analysis examines profitability, efficiency, turnover, and liquidity ratios, comparing them with industry averages and conducting trend analysis. The report includes the formulas for each ratio and draws conclusions regarding the company's financial strength, ability to raise capital, working capital management, dividend policies, shareholder relations, and the expertise of its financial managers. The analysis reveals that while the company performs well in asset returns, its overall return on equity lags behind the industry average, with decreasing profitability margins. The company's turnover ratios are mixed, and its liquidity ratios are manageable but below industry averages. The report also assesses the company's solvency, capital structure, and valuation ratios, concluding with an evaluation of its ability to raise short and long-term capital, manage working capital, and its dividend payout policies. The report also addresses the company's relationship with shareholders and the training of its financial managers.
STRATEGIC
MANAGEMENT
ASSIGNMENT
MANAGEMENT
ASSIGNMENT
Paraphrase This Document
Need a fresh take? Get an instant paraphrase of this document with our AI Paraphraser
1
By student name
Professor
University
Date: 07 March 2018.
1 | P a g e
By student name
Professor
University
Date: 07 March 2018.
1 | P a g e
2
Executive Summary
In the given report, a financial analsysis needs to be carried out for an American supermarket chain
called Whole Foods Market Inc.. For the same, a ratio comparison has been made for the last 5 years
and the same has been compared with the industry ratios as well in terms of profitability, efficiency,
turnover, short term liquidity and long term liquidity. Trend analysis has also been done to show how
the company has been progressing over the years. The formula for calculating each of the ratios has also
been mentioned and conclusions have been drawn with respect to whether the company is financially
weak or strong, whether it can raise short term and long term capital, does it has sufficient working
capital, is its dividend paying policies in line with industry and does it maintains a good relation with the
shareholders and the investors and finally if the firms’ financial managers well experienced and well
trained.
2 | P a g e
⊘ This is a preview!⊘
Do you want full access?
Subscribe today to unlock all pages.
Trusted by 1+ million students worldwide
3
Contents
Introduction.................................................................................................................................................4
Financials of the company...........................................................................................................................5
Analysis and explanation.............................................................................................................................7
References.................................................................................................................................................11
3 | P a g e
Paraphrase This Document
Need a fresh take? Get an instant paraphrase of this document with our AI Paraphraser
4
Introduction
The given company World Foods Market Incorporation is one of the leading American supermarket
chain that is specializing in selling the food products without colours, flavours, sweeteners, artificial
preservatives and hydrogenated fats. The company is having 473 stores in United Kingdom and North
America. It has over 91000 employees and in 2017, it got merged with Amazon.com as it showed
declining sales and profit for 6th consecutive year. The financial and trend analysis of the same has been
done using ratio analysis (Goldmann, 2016).
4 | P a g e
5
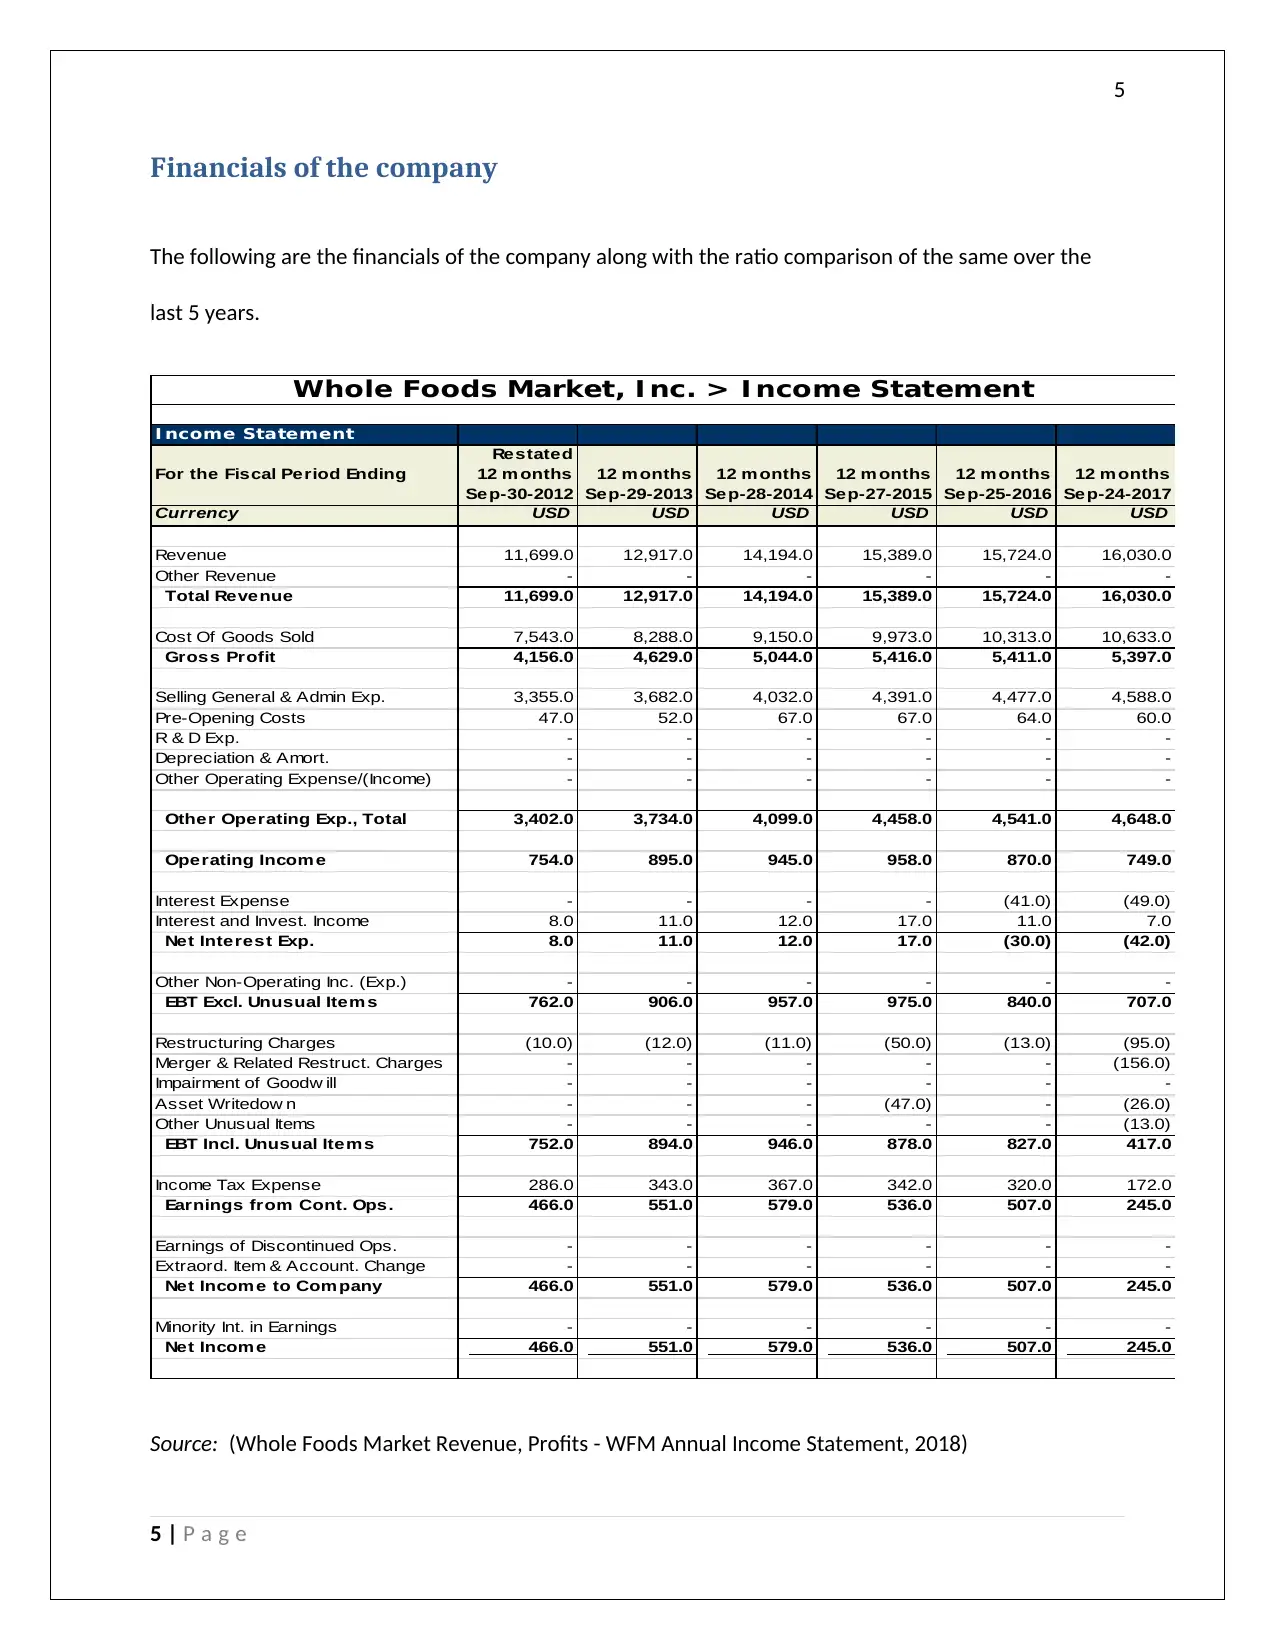
Financials of the company
The following are the financials of the company along with the ratio comparison of the same over the
last 5 years.
I ncome Statement
For the Fiscal Period Ending
Restated
12 m onths
Sep-30-2012
12 m onths
Sep-29-2013
12 m onths
Sep-28-2014
12 m onths
Sep-27-2015
12 m onths
Sep-25-2016
12 m onths
Sep-24-2017
Currency USD USD USD USD USD USD
Revenue 11,699.0 12,917.0 14,194.0 15,389.0 15,724.0 16,030.0
Other Revenue - - - - - -
Total Revenue 11,699.0 12,917.0 14,194.0 15,389.0 15,724.0 16,030.0
Cost Of Goods Sold 7,543.0 8,288.0 9,150.0 9,973.0 10,313.0 10,633.0
Gross Profit 4,156.0 4,629.0 5,044.0 5,416.0 5,411.0 5,397.0
Selling General & Admin Exp. 3,355.0 3,682.0 4,032.0 4,391.0 4,477.0 4,588.0
Pre-Opening Costs 47.0 52.0 67.0 67.0 64.0 60.0
R & D Exp. - - - - - -
Depreciation & Amort. - - - - - -
Other Operating Expense/(Income) - - - - - -
Other Operating Exp., Total 3,402.0 3,734.0 4,099.0 4,458.0 4,541.0 4,648.0
Operating Incom e 754.0 895.0 945.0 958.0 870.0 749.0
Interest Expense - - - - (41.0) (49.0)
Interest and Invest. Income 8.0 11.0 12.0 17.0 11.0 7.0
Net Interest Exp. 8.0 11.0 12.0 17.0 (30.0) (42.0)
Other Non-Operating Inc. (Exp.) - - - - - -
EBT Excl. Unusual Item s 762.0 906.0 957.0 975.0 840.0 707.0
Restructuring Charges (10.0) (12.0) (11.0) (50.0) (13.0) (95.0)
Merger & Related Restruct. Charges - - - - - (156.0)
Impairment of Goodw ill - - - - - -
Asset Writedow n - - - (47.0) - (26.0)
Other Unusual Items - - - - - (13.0)
EBT Incl. Unusual Items 752.0 894.0 946.0 878.0 827.0 417.0
Income Tax Expense 286.0 343.0 367.0 342.0 320.0 172.0
Earnings from Cont. Ops. 466.0 551.0 579.0 536.0 507.0 245.0
Earnings of Discontinued Ops. - - - - - -
Extraord. Item & Account. Change - - - - - -
Net Incom e to Com pany 466.0 551.0 579.0 536.0 507.0 245.0
Minority Int. in Earnings - - - - - -
Net Incom e 466.0 551.0 579.0 536.0 507.0 245.0
Whole Foods Market, I nc. > I ncome Statement
Source: (Whole Foods Market Revenue, Profits - WFM Annual Income Statement, 2018)
5 | P a g e
⊘ This is a preview!⊘
Do you want full access?
Subscribe today to unlock all pages.
Trusted by 1+ million students worldwide
6
Balance Sheet
Balance Sheet as of: Restated
Sep-30-2012 Sep-29-2013 Sep-28-2014 Sep-27-2015 Sep-25-2016 Sep-24-2017
Currency USD USD USD USD USD USD
ASSETS
Cash And Equivalents 89.0 290.0 190.0 237.0 351.0 322.0
Short Term Investments 1,131.0 733.0 553.0 155.0 379.0 504.0
Total Cash & ST Investments 1,220.0 1,023.0 743.0 392.0 730.0 826.0
Accounts Receivable 197.0 188.0 198.0 218.0 242.0 242.0
Other Receivables - - - - - 124.0
Total Receivables 197.0 188.0 198.0 218.0 242.0 366.0
Inventory 374.0 414.0 441.0 500.0 517.0 471.0
Prepaid Exp. 77.0 93.0 97.0 70.0 123.0 95.0
Deferred Tax Assets, Curr. 132.0 151.0 168.0 199.0 197.0 215.0
Restricted Cash 103.0 111.0 109.0 127.0 122.0 124.0
Other Current Assets - - - 38.0 44.0 48.0
Total Current Assets 2,103.0 1,980.0 1,756.0 1,544.0 1,975.0 2,145.0
Gross Property, Plant & Equipment 4,049.0 4,512.0 5,309.0 5,854.0 6,414.0 6,797.0
Accumulated Depreciation (1,856.0) (2,084.0) (2,386.0) (2,691.0) (2,972.0) (3,283.0)
Net Property, Plant & Equipm ent 2,193.0 2,428.0 2,923.0 3,163.0 3,442.0 3,514.0
Long-term Investments 221.0 302.0 120.0 63.0 - 121.0
Goodw ill 663.0 679.0 708.0 710.0 710.0 710.0
Other Intangibles 62.0 65.0 81.0 79.0 74.0 68.0
Deferred Tax Assets, LT 43.0 72.0 132.0 144.0 100.0 74.0
Other Long-Term Assets 9.0 12.0 24.0 38.0 40.0 44.0
Total Assets 5,294.0 5,538.0 5,744.0 5,741.0 6,341.0 6,676.0
LIABILITIES
Accounts Payable 247.0 247.0 276.0 295.0 307.0 371.0
Accrued Exp. 422.0 502.0 531.0 606.0 587.0 595.0
Curr. Port. of LT Debt - - - - 3.0 -
Curr. Port. of Cap. Leases 1.0 1.0 2.0 3.0 - 2.0
Other Current Liabilities 307.0 338.0 448.0 348.0 444.0 387.0
Total Current Liabilities 977.0 1,088.0 1,257.0 1,252.0 1,341.0 1,355.0
Long-Term Debt - - - - 1,048.0 993.0
Capital Leases 23.0 26.0 60.0 62.0 - 88.0
Other Non-Current Liabilities 492.0 546.0 614.0 658.0 728.0 810.0
Total Liabilities 1,492.0 1,660.0 1,931.0 1,972.0 3,117.0 3,246.0
Common Stock 2,592.0 2,765.0 2,863.0 2,904.0 2,933.0 2,972.0
Additional Paid In Capital - - - - - -
Retained Earnings 1,233.0 1,265.0 1,668.0 2,017.0 2,349.0 496.0
Treasury Stock (28.0) (153.0) (711.0) (1,124.0) (2,026.0) -
Comprehensive Inc. and Other 5.0 1.0 (7.0) (28.0) (32.0) (38.0)
Total Com m on Equity 3,802.0 3,878.0 3,813.0 3,769.0 3,224.0 3,430.0
Total Equity 3,802.0 3,878.0 3,813.0 3,769.0 3,224.0 3,430.0
Total Liabilities And Equity 5,294.0 5,538.0 5,744.0 5,741.0 6,341.0 6,676.0
Whole Foods Market, I nc. > Balance Sheet
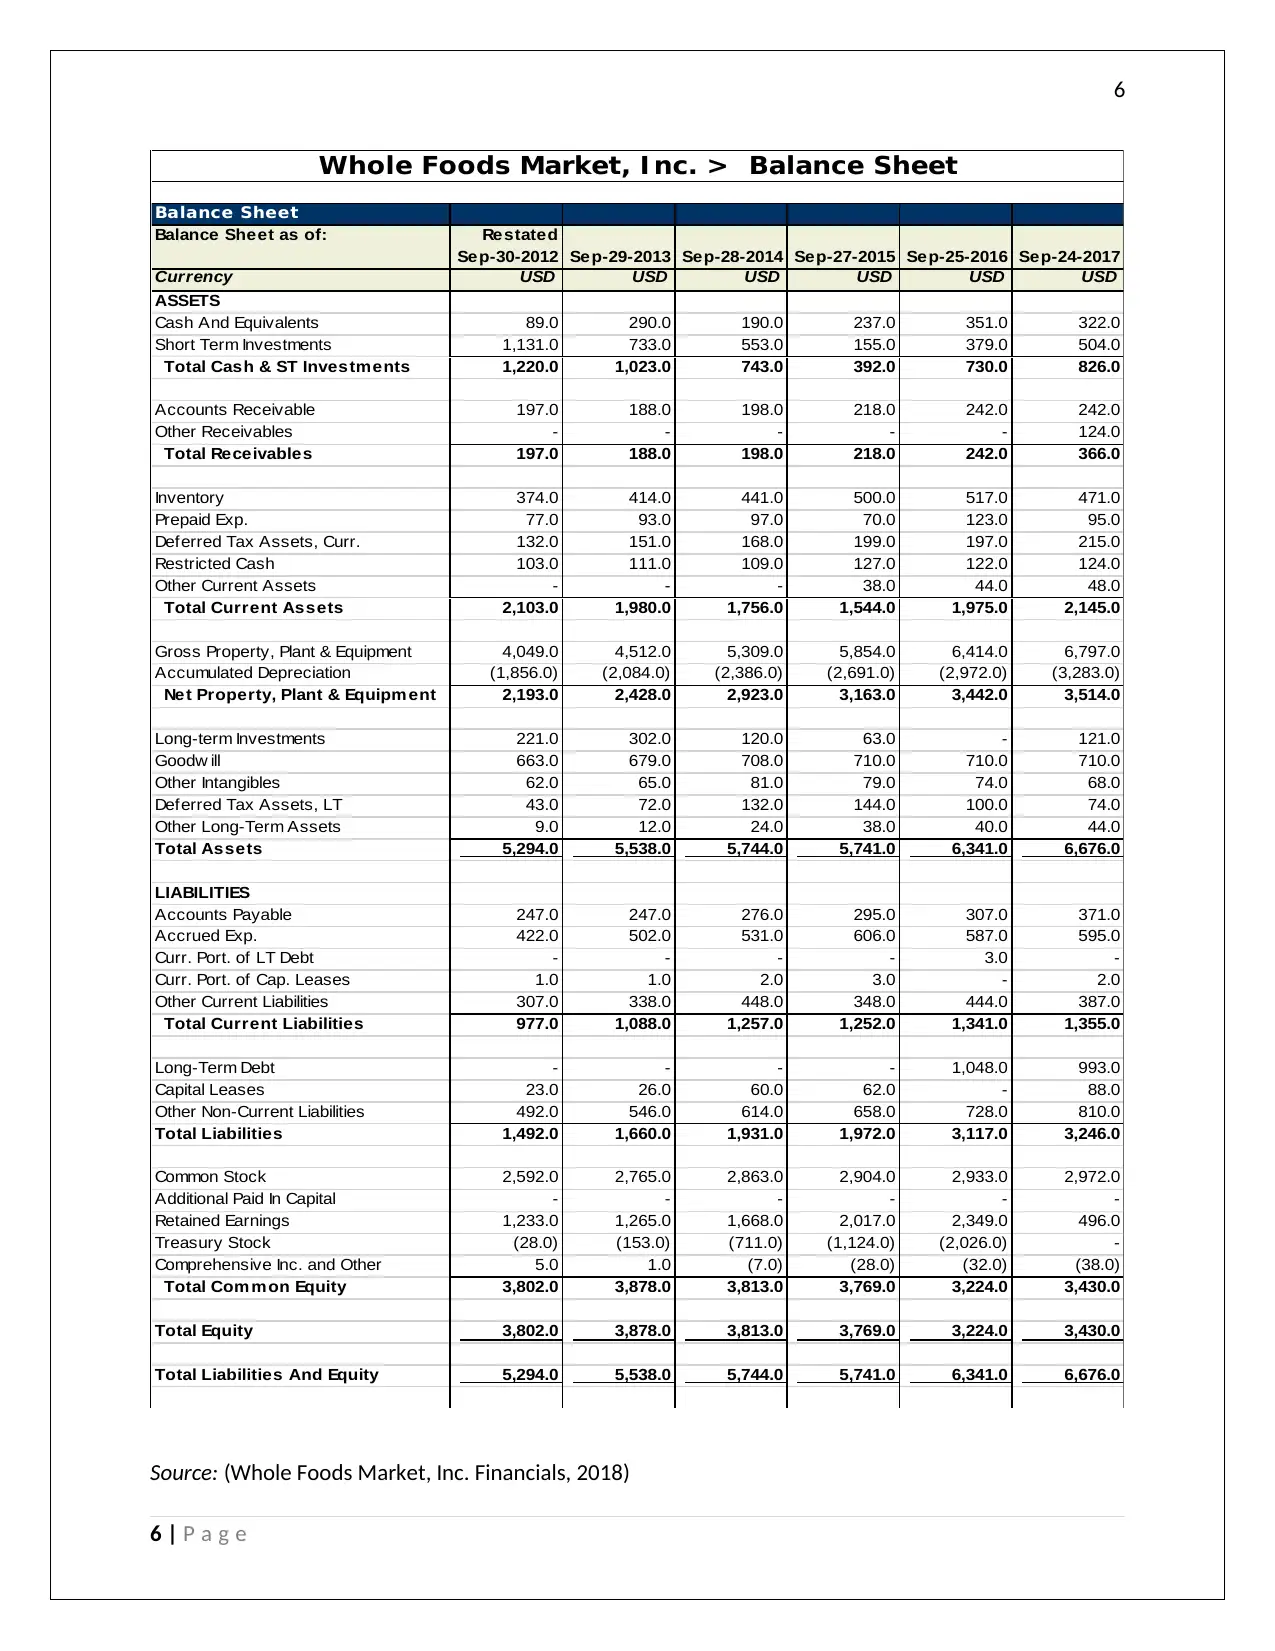
Source: (Whole Foods Market, Inc. Financials, 2018)
6 | P a g e
Balance Sheet
Balance Sheet as of: Restated
Sep-30-2012 Sep-29-2013 Sep-28-2014 Sep-27-2015 Sep-25-2016 Sep-24-2017
Currency USD USD USD USD USD USD
ASSETS
Cash And Equivalents 89.0 290.0 190.0 237.0 351.0 322.0
Short Term Investments 1,131.0 733.0 553.0 155.0 379.0 504.0
Total Cash & ST Investments 1,220.0 1,023.0 743.0 392.0 730.0 826.0
Accounts Receivable 197.0 188.0 198.0 218.0 242.0 242.0
Other Receivables - - - - - 124.0
Total Receivables 197.0 188.0 198.0 218.0 242.0 366.0
Inventory 374.0 414.0 441.0 500.0 517.0 471.0
Prepaid Exp. 77.0 93.0 97.0 70.0 123.0 95.0
Deferred Tax Assets, Curr. 132.0 151.0 168.0 199.0 197.0 215.0
Restricted Cash 103.0 111.0 109.0 127.0 122.0 124.0
Other Current Assets - - - 38.0 44.0 48.0
Total Current Assets 2,103.0 1,980.0 1,756.0 1,544.0 1,975.0 2,145.0
Gross Property, Plant & Equipment 4,049.0 4,512.0 5,309.0 5,854.0 6,414.0 6,797.0
Accumulated Depreciation (1,856.0) (2,084.0) (2,386.0) (2,691.0) (2,972.0) (3,283.0)
Net Property, Plant & Equipm ent 2,193.0 2,428.0 2,923.0 3,163.0 3,442.0 3,514.0
Long-term Investments 221.0 302.0 120.0 63.0 - 121.0
Goodw ill 663.0 679.0 708.0 710.0 710.0 710.0
Other Intangibles 62.0 65.0 81.0 79.0 74.0 68.0
Deferred Tax Assets, LT 43.0 72.0 132.0 144.0 100.0 74.0
Other Long-Term Assets 9.0 12.0 24.0 38.0 40.0 44.0
Total Assets 5,294.0 5,538.0 5,744.0 5,741.0 6,341.0 6,676.0
LIABILITIES
Accounts Payable 247.0 247.0 276.0 295.0 307.0 371.0
Accrued Exp. 422.0 502.0 531.0 606.0 587.0 595.0
Curr. Port. of LT Debt - - - - 3.0 -
Curr. Port. of Cap. Leases 1.0 1.0 2.0 3.0 - 2.0
Other Current Liabilities 307.0 338.0 448.0 348.0 444.0 387.0
Total Current Liabilities 977.0 1,088.0 1,257.0 1,252.0 1,341.0 1,355.0
Long-Term Debt - - - - 1,048.0 993.0
Capital Leases 23.0 26.0 60.0 62.0 - 88.0
Other Non-Current Liabilities 492.0 546.0 614.0 658.0 728.0 810.0
Total Liabilities 1,492.0 1,660.0 1,931.0 1,972.0 3,117.0 3,246.0
Common Stock 2,592.0 2,765.0 2,863.0 2,904.0 2,933.0 2,972.0
Additional Paid In Capital - - - - - -
Retained Earnings 1,233.0 1,265.0 1,668.0 2,017.0 2,349.0 496.0
Treasury Stock (28.0) (153.0) (711.0) (1,124.0) (2,026.0) -
Comprehensive Inc. and Other 5.0 1.0 (7.0) (28.0) (32.0) (38.0)
Total Com m on Equity 3,802.0 3,878.0 3,813.0 3,769.0 3,224.0 3,430.0
Total Equity 3,802.0 3,878.0 3,813.0 3,769.0 3,224.0 3,430.0
Total Liabilities And Equity 5,294.0 5,538.0 5,744.0 5,741.0 6,341.0 6,676.0
Whole Foods Market, I nc. > Balance Sheet
Source: (Whole Foods Market, Inc. Financials, 2018)
6 | P a g e
Paraphrase This Document
Need a fresh take? Get an instant paraphrase of this document with our AI Paraphraser
7
Ratios
For the Fiscal Period
Ending Formulas 12 m onths
Sep-30-2012
12 m onths
Sep-29-2013
12 m onths
Sep-28-2014
12 m onths
Sep-27-2015
12 m onths
Sep-25-2016
12 m onths
Sep-24-2017
Industry
Ratios
Profitability
Return on Assets % Net Profit/ Total Assets 9.8% 10.3% 10.5% 10.4% 9.0% 7.2% 10-12%
Return on Equity % Net profit to
shareholders/Equity
Shareholders' funds
13.7% 14.3% 15.1% 14.1% 14.5% 7.4% 18-20%
Return on Common Equity % Net Profit/ total sales 13.7% 14.3% 15.1% 14.1% 14.5% 7.4% 18-20%
Margin Analysis
Gross Margin % Gross Profit / Sales 35.5% 35.8% 35.5% 35.2% 34.4% 33.7% 40%
EBIT Margin % Operating Profit / Sales 6.4% 6.9% 6.7% 6.2% 5.5% 4.7% 12-15%
Net Income Margin % Net Profit / Sales 4.0% 4.3% 4.1% 3.5% 3.2% 1.5% 8-10%
Asset Turnover
Total Asset Turnover Sales / Total Assets 2.4x 2.4x 2.5x 2.7x 2.6x 2.5x 3-4 x
Fixed Asset Turnover Sales / Fixed Assets 5.6x 5.6x 5.3x 5.1x 4.8x 4.6x 8-10x
Accounts Receivable
Turnover
Sales / Accounts Receivables 62.8x 67.1x 73.5x 74.0x 68.4x 66.2x 60x
Inventory Turnover Sales / Inventory 21.2x 21.0x 21.4x 21.2x 20.3x 21.5x 24x
Short Term Liquidity
Current Ratio Current Assets/ current
Liabilities
2.2x 1.8x 1.4x 1.2x 1.5x 1.6x 2x
Quick Ratio Current Assets - Inventory -
Prepaid Expenses/ current
Liabilities
1.5x 1.1x 0.7x 0.5x 0.7x 0.9x 1x
Cash from Ops. to Curr. Liab. Working capital / Current
Liabilities
0.9x 0.9x 0.9x 0.9x 0.8x 0.8x 1x
Avg. Cash Conversion Cycle 365 / Time from raw material
to collection from debtors
11.5 11.9 11.6 11.7 12.7 10.8 18-20
Interest coverage Ratio EBIT / Interest Expenses NA NA NA NA 21.2x 15.3x 15-20x
Long Term Solvency
Total Debt/Equity Debt / Equity 0.6% 0.7% 1.6% 1.7% 32.6% 31.6% 200%
Total Debt/Capital Debt / (Debt + equity) 0.6% 0.7% 1.6% 1.7% 24.6% 24.0% 66.67%
Others
P/E ratio Price / EPS 34.42 33.30
Price/ Sales ratio Price / Sales 0.84 0.8-1
Price/ Book value Price / Book value per share 4x 5x-8x
Price/ Cash Flow ratio Price / Cash Flow Ratio 13.21x 20x
Whole Foods Market, I nc. > Ratios
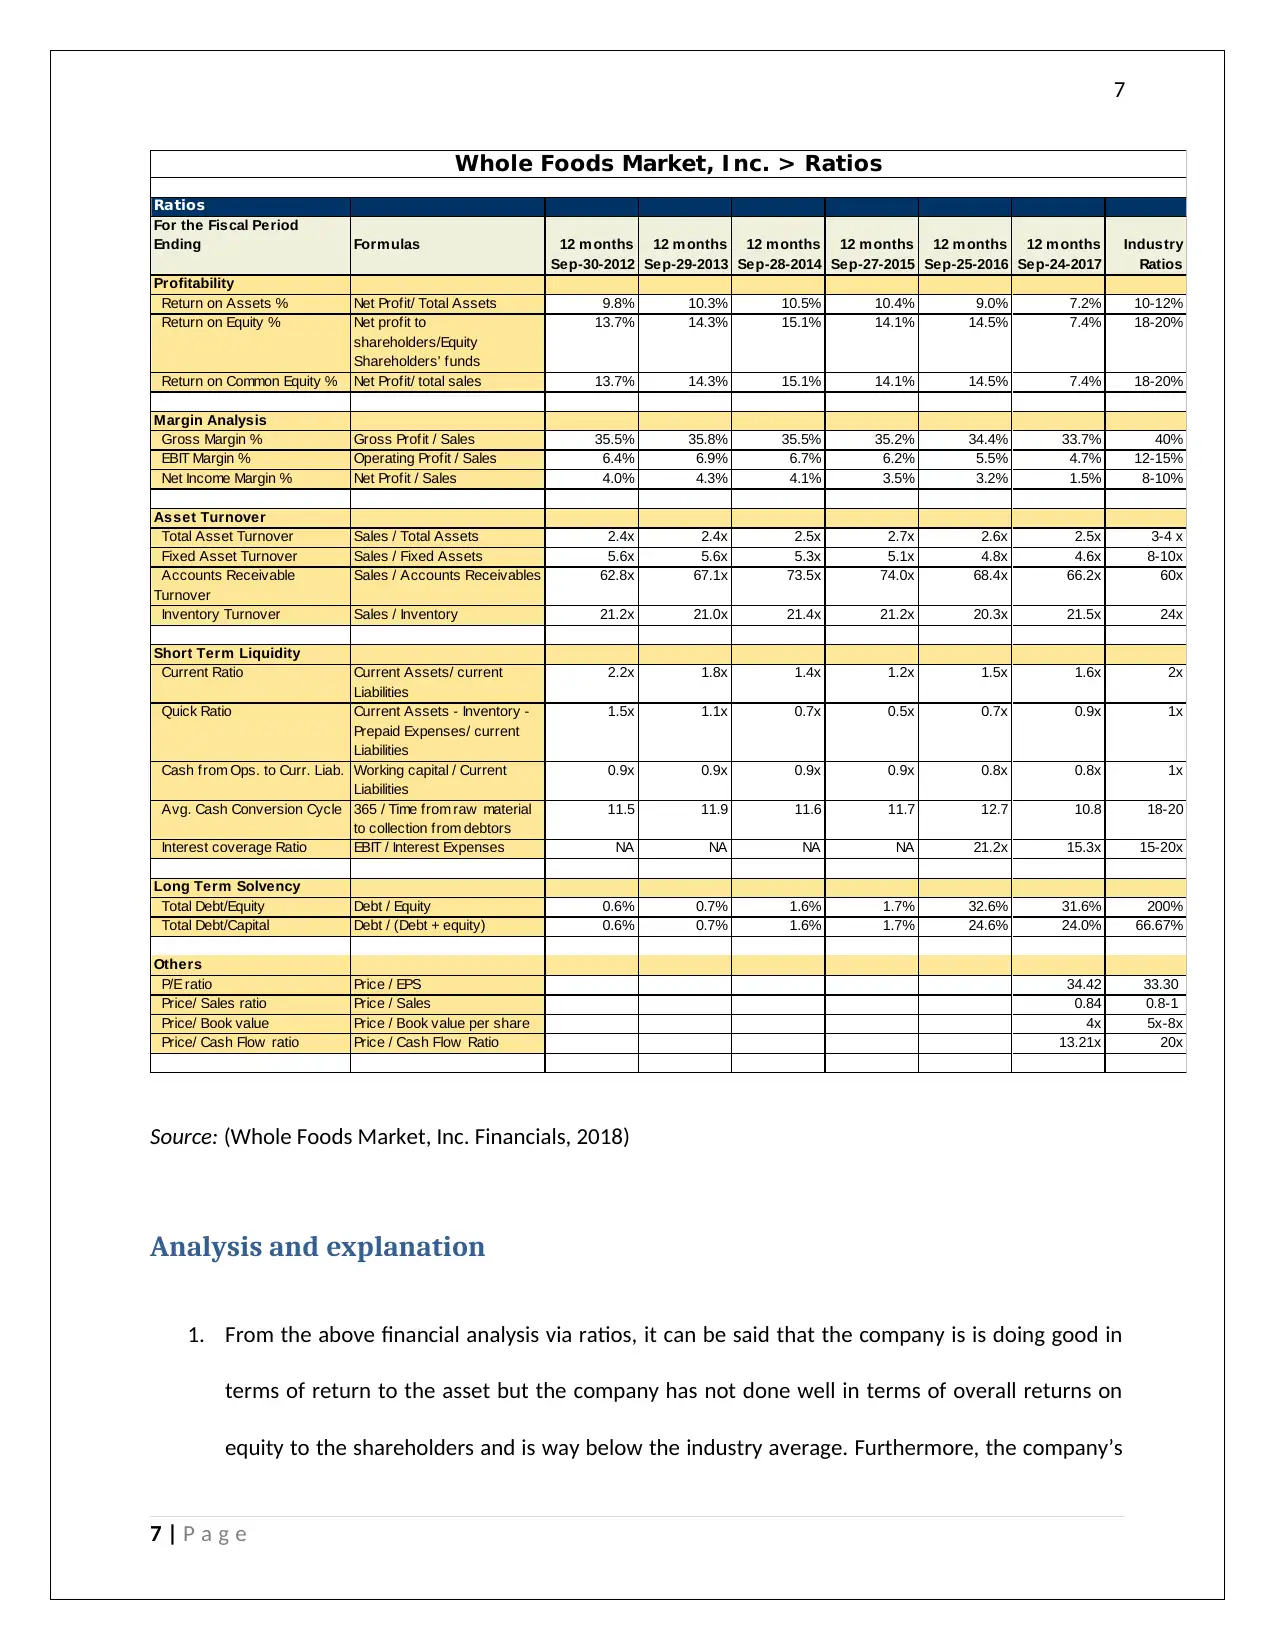
Source: (Whole Foods Market, Inc. Financials, 2018)
Analysis and explanation
1. From the above financial analysis via ratios, it can be said that the company is is doing good in
terms of return to the asset but the company has not done well in terms of overall returns on
equity to the shareholders and is way below the industry average. Furthermore, the company’s
7 | P a g e
Ratios
For the Fiscal Period
Ending Formulas 12 m onths
Sep-30-2012
12 m onths
Sep-29-2013
12 m onths
Sep-28-2014
12 m onths
Sep-27-2015
12 m onths
Sep-25-2016
12 m onths
Sep-24-2017
Industry
Ratios
Profitability
Return on Assets % Net Profit/ Total Assets 9.8% 10.3% 10.5% 10.4% 9.0% 7.2% 10-12%
Return on Equity % Net profit to
shareholders/Equity
Shareholders' funds
13.7% 14.3% 15.1% 14.1% 14.5% 7.4% 18-20%
Return on Common Equity % Net Profit/ total sales 13.7% 14.3% 15.1% 14.1% 14.5% 7.4% 18-20%
Margin Analysis
Gross Margin % Gross Profit / Sales 35.5% 35.8% 35.5% 35.2% 34.4% 33.7% 40%
EBIT Margin % Operating Profit / Sales 6.4% 6.9% 6.7% 6.2% 5.5% 4.7% 12-15%
Net Income Margin % Net Profit / Sales 4.0% 4.3% 4.1% 3.5% 3.2% 1.5% 8-10%
Asset Turnover
Total Asset Turnover Sales / Total Assets 2.4x 2.4x 2.5x 2.7x 2.6x 2.5x 3-4 x
Fixed Asset Turnover Sales / Fixed Assets 5.6x 5.6x 5.3x 5.1x 4.8x 4.6x 8-10x
Accounts Receivable
Turnover
Sales / Accounts Receivables 62.8x 67.1x 73.5x 74.0x 68.4x 66.2x 60x
Inventory Turnover Sales / Inventory 21.2x 21.0x 21.4x 21.2x 20.3x 21.5x 24x
Short Term Liquidity
Current Ratio Current Assets/ current
Liabilities
2.2x 1.8x 1.4x 1.2x 1.5x 1.6x 2x
Quick Ratio Current Assets - Inventory -
Prepaid Expenses/ current
Liabilities
1.5x 1.1x 0.7x 0.5x 0.7x 0.9x 1x
Cash from Ops. to Curr. Liab. Working capital / Current
Liabilities
0.9x 0.9x 0.9x 0.9x 0.8x 0.8x 1x
Avg. Cash Conversion Cycle 365 / Time from raw material
to collection from debtors
11.5 11.9 11.6 11.7 12.7 10.8 18-20
Interest coverage Ratio EBIT / Interest Expenses NA NA NA NA 21.2x 15.3x 15-20x
Long Term Solvency
Total Debt/Equity Debt / Equity 0.6% 0.7% 1.6% 1.7% 32.6% 31.6% 200%
Total Debt/Capital Debt / (Debt + equity) 0.6% 0.7% 1.6% 1.7% 24.6% 24.0% 66.67%
Others
P/E ratio Price / EPS 34.42 33.30
Price/ Sales ratio Price / Sales 0.84 0.8-1
Price/ Book value Price / Book value per share 4x 5x-8x
Price/ Cash Flow ratio Price / Cash Flow Ratio 13.21x 20x
Whole Foods Market, I nc. > Ratios
Source: (Whole Foods Market, Inc. Financials, 2018)
Analysis and explanation
1. From the above financial analysis via ratios, it can be said that the company is is doing good in
terms of return to the asset but the company has not done well in terms of overall returns on
equity to the shareholders and is way below the industry average. Furthermore, the company’s
7 | P a g e
8
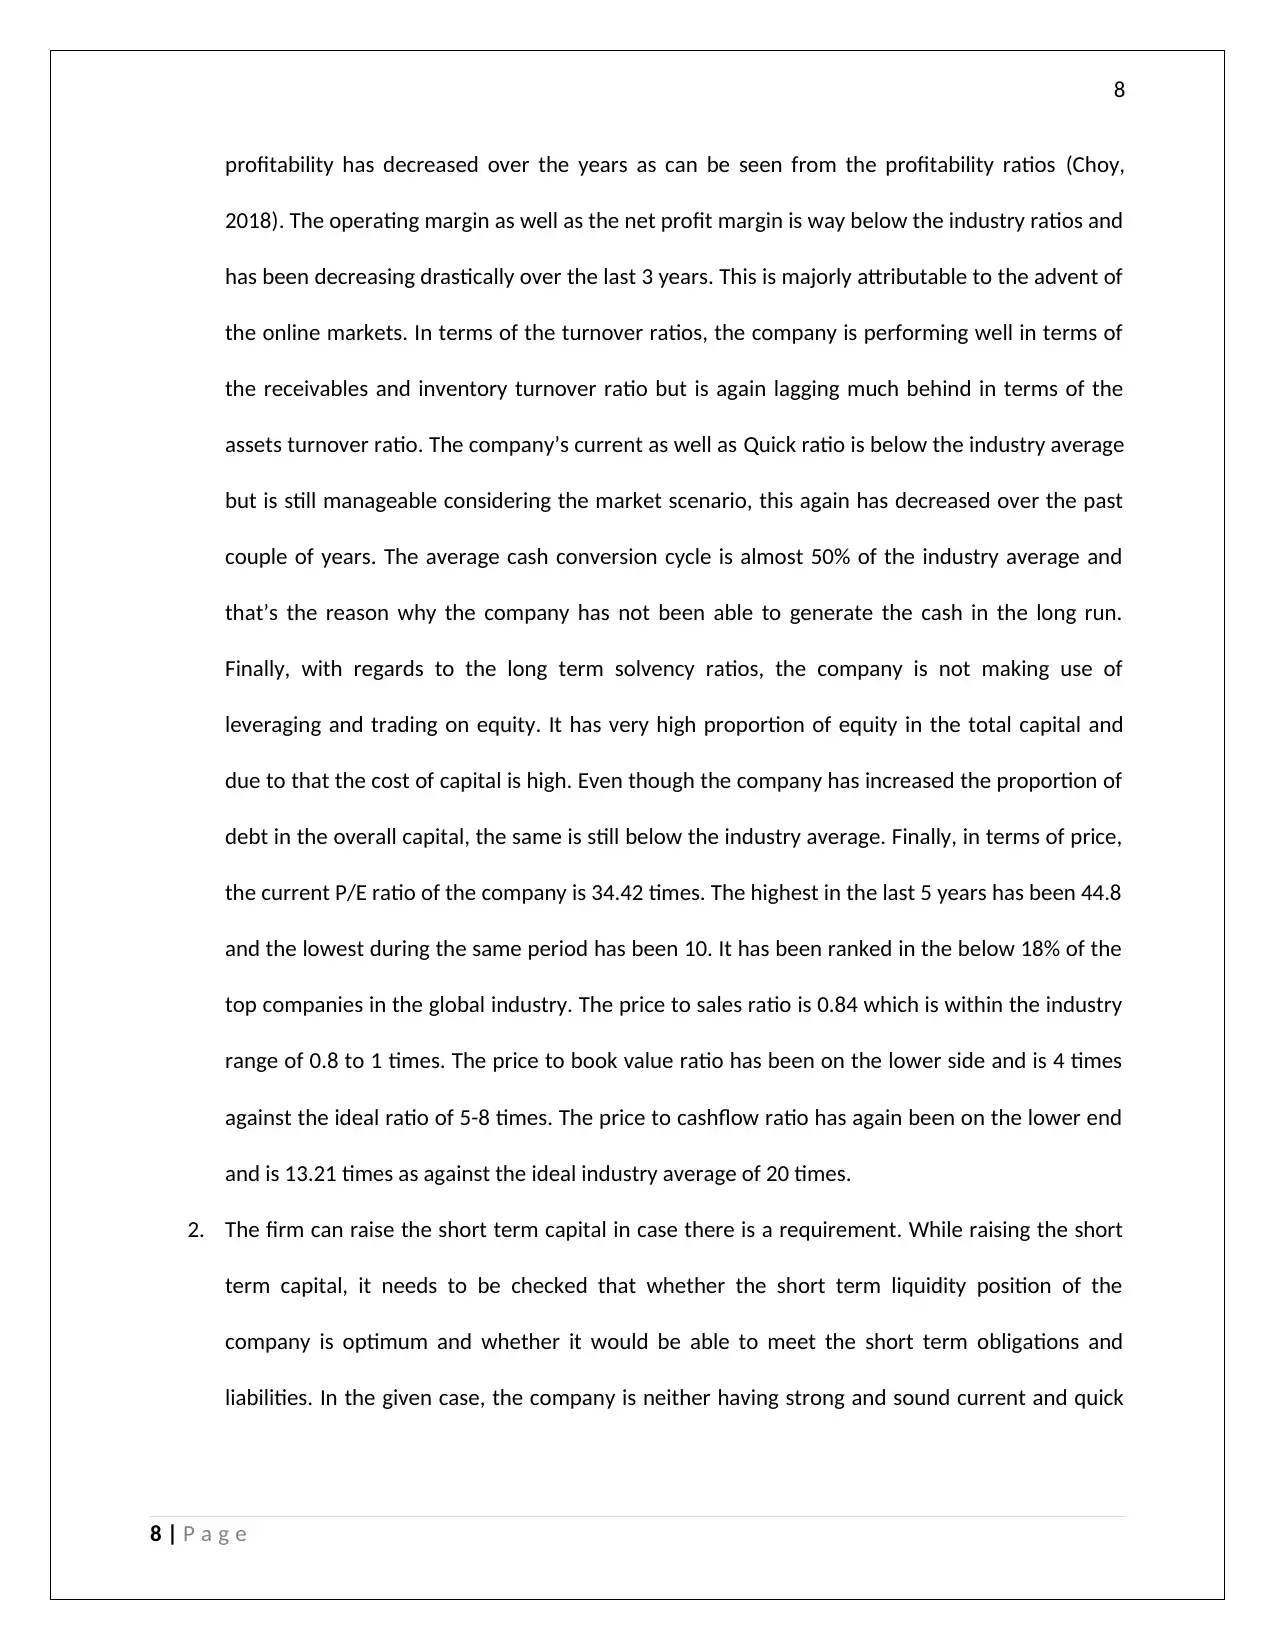
profitability has decreased over the years as can be seen from the profitability ratios (Choy,
2018). The operating margin as well as the net profit margin is way below the industry ratios and
has been decreasing drastically over the last 3 years. This is majorly attributable to the advent of
the online markets. In terms of the turnover ratios, the company is performing well in terms of
the receivables and inventory turnover ratio but is again lagging much behind in terms of the
assets turnover ratio. The company’s current as well as Quick ratio is below the industry average
but is still manageable considering the market scenario, this again has decreased over the past
couple of years. The average cash conversion cycle is almost 50% of the industry average and
that’s the reason why the company has not been able to generate the cash in the long run.
Finally, with regards to the long term solvency ratios, the company is not making use of
leveraging and trading on equity. It has very high proportion of equity in the total capital and
due to that the cost of capital is high. Even though the company has increased the proportion of
debt in the overall capital, the same is still below the industry average. Finally, in terms of price,
the current P/E ratio of the company is 34.42 times. The highest in the last 5 years has been 44.8
and the lowest during the same period has been 10. It has been ranked in the below 18% of the
top companies in the global industry. The price to sales ratio is 0.84 which is within the industry
range of 0.8 to 1 times. The price to book value ratio has been on the lower side and is 4 times
against the ideal ratio of 5-8 times. The price to cashflow ratio has again been on the lower end
and is 13.21 times as against the ideal industry average of 20 times.
2. The firm can raise the short term capital in case there is a requirement. While raising the short
term capital, it needs to be checked that whether the short term liquidity position of the
company is optimum and whether it would be able to meet the short term obligations and
liabilities. In the given case, the company is neither having strong and sound current and quick
8 | P a g e
⊘ This is a preview!⊘
Do you want full access?
Subscribe today to unlock all pages.
Trusted by 1+ million students worldwide
9
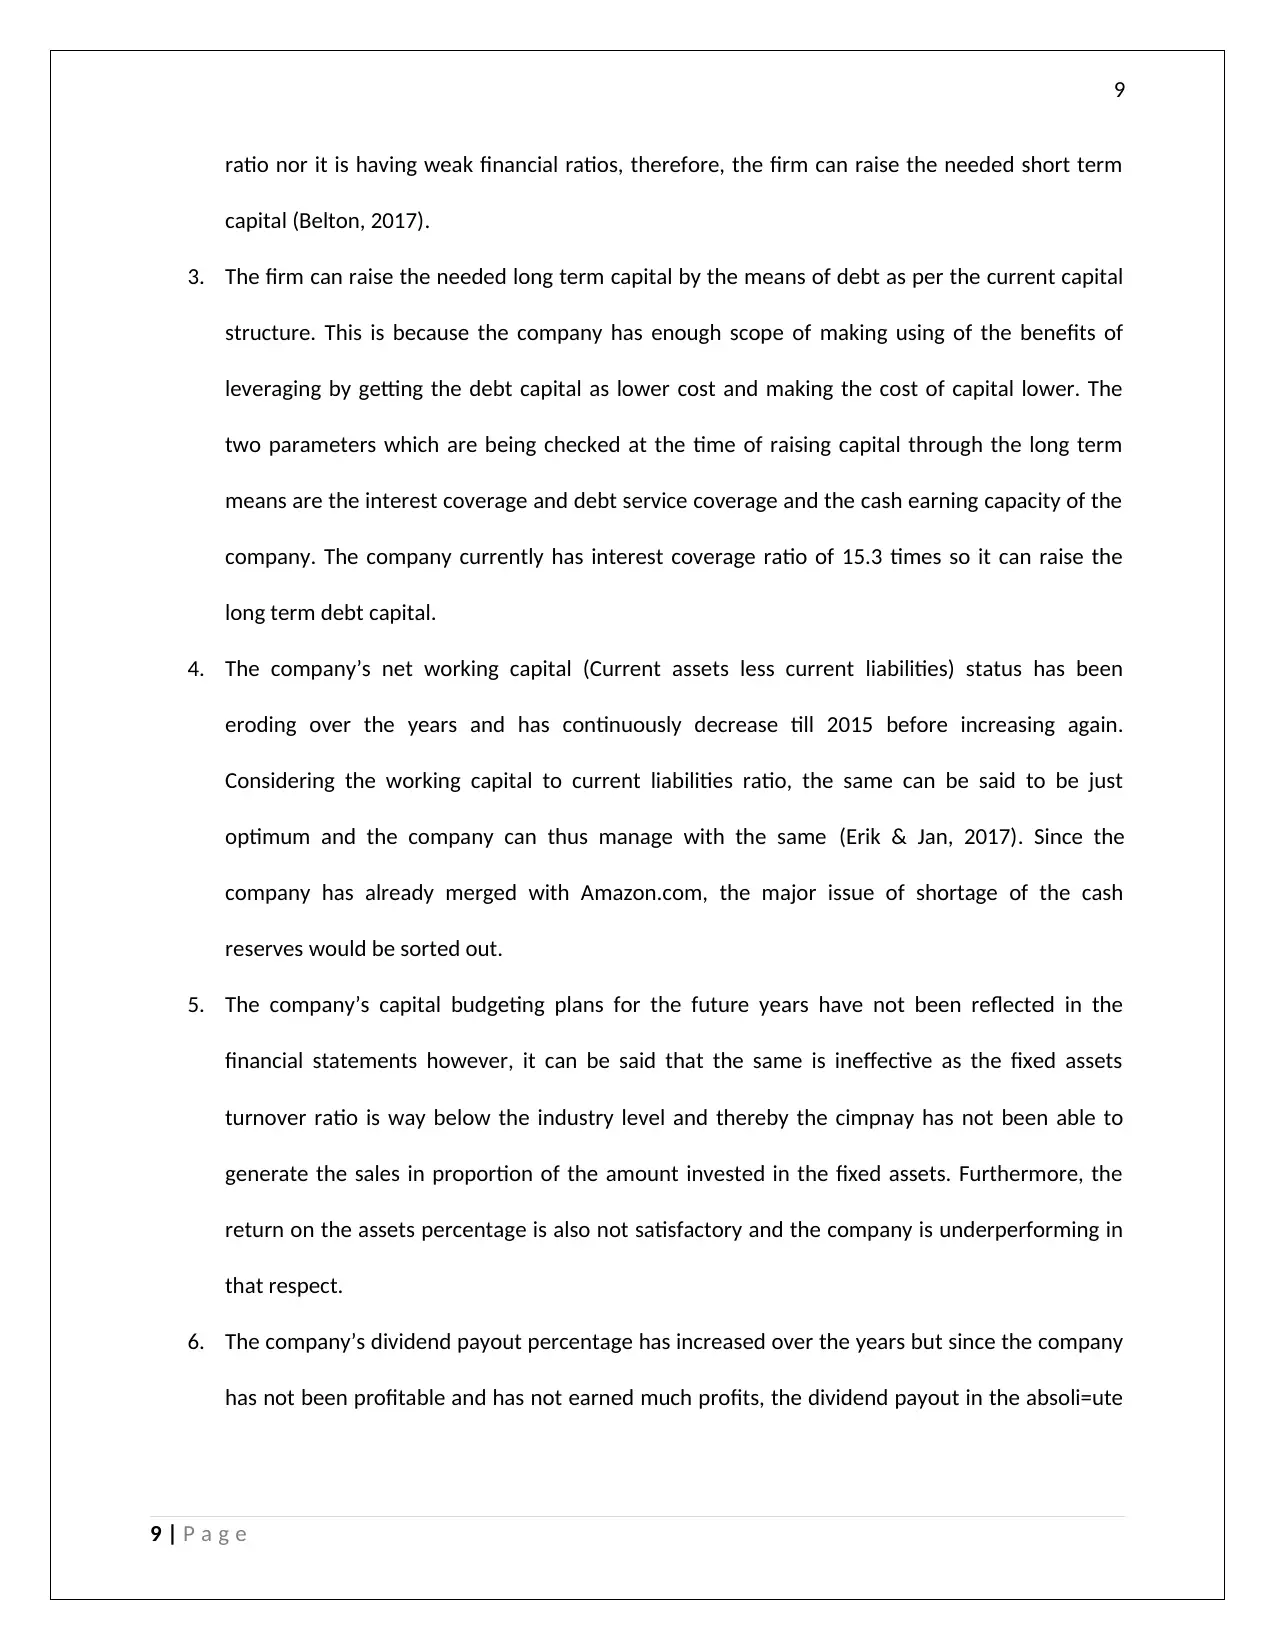
ratio nor it is having weak financial ratios, therefore, the firm can raise the needed short term
capital (Belton, 2017).
3. The firm can raise the needed long term capital by the means of debt as per the current capital
structure. This is because the company has enough scope of making using of the benefits of
leveraging by getting the debt capital as lower cost and making the cost of capital lower. The
two parameters which are being checked at the time of raising capital through the long term
means are the interest coverage and debt service coverage and the cash earning capacity of the
company. The company currently has interest coverage ratio of 15.3 times so it can raise the
long term debt capital.
4. The company’s net working capital (Current assets less current liabilities) status has been
eroding over the years and has continuously decrease till 2015 before increasing again.
Considering the working capital to current liabilities ratio, the same can be said to be just
optimum and the company can thus manage with the same (Erik & Jan, 2017). Since the
company has already merged with Amazon.com, the major issue of shortage of the cash
reserves would be sorted out.
5. The company’s capital budgeting plans for the future years have not been reflected in the
financial statements however, it can be said that the same is ineffective as the fixed assets
turnover ratio is way below the industry level and thereby the cimpnay has not been able to
generate the sales in proportion of the amount invested in the fixed assets. Furthermore, the
return on the assets percentage is also not satisfactory and the company is underperforming in
that respect.
6. The company’s dividend payout percentage has increased over the years but since the company
has not been profitable and has not earned much profits, the dividend payout in the absoli=ute
9 | P a g e
Paraphrase This Document
Need a fresh take? Get an instant paraphrase of this document with our AI Paraphraser
10
amount has decreased over the years. It is hard to comment that whether the payout policies
are reasonable or not as it could have been reinvested as well but at lower returns.
7. The firm is having good relations with the investors and shareholders in the past but in the
recent years, there have been issues with the organic quality of its products due to which there
have been several controversies with the company alongwith widespread criticism due to which
the relations have gone to be little strained (Linden & Freeman, 2017).
8. It has altogether 17 companies, each specialising in a product. The company is also known for
having a mentoring program for its employees and managers and also an online portal named
"Whole Foods Market University" to help them in training. The company aims of creating future
leaders and therefore, it can be said that the firms financial managers are well trained and
experienced (Werner, 2017).
10 | P a g e
11
References
Belton, P. (2017). Competitive Strategy: Creating and Sustaining Superior Performance. London: Macat
International ltd. Retrieved from https://www.routledge.com/Competitive-Strategy-Creating-
and-Sustaining-Superior-Performance/Belton/p/book/9781912128808
Choy, Y. K. (2018). Cost-benefit Analysis, Values, Wellbeing and Ethics: An Indigenous Worldview
Analysis. Ecological Economics, 145. Retrieved from
https://doi.org/10.1016/j.ecolecon.2017.08.005
Erik, H., & Jan, B. (2017). Supply chain management and activity-based costing: Current status and
directions for the future. International Journal of Physical Distribution & Logistics Management,
47(8), 712-735.
Goldmann, K. (2016). Financial Liquidity and Profitability Management in Practice of Polish Business.
Financial Environment and Business Development, 4, 103-112. Retrieved from
https://doi.org/10.1007/978-3-319-39919-5_9
Linden, B., & Freeman, R. (2017). Profit and Other Values: Thick Evaluation in Decision Making. Business
Ethics Quarterly, 27(3), 353-379. Retrieved from https://doi.org/10.1017/beq.2017.1
Werner, M. (2017). Financial process mining - Accounting data structure dependent control flow
inference. International Journal of Accounting Information Systems, 25, 57-80.
Whole Foods Market Revenue, Profits - WFM Annual Income Statement. (2018, March 11). Retrieved
from Amigobulls.com: https://amigobulls.com/stocks/WFM/income-statement/annual
Whole Foods Market, Inc. Financials. (2018, March 11). Retrieved from www.capitaliq.com:
https://www.capitaliq.com/CIQDotNet/Financial/BalanceSheet.aspx?CompanyId=36602
Whole Foods Market, Inc. Financials. (2018, March 11). Retrieved from www.capitaliq.com:
https://www.capitaliq.com/CIQDotNet/Financial/Ratios.aspx?CompanyId=36602
11 | P a g e
⊘ This is a preview!⊘
Do you want full access?
Subscribe today to unlock all pages.
Trusted by 1+ million students worldwide
1 out of 12
Related Documents


Your All-in-One AI-Powered Toolkit for Academic Success.
+13062052269
info@desklib.com
Available 24*7 on WhatsApp / Email
![[object Object]](/_next/static/media/star-bottom.7253800d.svg)
Unlock your academic potential
Copyright © 2020–2026 A2Z Services. All Rights Reserved. Developed and managed by ZUCOL.