Applied Financial Management Project: Wil's Grill Case Analysis
VerifiedAdded on 2023/06/03
|11
|2130
|159
Case Study
AI Summary
This case study report evaluates Wil's Grill's new proposal to open a catering business within a resort, focusing on the financial implications and strategic recommendations. The analysis includes a SWOT analysis, profit and loss statements, and cash flow projections for different business options. The report highlights the importance of applied financial management in assessing the viability of the catering business, examining cost structures, revenue generation, and cash management. The study concludes that the catering business, particularly option B (catering and street food), is a viable option for Wil's Grill as it would improve profitability and cash flow. The report also includes a detailed menu design and financial projections for both options to support the recommendations. The analysis emphasizes the need for strategic decision-making to enhance the business's overall performance.
Running Head: Applied Financial Management
1
Project Report: Applied Financial Management
1
Project Report: Applied Financial Management
Paraphrase This Document
Need a fresh take? Get an instant paraphrase of this document with our AI Paraphraser
Applied Financial Management 2
Executive summary:
It is a case study report which evaluates the new proposal in front of Wil’s grill to
open the catering business in the resort. It focuses on the different cost structure of the
business to identify that whether the business would be successful or not. In the report,
SWOT analysis, financial projections etc have been done and it has been concluded that the
new proposal is better option for the business and among the new proposals, option B
(catering and maintain street food) is better option for the business. It would improve the
profitability level and the cash management position of the business.
Applied Financial Management 3
Contents
Introduction.......................................................................................................................4
SWOT analysis.................................................................................................................4
Profit and loss statement case...........................................................................................5
Profit and loss statement...................................................................................................5
Cash flow projections.......................................................................................................6
Key findings......................................................................................................................6
Conclusion........................................................................................................................6
References.........................................................................................................................7
Appendix...........................................................................................................................8
Menu design..................................................................................................................8
Profit and loss statement...............................................................................................8
Cash flow statement....................................................................................................10
⊘ This is a preview!⊘
Do you want full access?
Subscribe today to unlock all pages.
Trusted by 1+ million students worldwide
Applied Financial Management 4
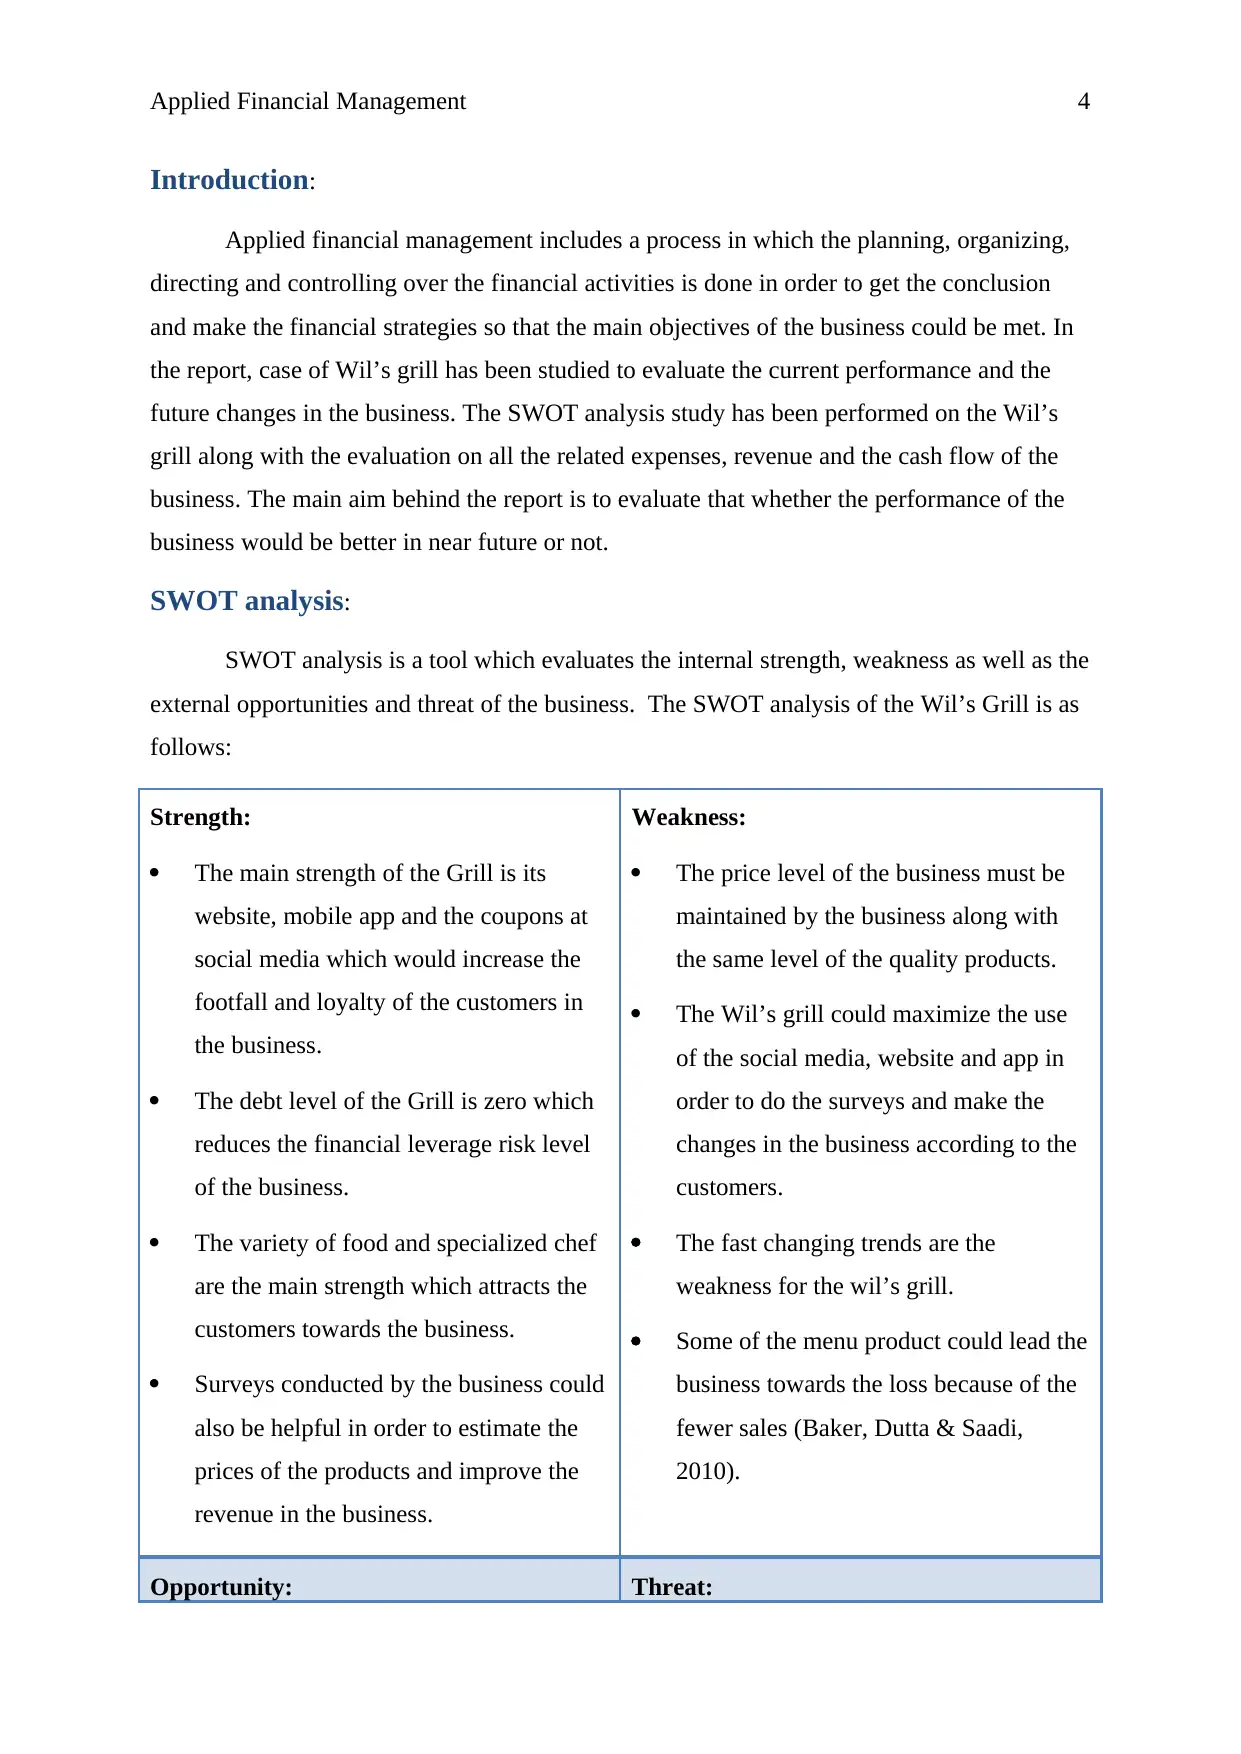
Introduction:
Applied financial management includes a process in which the planning, organizing,
directing and controlling over the financial activities is done in order to get the conclusion
and make the financial strategies so that the main objectives of the business could be met. In
the report, case of Wil’s grill has been studied to evaluate the current performance and the
future changes in the business. The SWOT analysis study has been performed on the Wil’s
grill along with the evaluation on all the related expenses, revenue and the cash flow of the
business. The main aim behind the report is to evaluate that whether the performance of the
business would be better in near future or not.
SWOT analysis:
SWOT analysis is a tool which evaluates the internal strength, weakness as well as the
external opportunities and threat of the business. The SWOT analysis of the Wil’s Grill is as
follows:
Strength:
The main strength of the Grill is its
website, mobile app and the coupons at
social media which would increase the
footfall and loyalty of the customers in
the business.
The debt level of the Grill is zero which
reduces the financial leverage risk level
of the business.
The variety of food and specialized chef
are the main strength which attracts the
customers towards the business.
Surveys conducted by the business could
also be helpful in order to estimate the
prices of the products and improve the
revenue in the business.
Weakness:
The price level of the business must be
maintained by the business along with
the same level of the quality products.
The Wil’s grill could maximize the use
of the social media, website and app in
order to do the surveys and make the
changes in the business according to the
customers.
The fast changing trends are the
weakness for the wil’s grill.
Some of the menu product could lead the
business towards the loss because of the
fewer sales (Baker, Dutta & Saadi,
2010).
Opportunity: Threat:
Paraphrase This Document
Need a fresh take? Get an instant paraphrase of this document with our AI Paraphraser
Applied Financial Management 5
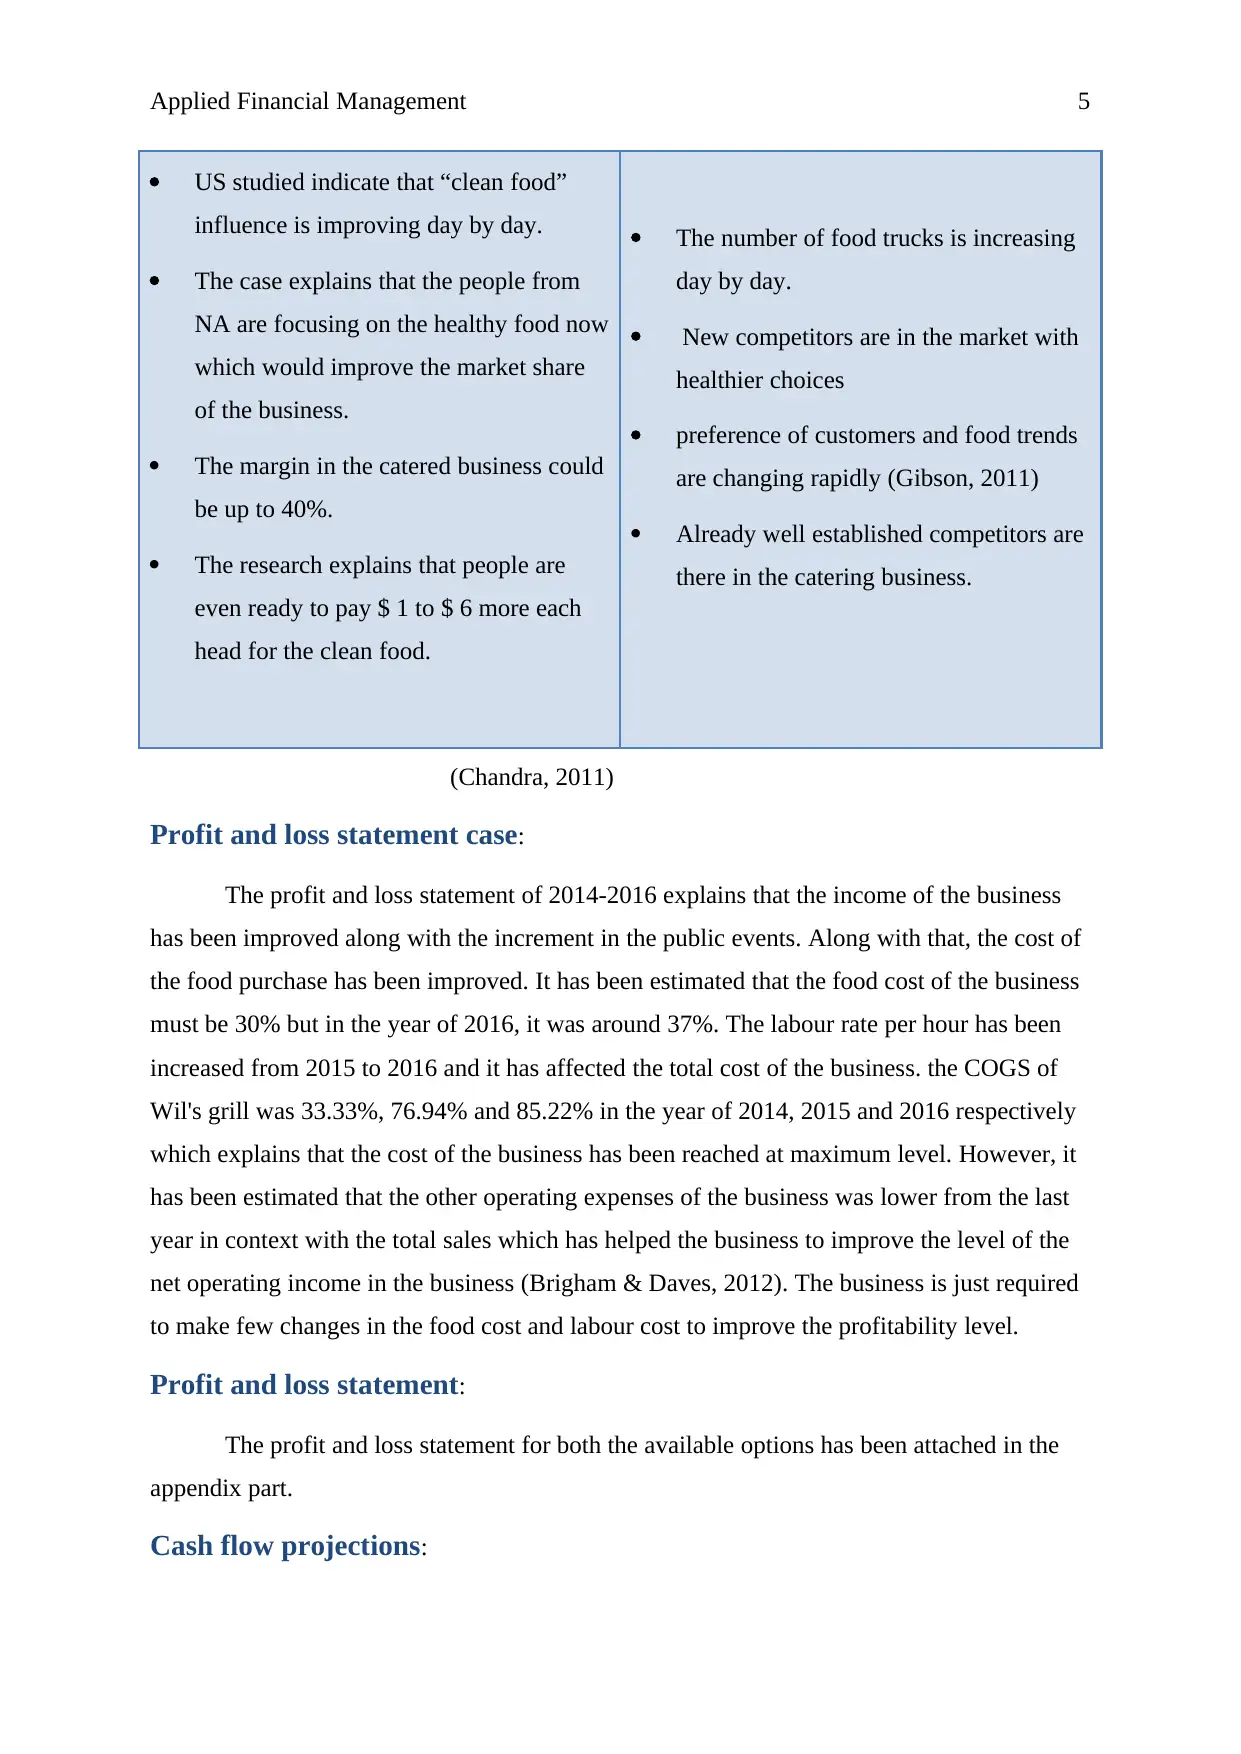
US studied indicate that “clean food”
influence is improving day by day.
The case explains that the people from
NA are focusing on the healthy food now
which would improve the market share
of the business.
The margin in the catered business could
be up to 40%.
The research explains that people are
even ready to pay $ 1 to $ 6 more each
head for the clean food.
The number of food trucks is increasing
day by day.
New competitors are in the market with
healthier choices
preference of customers and food trends
are changing rapidly (Gibson, 2011)
Already well established competitors are
there in the catering business.
(Chandra, 2011)
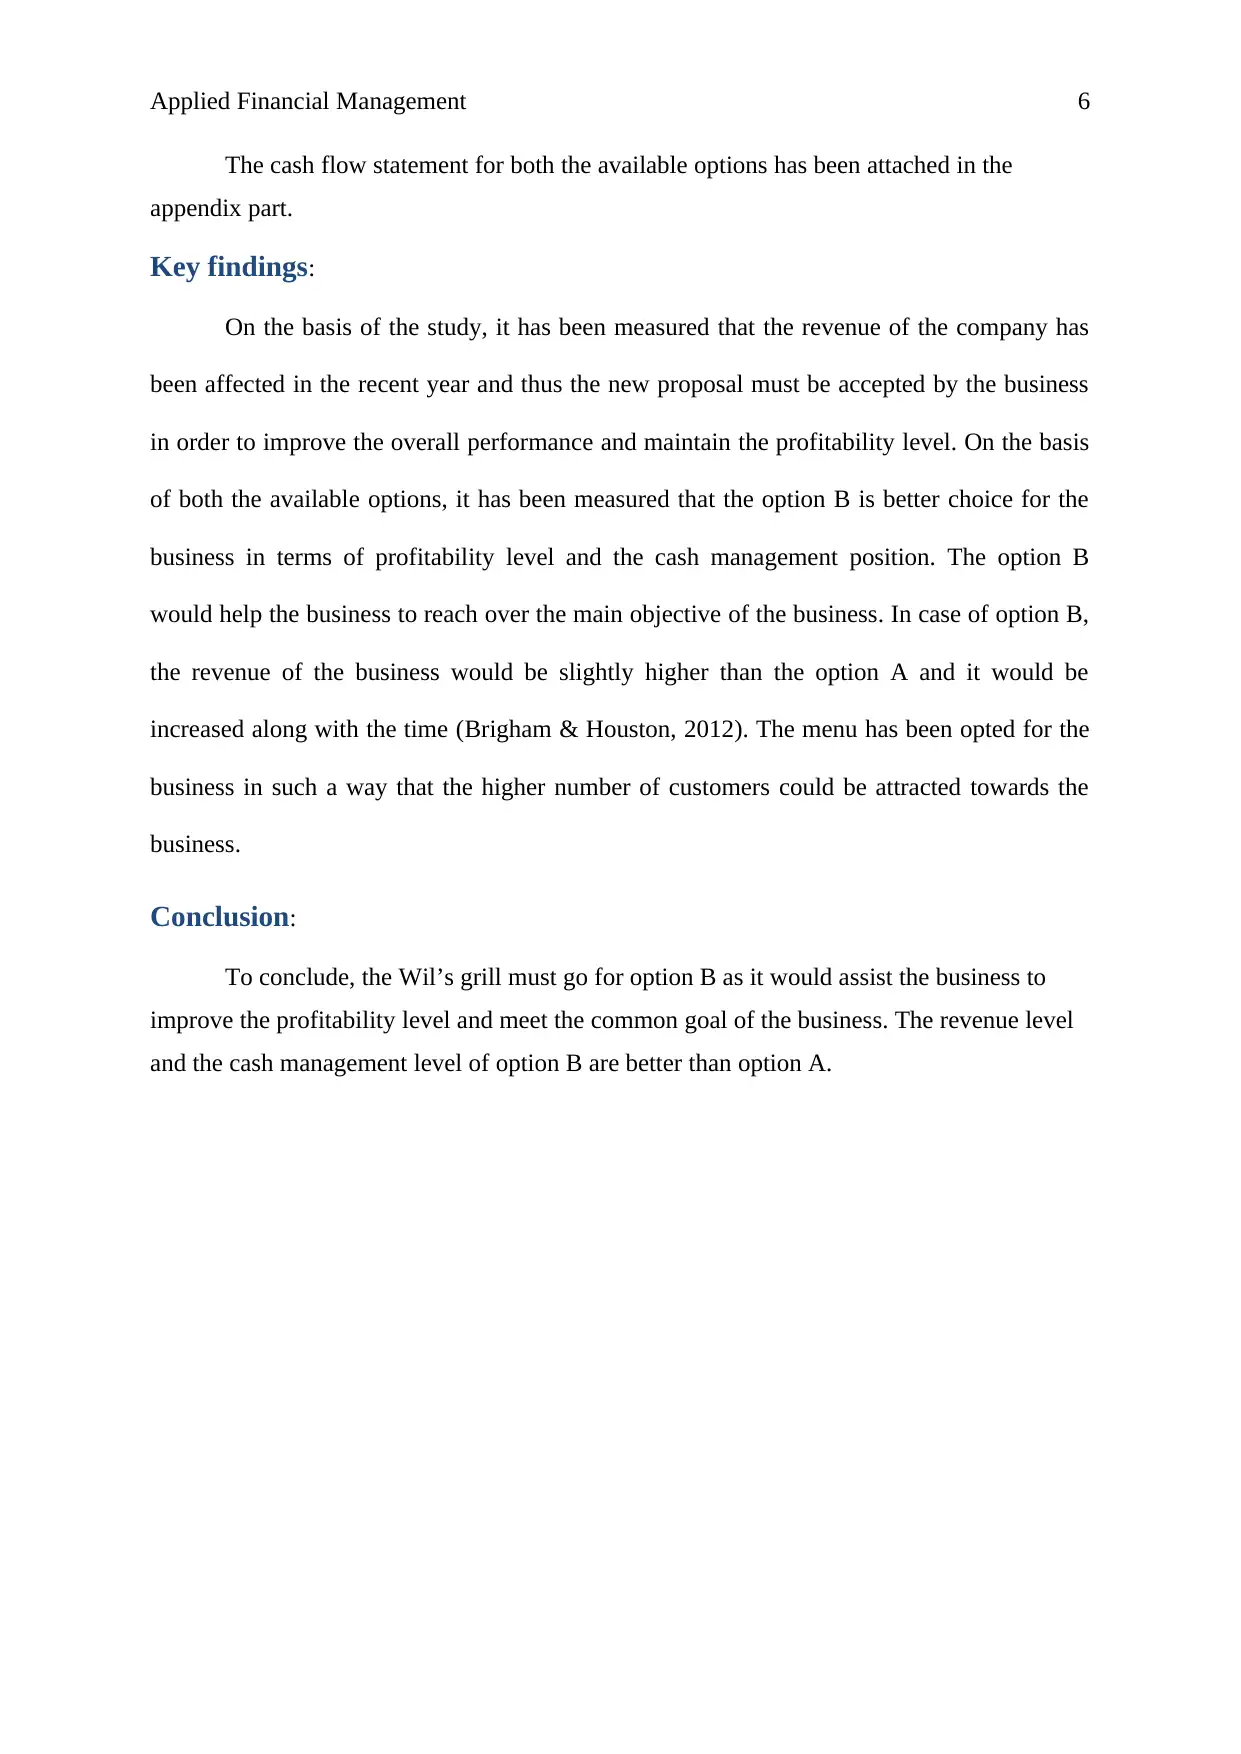
Profit and loss statement case:
The profit and loss statement of 2014-2016 explains that the income of the business
has been improved along with the increment in the public events. Along with that, the cost of
the food purchase has been improved. It has been estimated that the food cost of the business
must be 30% but in the year of 2016, it was around 37%. The labour rate per hour has been
increased from 2015 to 2016 and it has affected the total cost of the business. the COGS of
Wil's grill was 33.33%, 76.94% and 85.22% in the year of 2014, 2015 and 2016 respectively
which explains that the cost of the business has been reached at maximum level. However, it
has been estimated that the other operating expenses of the business was lower from the last
year in context with the total sales which has helped the business to improve the level of the
net operating income in the business (Brigham & Daves, 2012). The business is just required
to make few changes in the food cost and labour cost to improve the profitability level.
Profit and loss statement:
The profit and loss statement for both the available options has been attached in the
appendix part.
Cash flow projections:
US studied indicate that “clean food”
influence is improving day by day.
The case explains that the people from
NA are focusing on the healthy food now
which would improve the market share
of the business.
The margin in the catered business could
be up to 40%.
The research explains that people are
even ready to pay $ 1 to $ 6 more each
head for the clean food.
The number of food trucks is increasing
day by day.
New competitors are in the market with
healthier choices
preference of customers and food trends
are changing rapidly (Gibson, 2011)
Already well established competitors are
there in the catering business.
(Chandra, 2011)
Profit and loss statement case:
The profit and loss statement of 2014-2016 explains that the income of the business
has been improved along with the increment in the public events. Along with that, the cost of
the food purchase has been improved. It has been estimated that the food cost of the business
must be 30% but in the year of 2016, it was around 37%. The labour rate per hour has been
increased from 2015 to 2016 and it has affected the total cost of the business. the COGS of
Wil's grill was 33.33%, 76.94% and 85.22% in the year of 2014, 2015 and 2016 respectively
which explains that the cost of the business has been reached at maximum level. However, it
has been estimated that the other operating expenses of the business was lower from the last
year in context with the total sales which has helped the business to improve the level of the
net operating income in the business (Brigham & Daves, 2012). The business is just required
to make few changes in the food cost and labour cost to improve the profitability level.
Profit and loss statement:
The profit and loss statement for both the available options has been attached in the
appendix part.
Cash flow projections:
Applied Financial Management 6
The cash flow statement for both the available options has been attached in the
appendix part.
Key findings:
On the basis of the study, it has been measured that the revenue of the company has
been affected in the recent year and thus the new proposal must be accepted by the business
in order to improve the overall performance and maintain the profitability level. On the basis
of both the available options, it has been measured that the option B is better choice for the
business in terms of profitability level and the cash management position. The option B
would help the business to reach over the main objective of the business. In case of option B,
the revenue of the business would be slightly higher than the option A and it would be
increased along with the time (Brigham & Houston, 2012). The menu has been opted for the
business in such a way that the higher number of customers could be attracted towards the
business.
Conclusion:
To conclude, the Wil’s grill must go for option B as it would assist the business to
improve the profitability level and meet the common goal of the business. The revenue level
and the cash management level of option B are better than option A.
⊘ This is a preview!⊘
Do you want full access?
Subscribe today to unlock all pages.
Trusted by 1+ million students worldwide
Applied Financial Management 7
References:
Baker, H. K., Dutta, S., & Saadi, S. (2010). Management views on real options in capital
budgeting.
Brigham, E. F., & Houston, J. F. (2012). Fundamentals of financial management. Cengage
Learning.
Brigham, E., & Daves, P. (2012). Intermediate financial management. Nelson Education.
Chandra, P. (2011). Financial management. Tata McGraw-Hill Education.
Gibson, C. H. (2011). Financial reporting and analysis. South-Western Cengage Learning.
Paraphrase This Document
Need a fresh take? Get an instant paraphrase of this document with our AI Paraphraser
Applied Financial Management 8
Appendix:
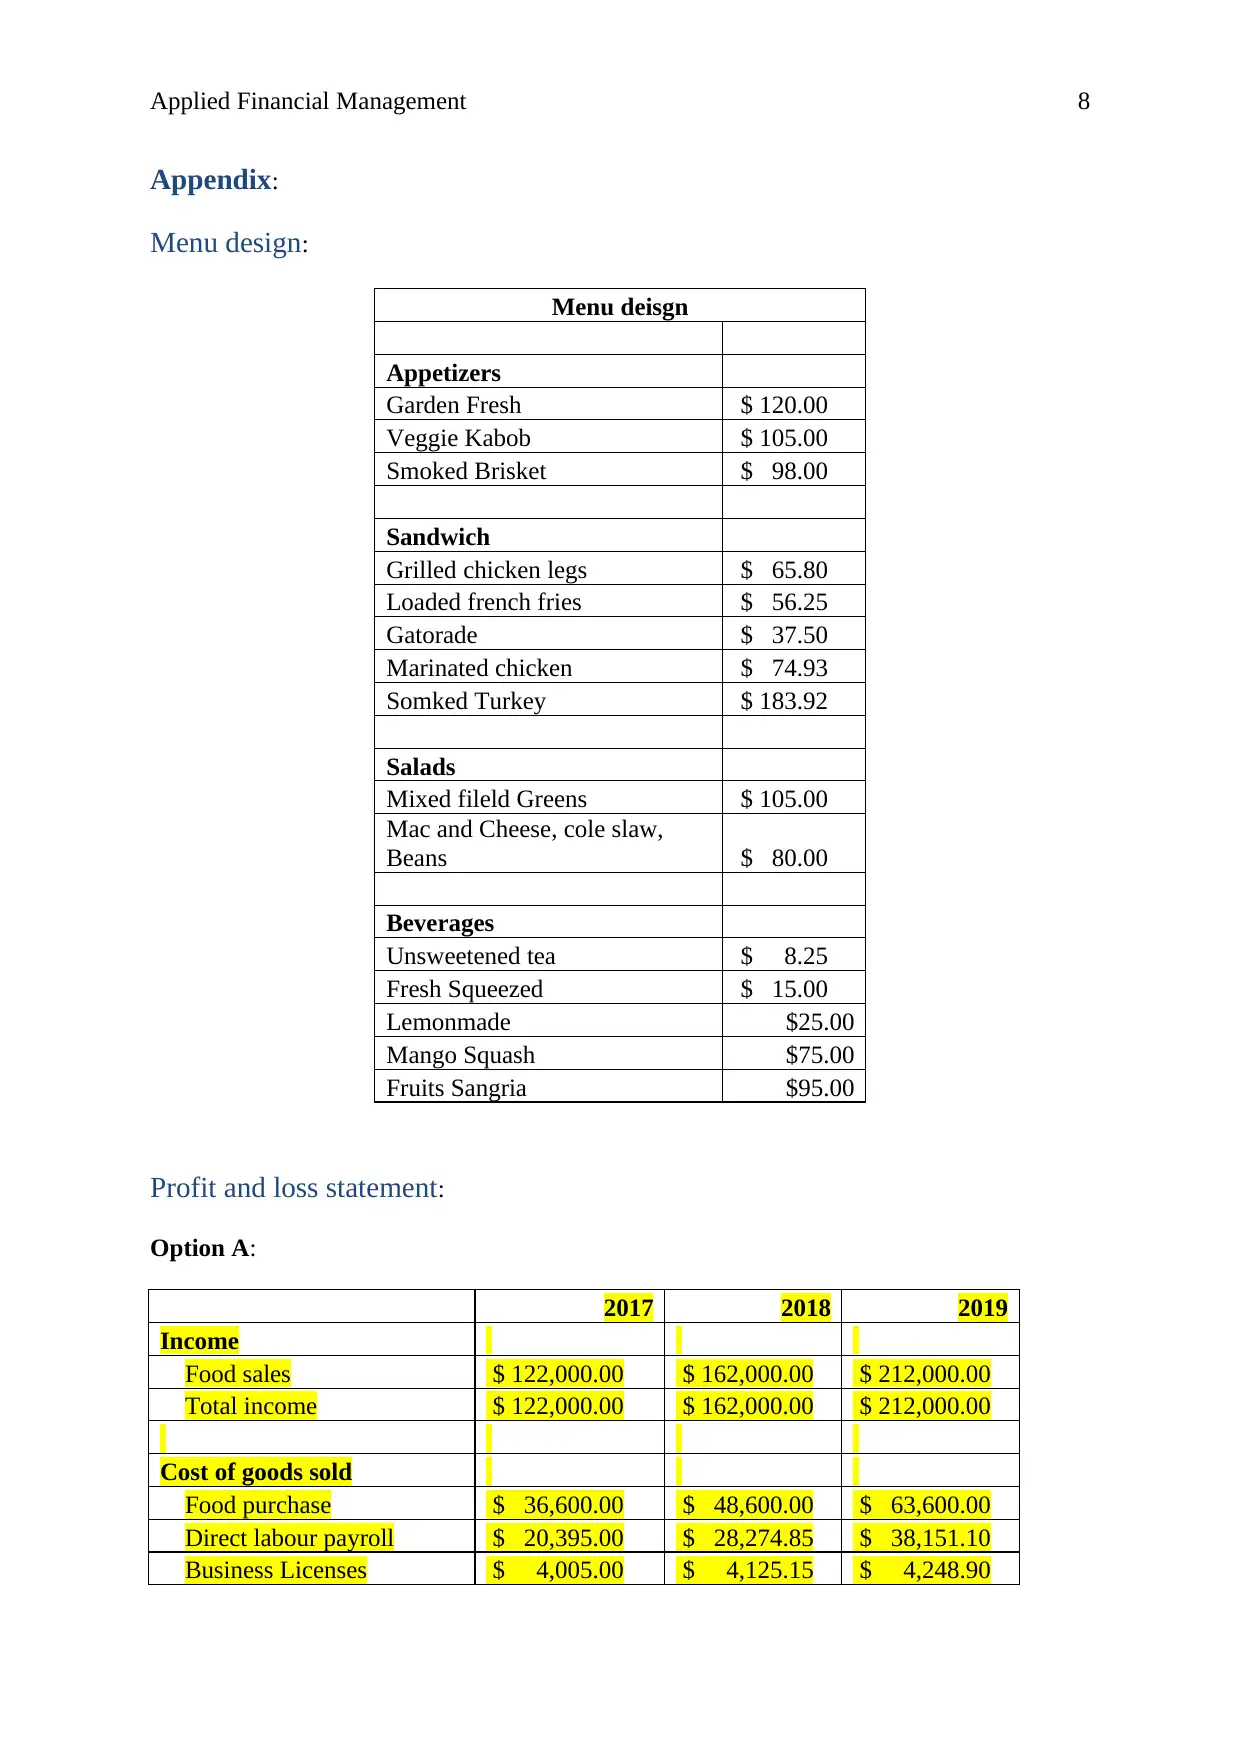
Menu design:
Menu deisgn
Appetizers
Garden Fresh $ 120.00
Veggie Kabob $ 105.00
Smoked Brisket $ 98.00
Sandwich
Grilled chicken legs $ 65.80
Loaded french fries $ 56.25
Gatorade $ 37.50
Marinated chicken $ 74.93
Somked Turkey $ 183.92
Salads
Mixed fileld Greens $ 105.00
Mac and Cheese, cole slaw,
Beans $ 80.00
Beverages
Unsweetened tea $ 8.25
Fresh Squeezed $ 15.00
Lemonmade $25.00
Mango Squash $75.00
Fruits Sangria $95.00
Profit and loss statement:
Option A:
2017 2018 2019
Income
Food sales $ 122,000.00 $ 162,000.00 $ 212,000.00
Total income $ 122,000.00 $ 162,000.00 $ 212,000.00
Cost of goods sold
Food purchase $ 36,600.00 $ 48,600.00 $ 63,600.00
Direct labour payroll $ 20,395.00 $ 28,274.85 $ 38,151.10
Business Licenses $ 4,005.00 $ 4,125.15 $ 4,248.90
Appendix:
Menu design:
Menu deisgn
Appetizers
Garden Fresh $ 120.00
Veggie Kabob $ 105.00
Smoked Brisket $ 98.00
Sandwich
Grilled chicken legs $ 65.80
Loaded french fries $ 56.25
Gatorade $ 37.50
Marinated chicken $ 74.93
Somked Turkey $ 183.92
Salads
Mixed fileld Greens $ 105.00
Mac and Cheese, cole slaw,
Beans $ 80.00
Beverages
Unsweetened tea $ 8.25
Fresh Squeezed $ 15.00
Lemonmade $25.00
Mango Squash $75.00
Fruits Sangria $95.00
Profit and loss statement:
Option A:
2017 2018 2019
Income
Food sales $ 122,000.00 $ 162,000.00 $ 212,000.00
Total income $ 122,000.00 $ 162,000.00 $ 212,000.00
Cost of goods sold
Food purchase $ 36,600.00 $ 48,600.00 $ 63,600.00
Direct labour payroll $ 20,395.00 $ 28,274.85 $ 38,151.10
Business Licenses $ 4,005.00 $ 4,125.15 $ 4,248.90
Applied Financial Management 9
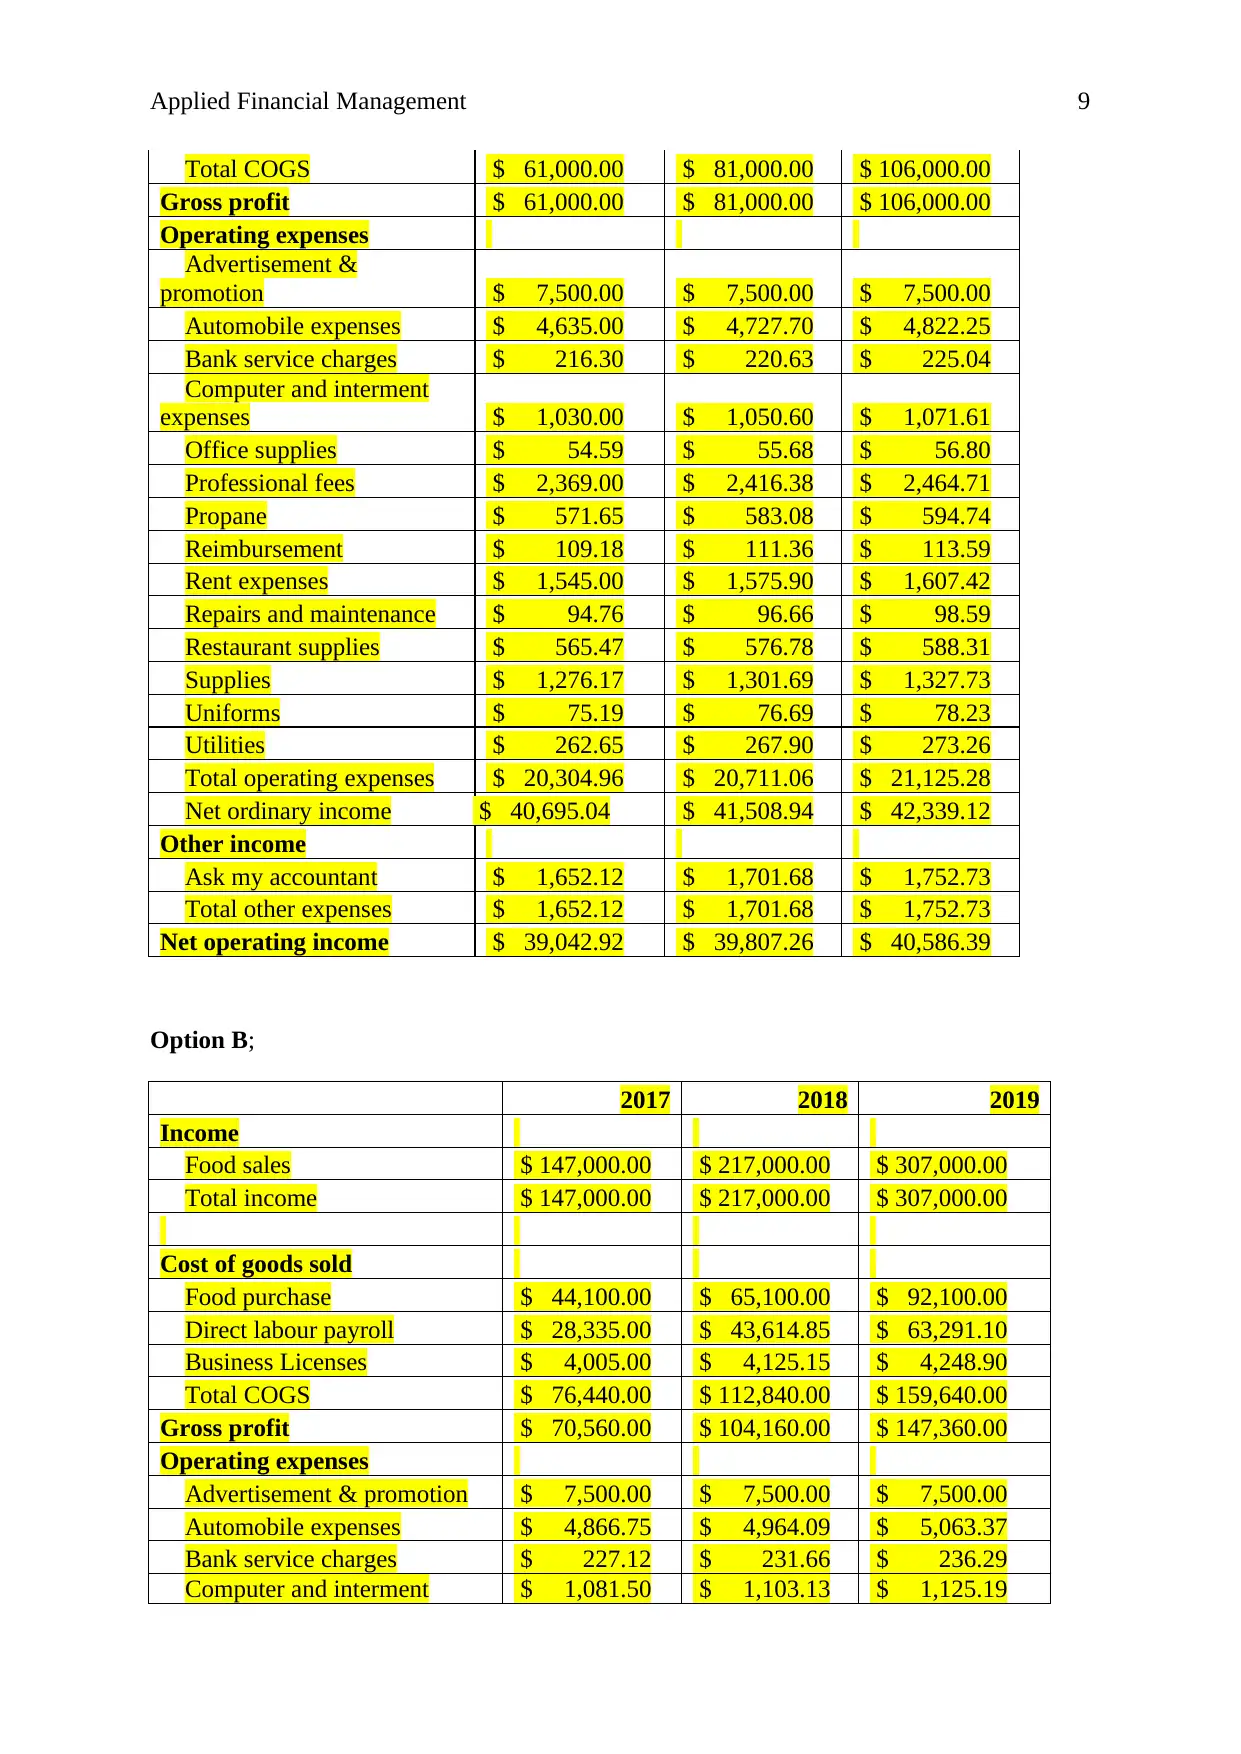
Total COGS $ 61,000.00 $ 81,000.00 $ 106,000.00
Gross profit $ 61,000.00 $ 81,000.00 $ 106,000.00
Operating expenses
Advertisement &
promotion $ 7,500.00 $ 7,500.00 $ 7,500.00
Automobile expenses $ 4,635.00 $ 4,727.70 $ 4,822.25
Bank service charges $ 216.30 $ 220.63 $ 225.04
Computer and interment
expenses $ 1,030.00 $ 1,050.60 $ 1,071.61
Office supplies $ 54.59 $ 55.68 $ 56.80
Professional fees $ 2,369.00 $ 2,416.38 $ 2,464.71
Propane $ 571.65 $ 583.08 $ 594.74
Reimbursement $ 109.18 $ 111.36 $ 113.59
Rent expenses $ 1,545.00 $ 1,575.90 $ 1,607.42
Repairs and maintenance $ 94.76 $ 96.66 $ 98.59
Restaurant supplies $ 565.47 $ 576.78 $ 588.31
Supplies $ 1,276.17 $ 1,301.69 $ 1,327.73
Uniforms $ 75.19 $ 76.69 $ 78.23
Utilities $ 262.65 $ 267.90 $ 273.26
Total operating expenses $ 20,304.96 $ 20,711.06 $ 21,125.28
Net ordinary income $ 40,695.04 $ 41,508.94 $ 42,339.12
Other income
Ask my accountant $ 1,652.12 $ 1,701.68 $ 1,752.73
Total other expenses $ 1,652.12 $ 1,701.68 $ 1,752.73
Net operating income $ 39,042.92 $ 39,807.26 $ 40,586.39
Option B;
2017 2018 2019
Income
Food sales $ 147,000.00 $ 217,000.00 $ 307,000.00
Total income $ 147,000.00 $ 217,000.00 $ 307,000.00
Cost of goods sold
Food purchase $ 44,100.00 $ 65,100.00 $ 92,100.00
Direct labour payroll $ 28,335.00 $ 43,614.85 $ 63,291.10
Business Licenses $ 4,005.00 $ 4,125.15 $ 4,248.90
Total COGS $ 76,440.00 $ 112,840.00 $ 159,640.00
Gross profit $ 70,560.00 $ 104,160.00 $ 147,360.00
Operating expenses
Advertisement & promotion $ 7,500.00 $ 7,500.00 $ 7,500.00
Automobile expenses $ 4,866.75 $ 4,964.09 $ 5,063.37
Bank service charges $ 227.12 $ 231.66 $ 236.29
Computer and interment $ 1,081.50 $ 1,103.13 $ 1,125.19
⊘ This is a preview!⊘
Do you want full access?
Subscribe today to unlock all pages.
Trusted by 1+ million students worldwide
Applied Financial Management 10
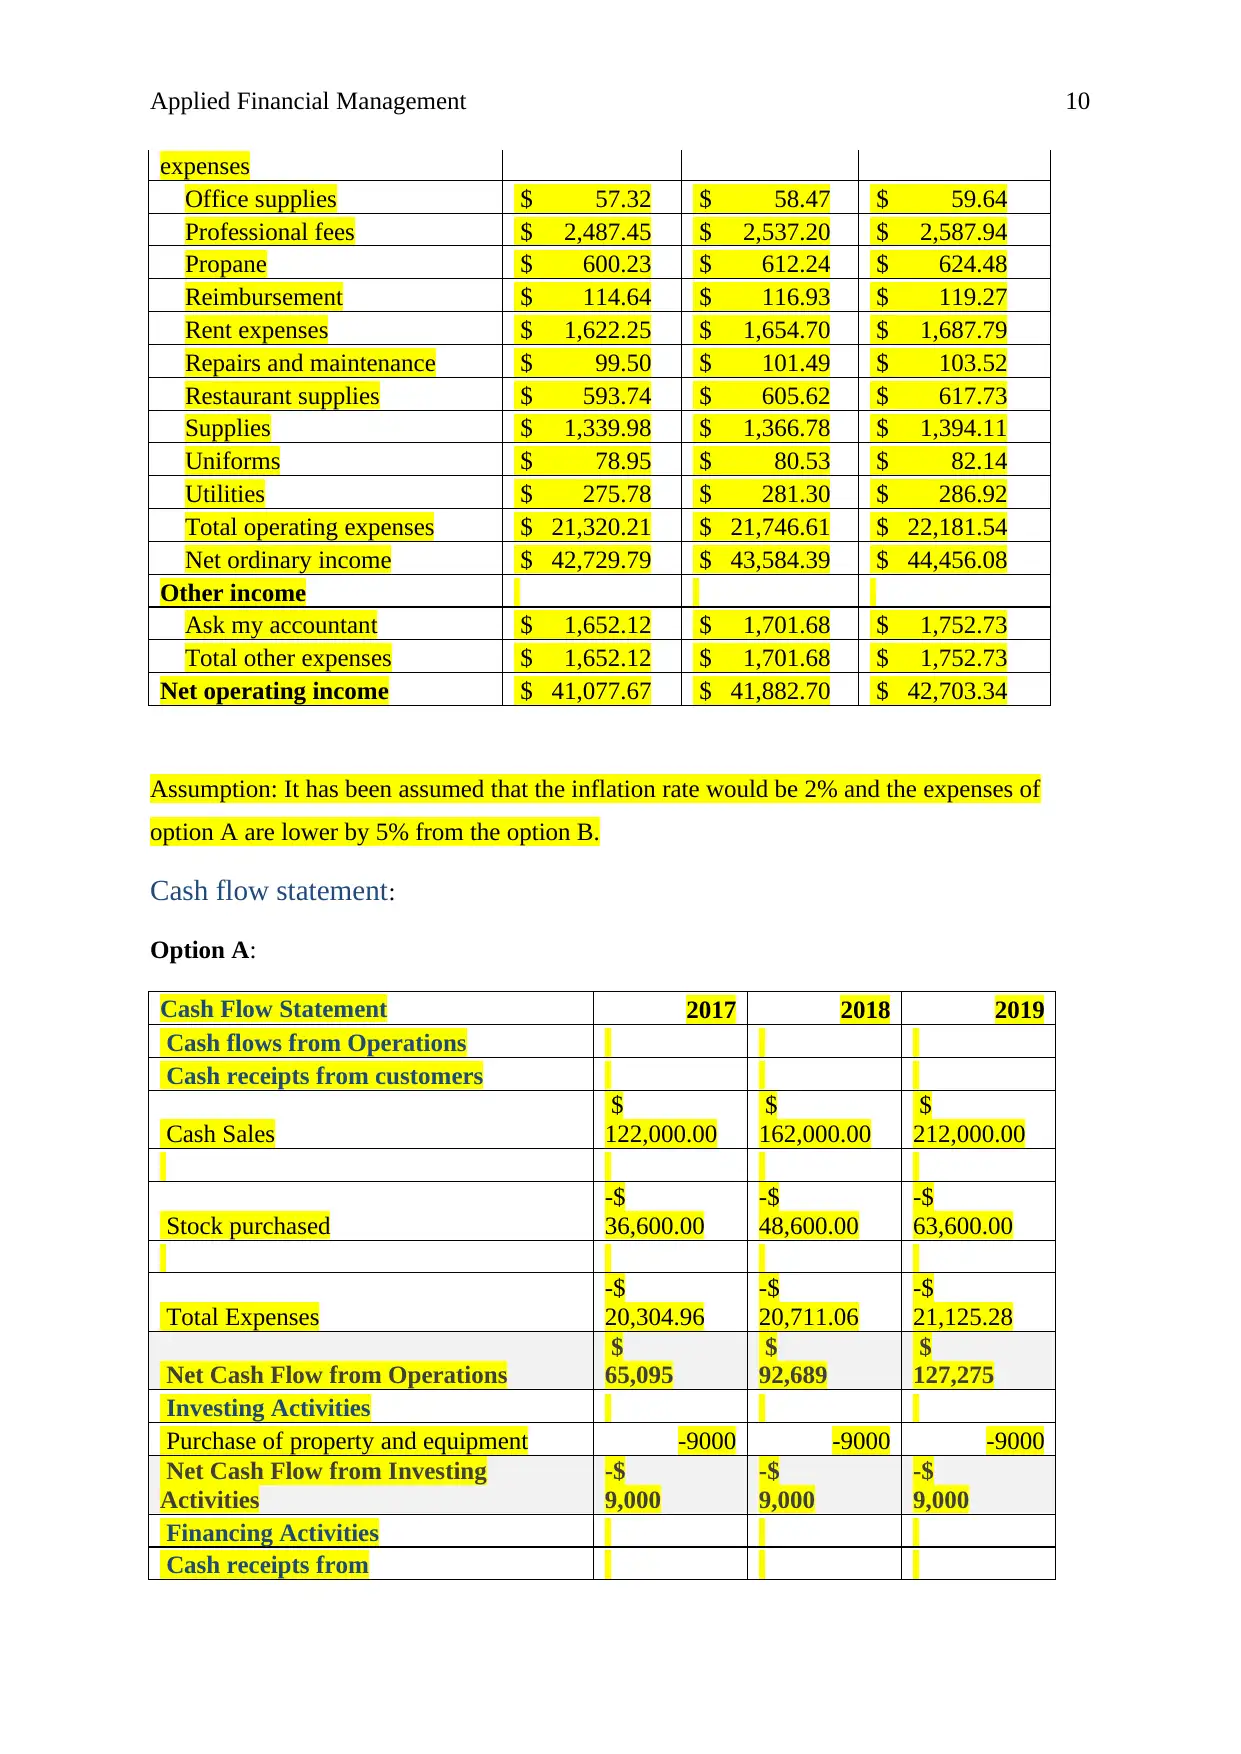
expenses
Office supplies $ 57.32 $ 58.47 $ 59.64
Professional fees $ 2,487.45 $ 2,537.20 $ 2,587.94
Propane $ 600.23 $ 612.24 $ 624.48
Reimbursement $ 114.64 $ 116.93 $ 119.27
Rent expenses $ 1,622.25 $ 1,654.70 $ 1,687.79
Repairs and maintenance $ 99.50 $ 101.49 $ 103.52
Restaurant supplies $ 593.74 $ 605.62 $ 617.73
Supplies $ 1,339.98 $ 1,366.78 $ 1,394.11
Uniforms $ 78.95 $ 80.53 $ 82.14
Utilities $ 275.78 $ 281.30 $ 286.92
Total operating expenses $ 21,320.21 $ 21,746.61 $ 22,181.54
Net ordinary income $ 42,729.79 $ 43,584.39 $ 44,456.08
Other income
Ask my accountant $ 1,652.12 $ 1,701.68 $ 1,752.73
Total other expenses $ 1,652.12 $ 1,701.68 $ 1,752.73
Net operating income $ 41,077.67 $ 41,882.70 $ 42,703.34
Assumption: It has been assumed that the inflation rate would be 2% and the expenses of
option A are lower by 5% from the option B.
Cash flow statement:
Option A:
Cash Flow Statement 2017 2018 2019
Cash flows from Operations
Cash receipts from customers
Cash Sales
$
122,000.00
$
162,000.00
$
212,000.00
Stock purchased
-$
36,600.00
-$
48,600.00
-$
63,600.00
Total Expenses
-$
20,304.96
-$
20,711.06
-$
21,125.28
Net Cash Flow from Operations
$
65,095
$
92,689
$
127,275
Investing Activities
Purchase of property and equipment -9000 -9000 -9000
Net Cash Flow from Investing
Activities
-$
9,000
-$
9,000
-$
9,000
Financing Activities
Cash receipts from
Paraphrase This Document
Need a fresh take? Get an instant paraphrase of this document with our AI Paraphraser
Applied Financial Management 11
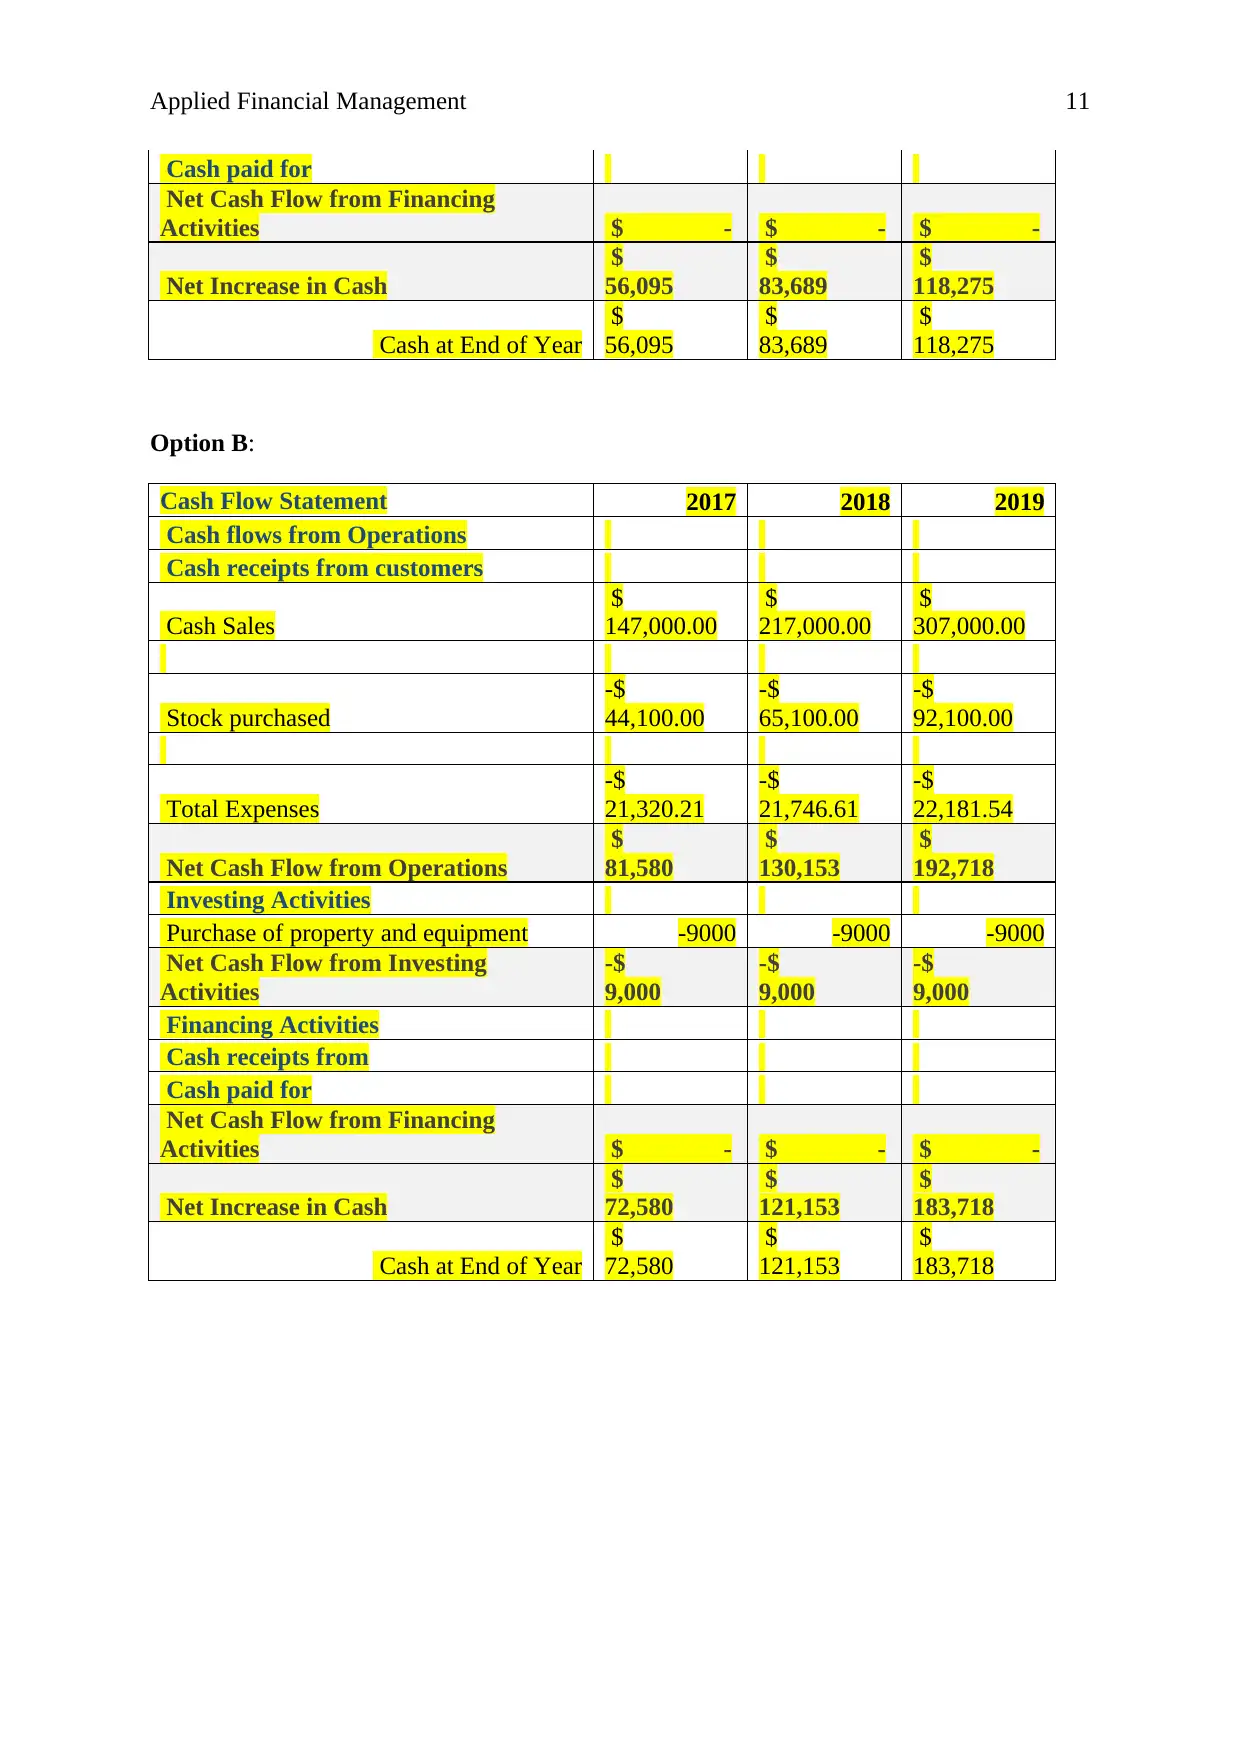
Cash paid for
Net Cash Flow from Financing
Activities $ - $ - $ -
Net Increase in Cash
$
56,095
$
83,689
$
118,275
Cash at End of Year
$
56,095
$
83,689
$
118,275
Option B:
Cash Flow Statement 2017 2018 2019
Cash flows from Operations
Cash receipts from customers
Cash Sales
$
147,000.00
$
217,000.00
$
307,000.00
Stock purchased
-$
44,100.00
-$
65,100.00
-$
92,100.00
Total Expenses
-$
21,320.21
-$
21,746.61
-$
22,181.54
Net Cash Flow from Operations
$
81,580
$
130,153
$
192,718
Investing Activities
Purchase of property and equipment -9000 -9000 -9000
Net Cash Flow from Investing
Activities
-$
9,000
-$
9,000
-$
9,000
Financing Activities
Cash receipts from
Cash paid for
Net Cash Flow from Financing
Activities $ - $ - $ -
Net Increase in Cash
$
72,580
$
121,153
$
183,718
Cash at End of Year
$
72,580
$
121,153
$
183,718
Cash paid for
Net Cash Flow from Financing
Activities $ - $ - $ -
Net Increase in Cash
$
56,095
$
83,689
$
118,275
Cash at End of Year
$
56,095
$
83,689
$
118,275
Option B:
Cash Flow Statement 2017 2018 2019
Cash flows from Operations
Cash receipts from customers
Cash Sales
$
147,000.00
$
217,000.00
$
307,000.00
Stock purchased
-$
44,100.00
-$
65,100.00
-$
92,100.00
Total Expenses
-$
21,320.21
-$
21,746.61
-$
22,181.54
Net Cash Flow from Operations
$
81,580
$
130,153
$
192,718
Investing Activities
Purchase of property and equipment -9000 -9000 -9000
Net Cash Flow from Investing
Activities
-$
9,000
-$
9,000
-$
9,000
Financing Activities
Cash receipts from
Cash paid for
Net Cash Flow from Financing
Activities $ - $ - $ -
Net Increase in Cash
$
72,580
$
121,153
$
183,718
Cash at End of Year
$
72,580
$
121,153
$
183,718
1 out of 11
Related Documents


Your All-in-One AI-Powered Toolkit for Academic Success.
+13062052269
info@desklib.com
Available 24*7 on WhatsApp / Email
![[object Object]](/_next/static/media/star-bottom.7253800d.svg)
Unlock your academic potential
Copyright © 2020–2026 A2Z Services. All Rights Reserved. Developed and managed by ZUCOL.