Wind Augmentation Device Project: Power Efficiency Analysis Report

Verified

Added on  2019/09/20

|10
|1258
|290
Project
AI Summary
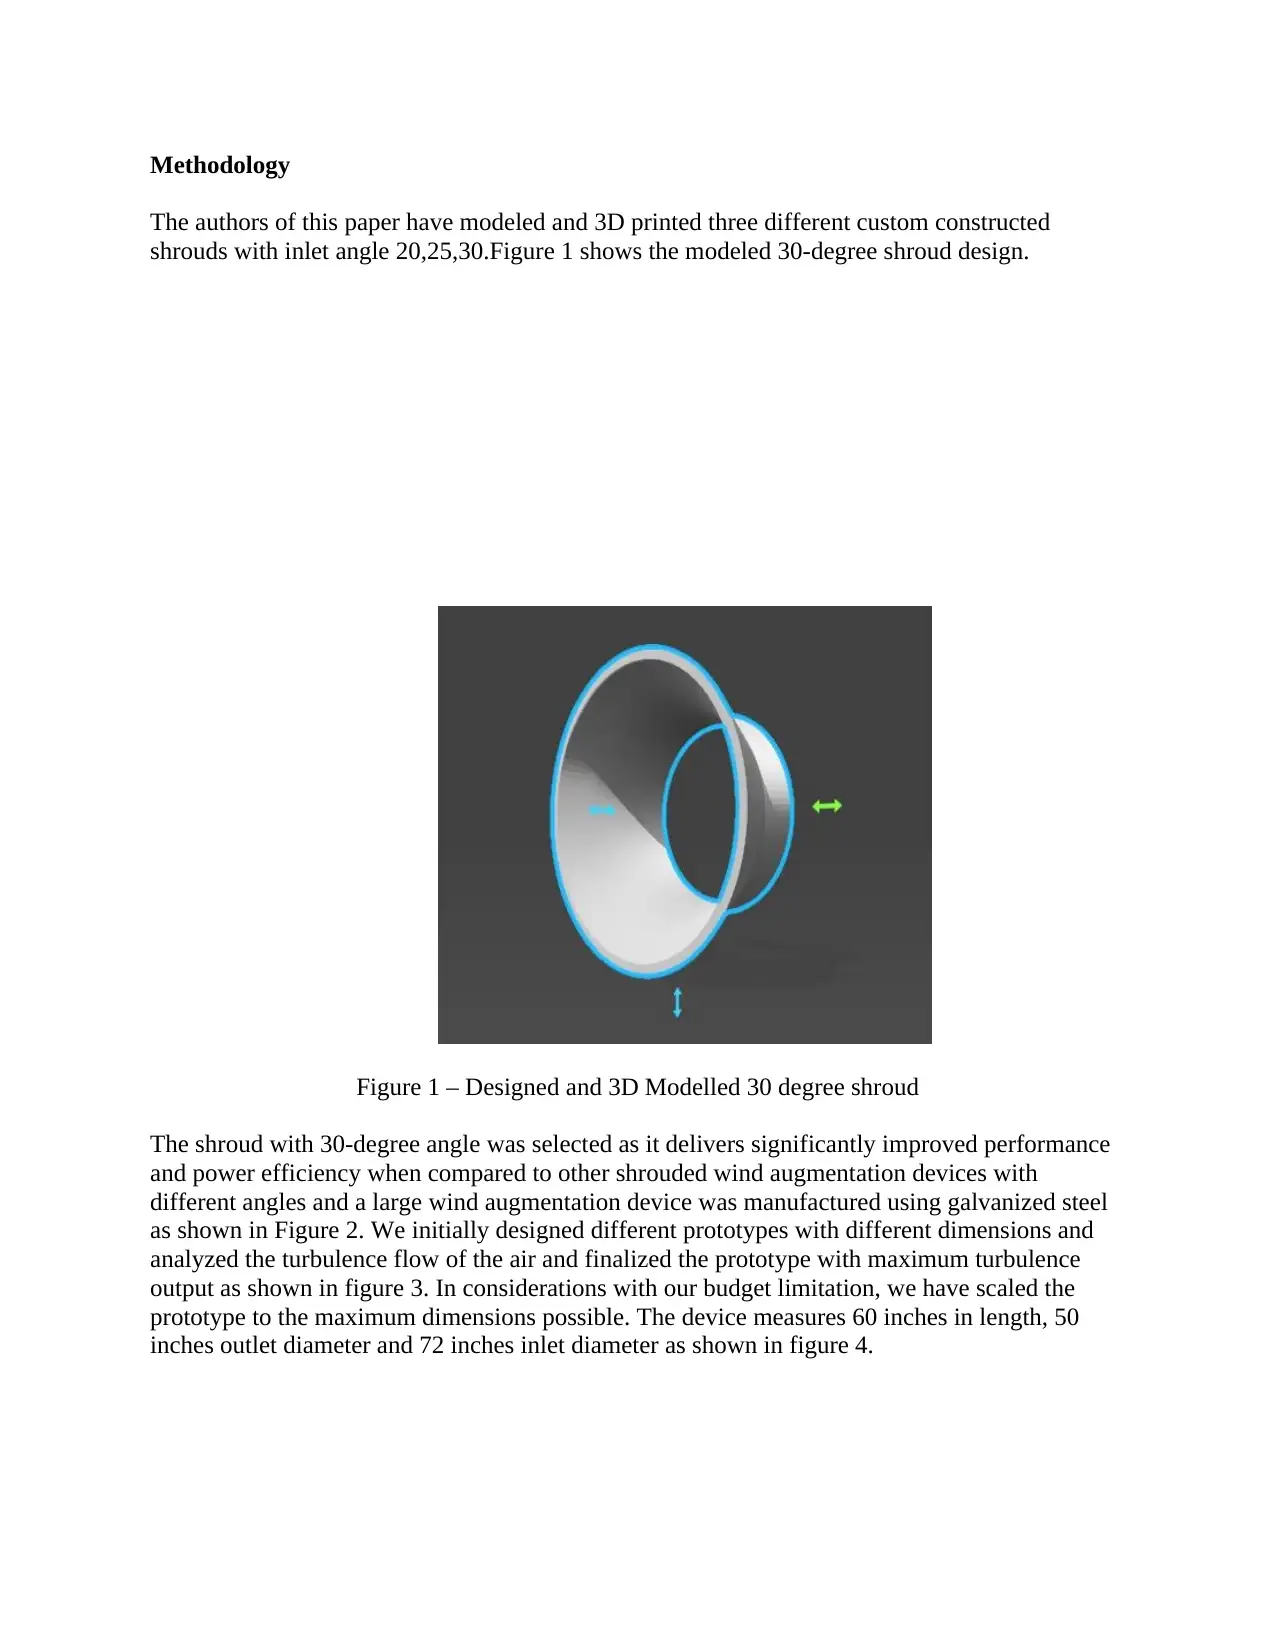
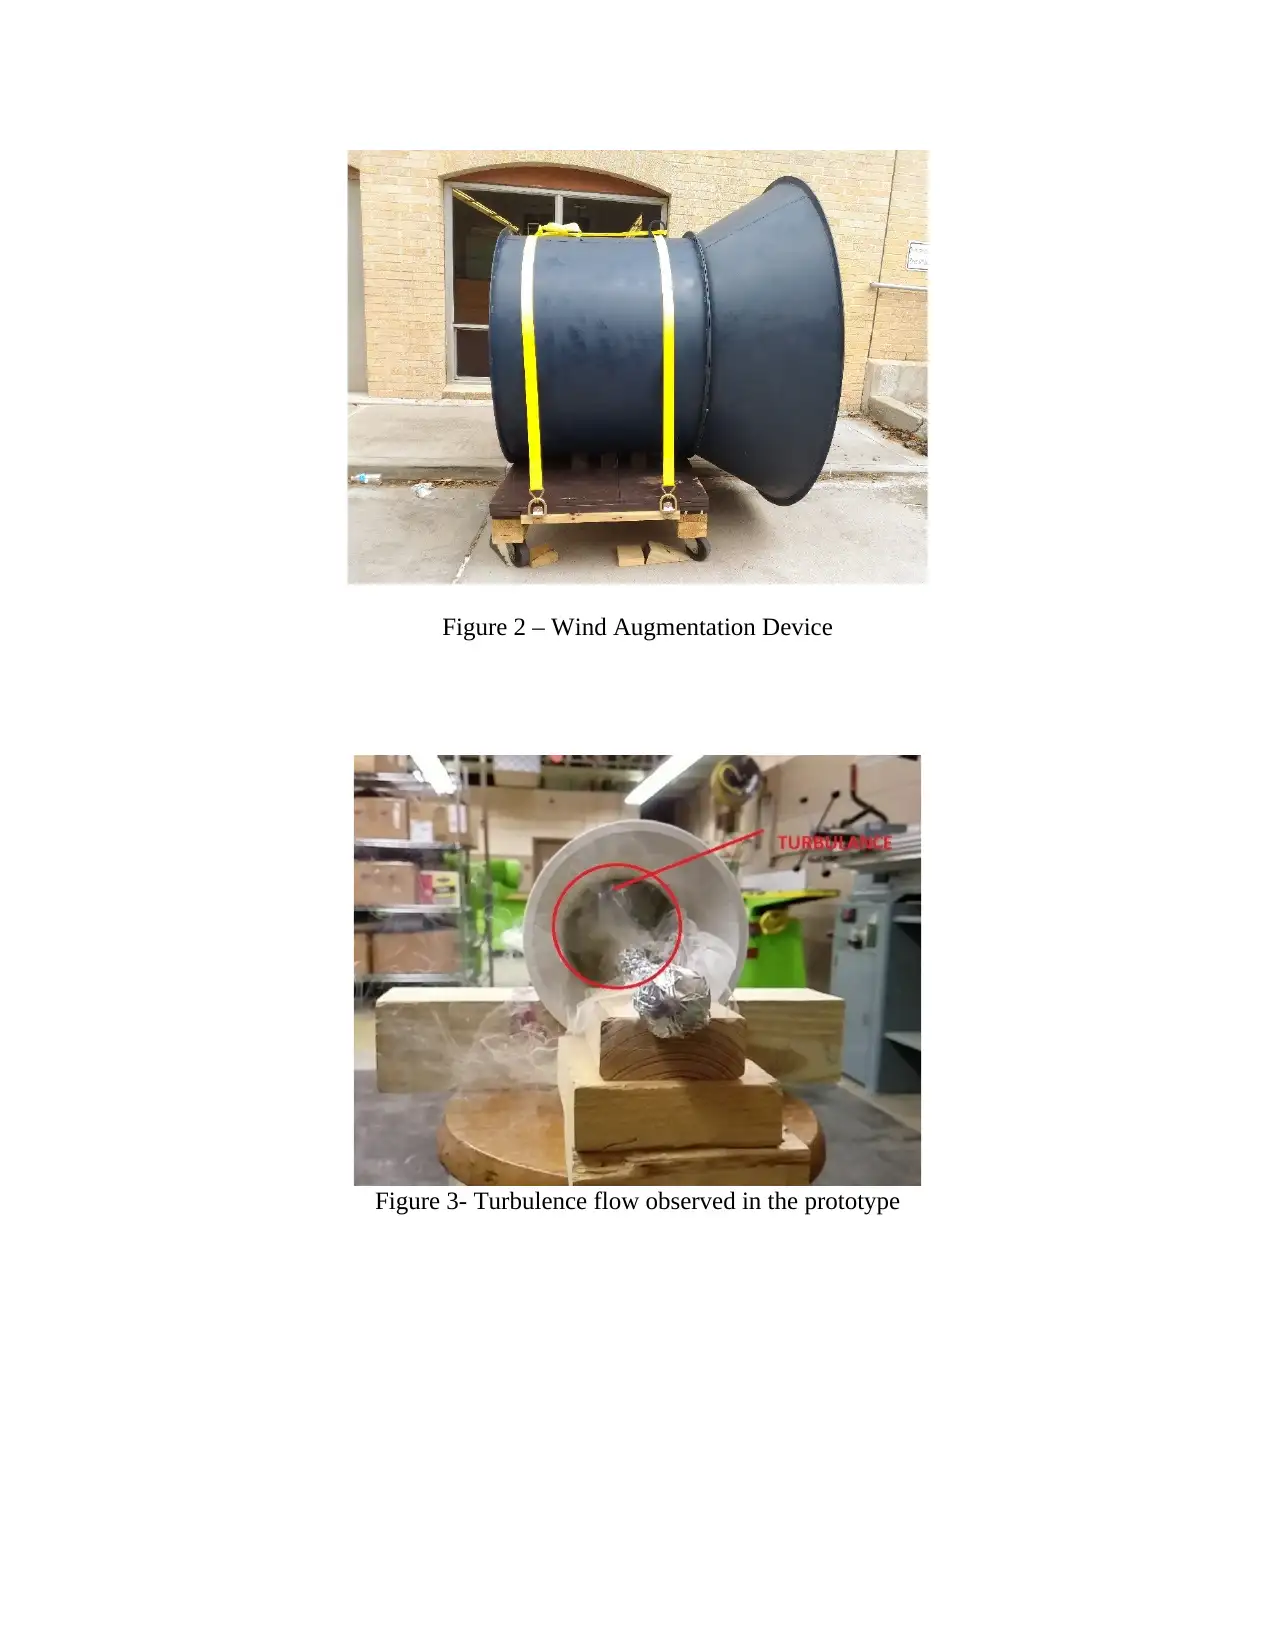
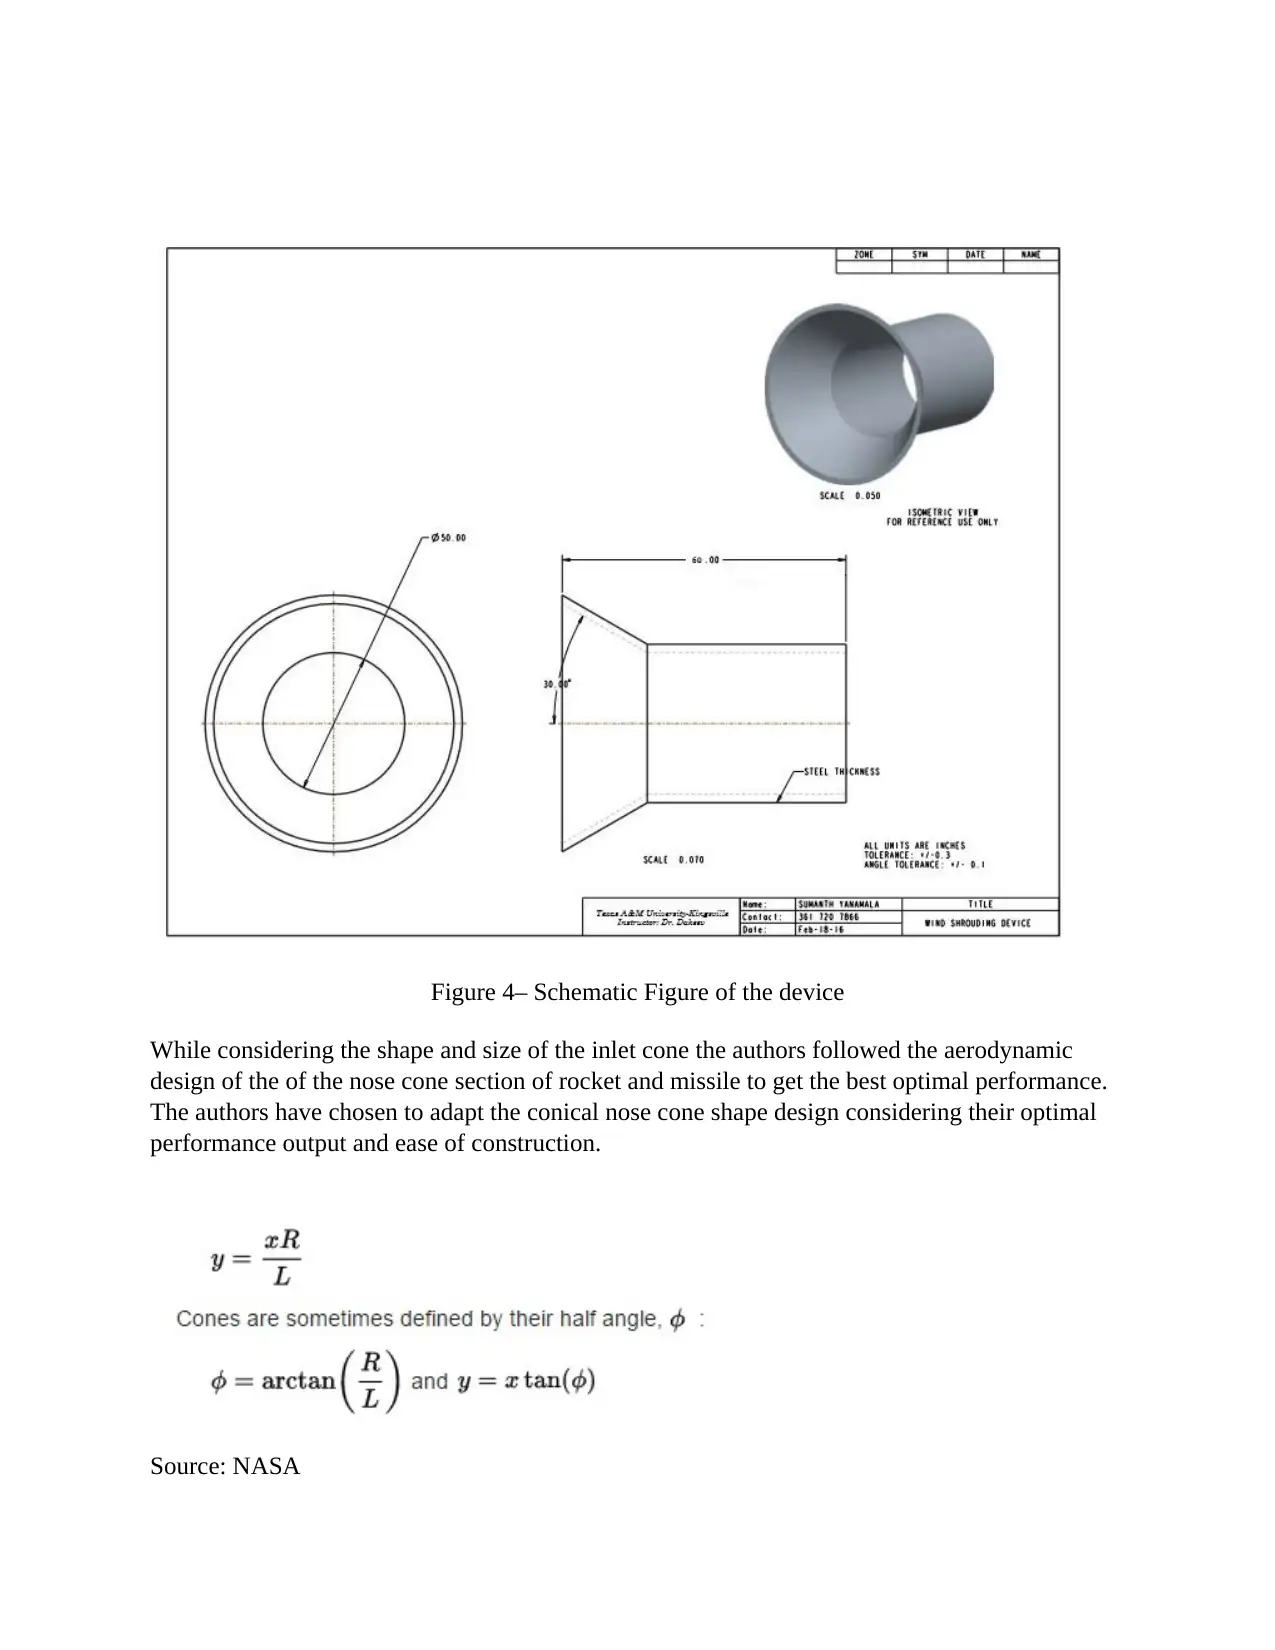
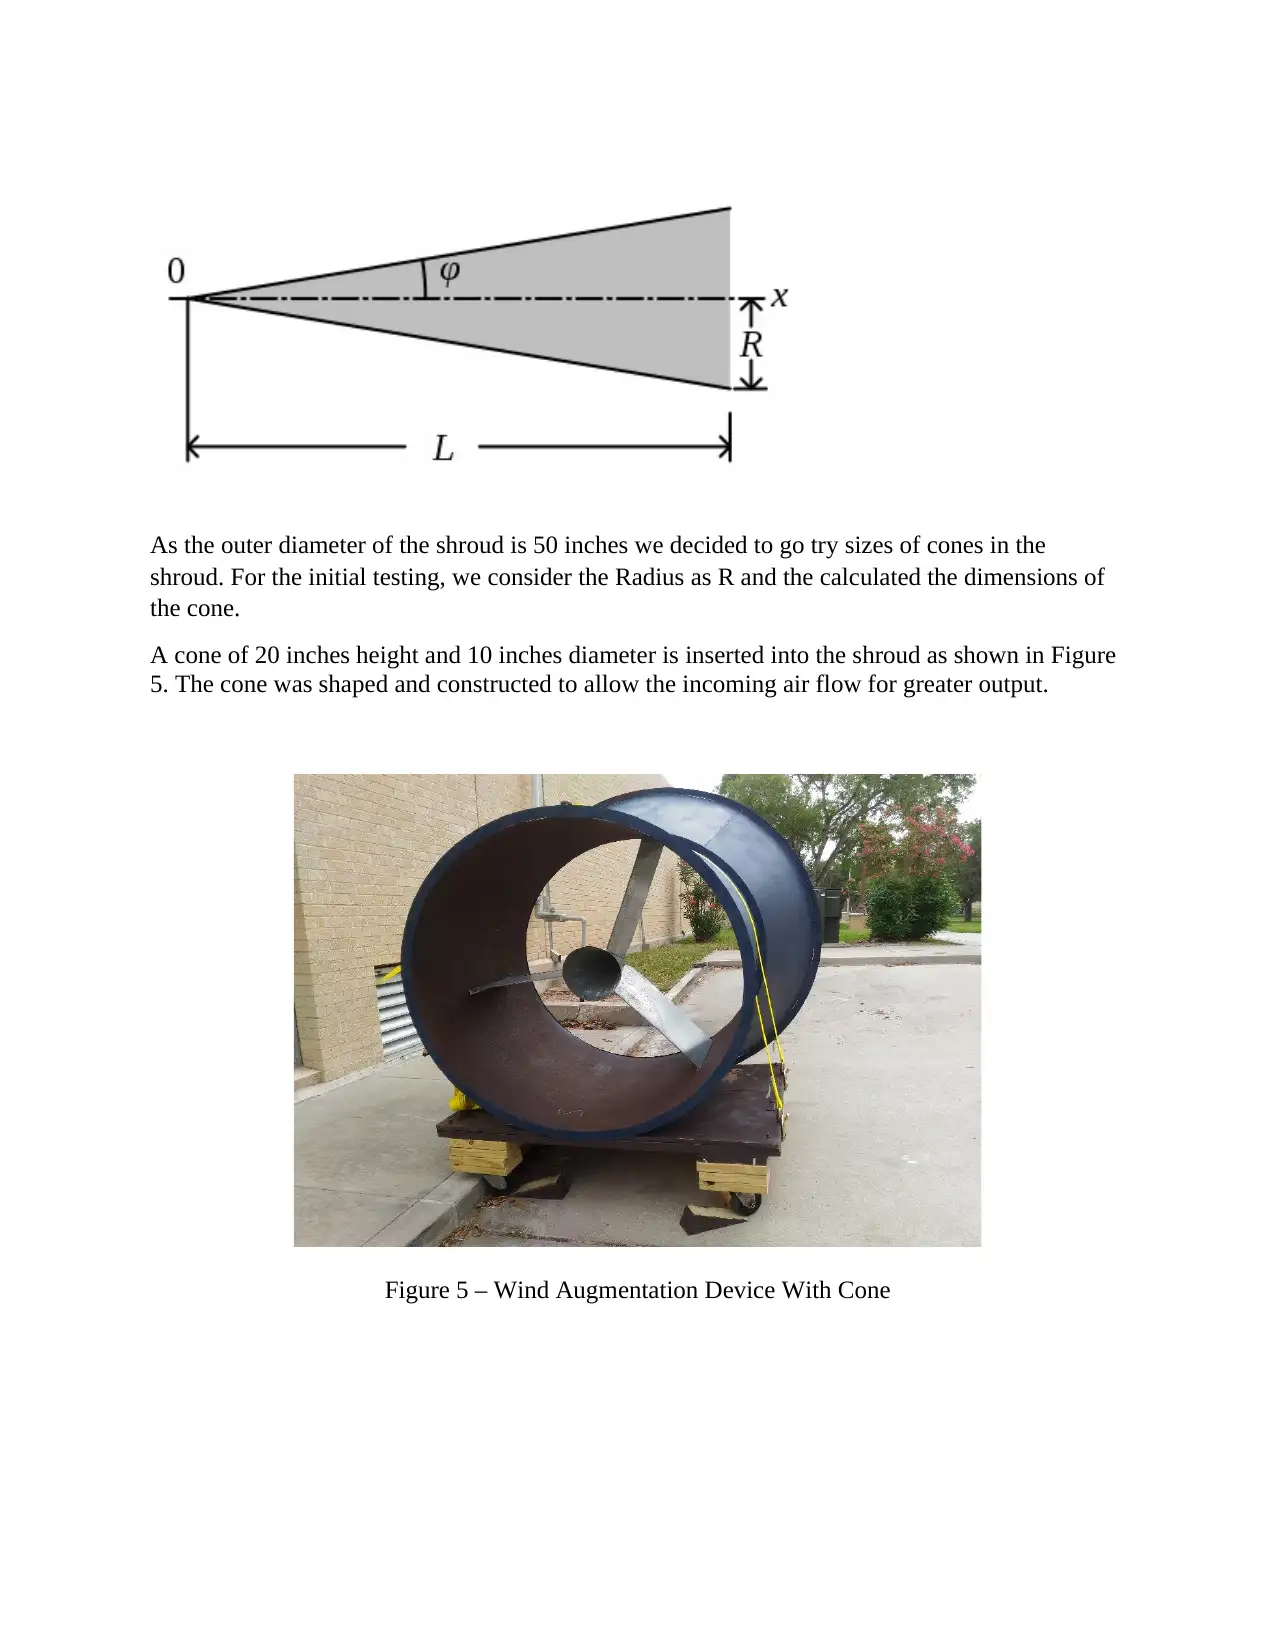
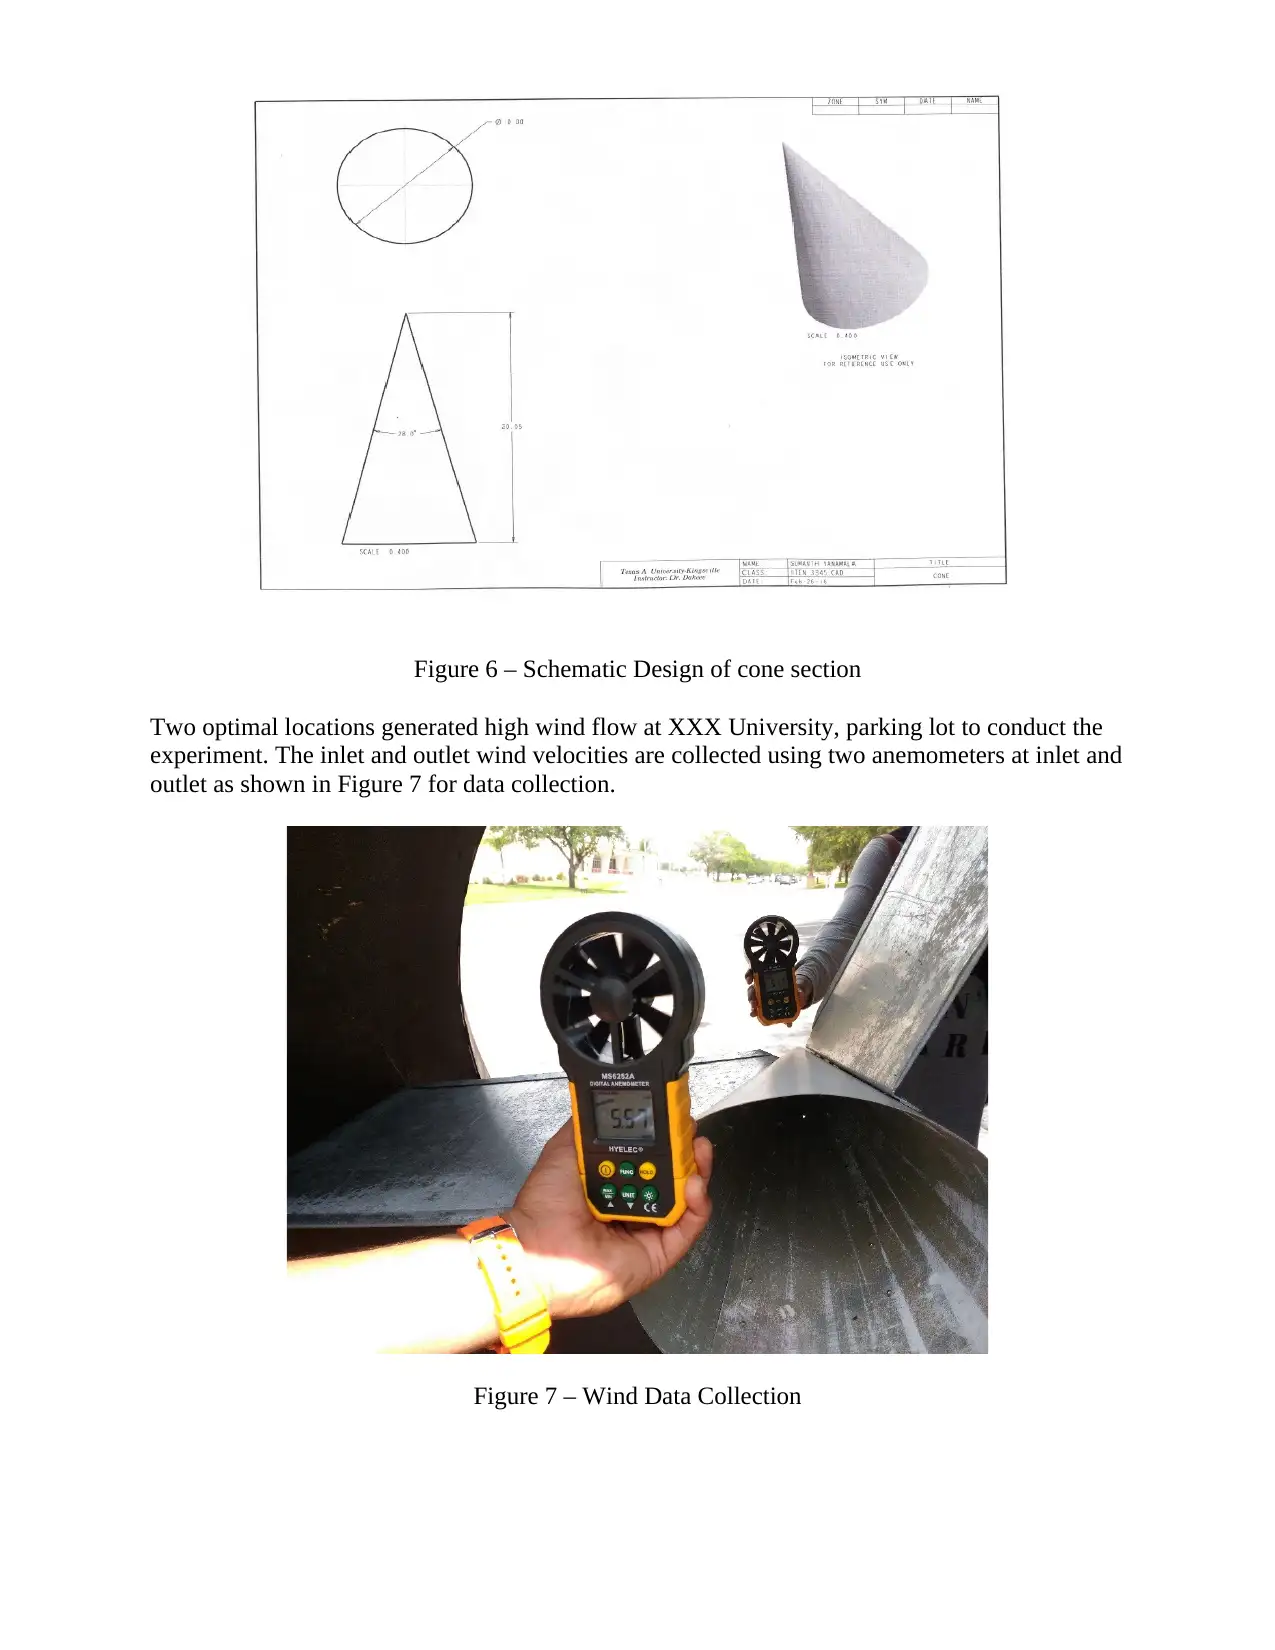
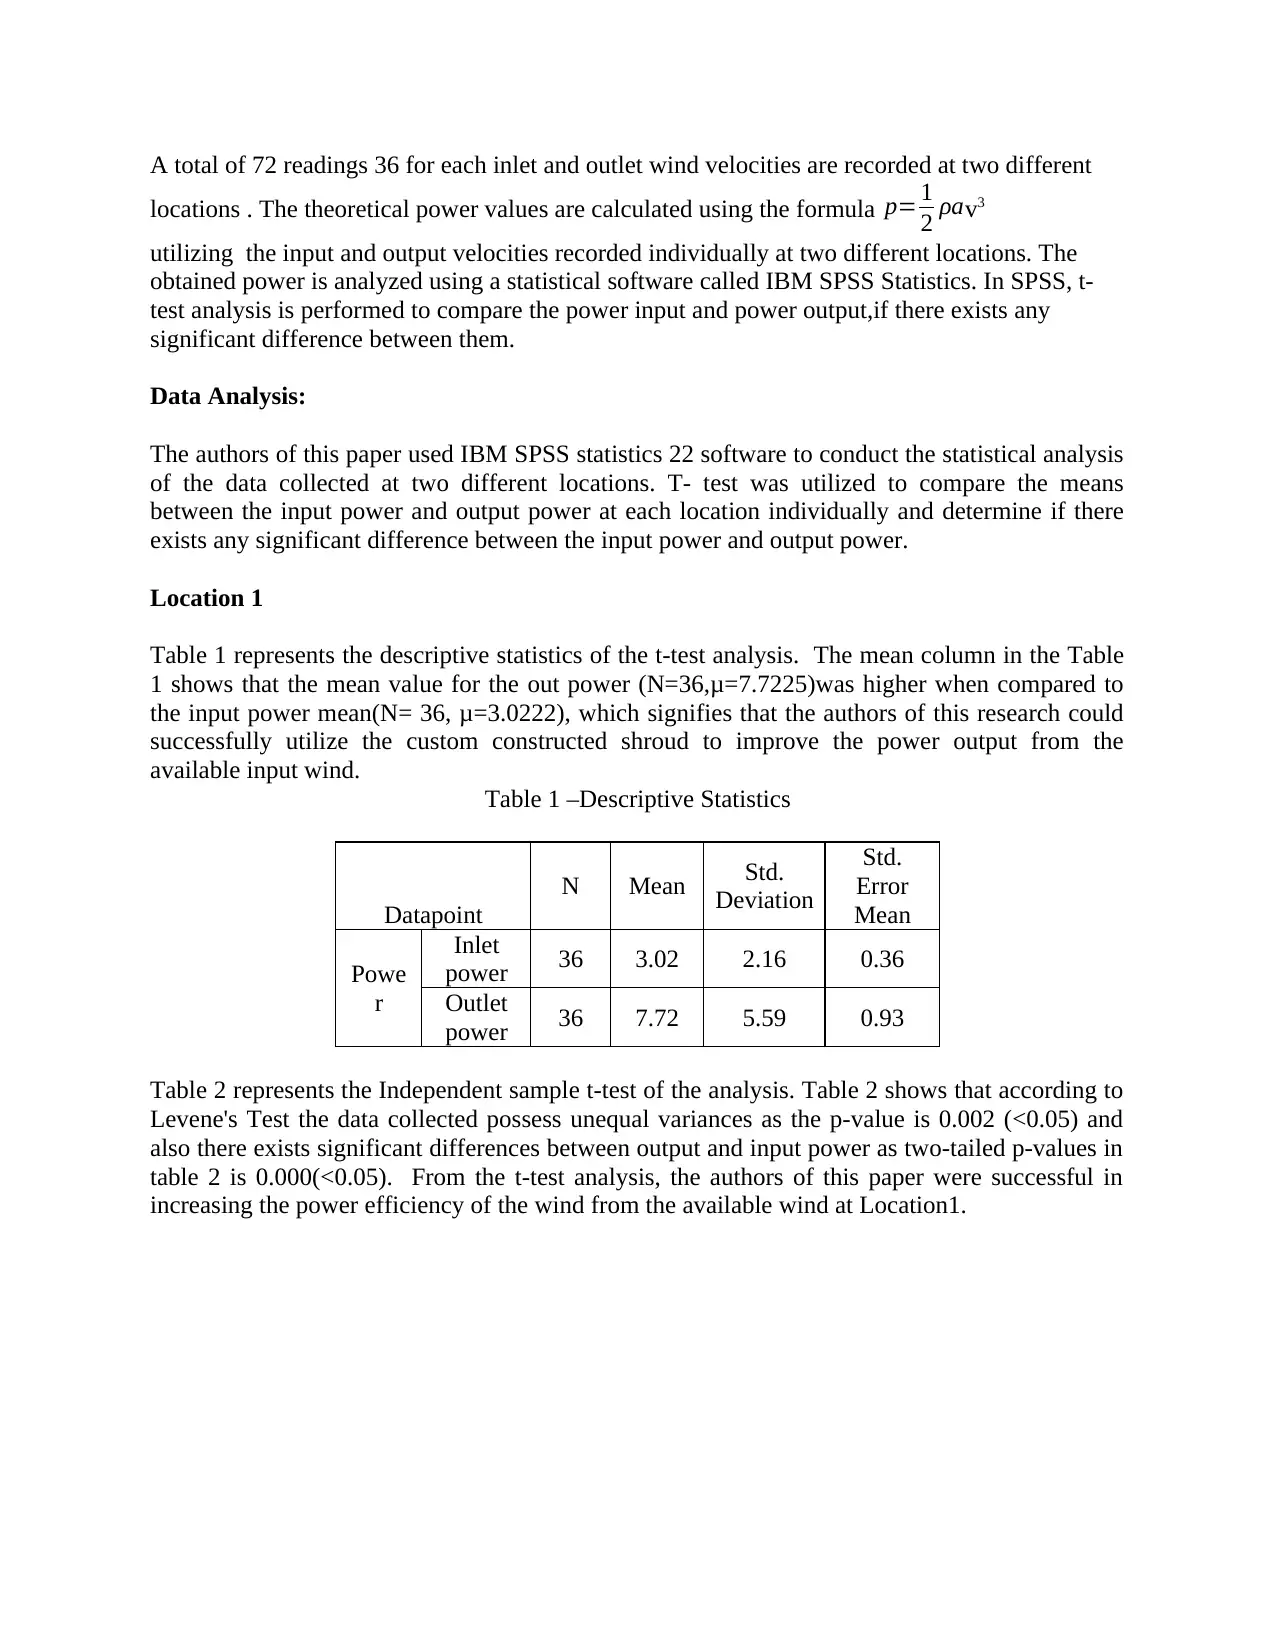
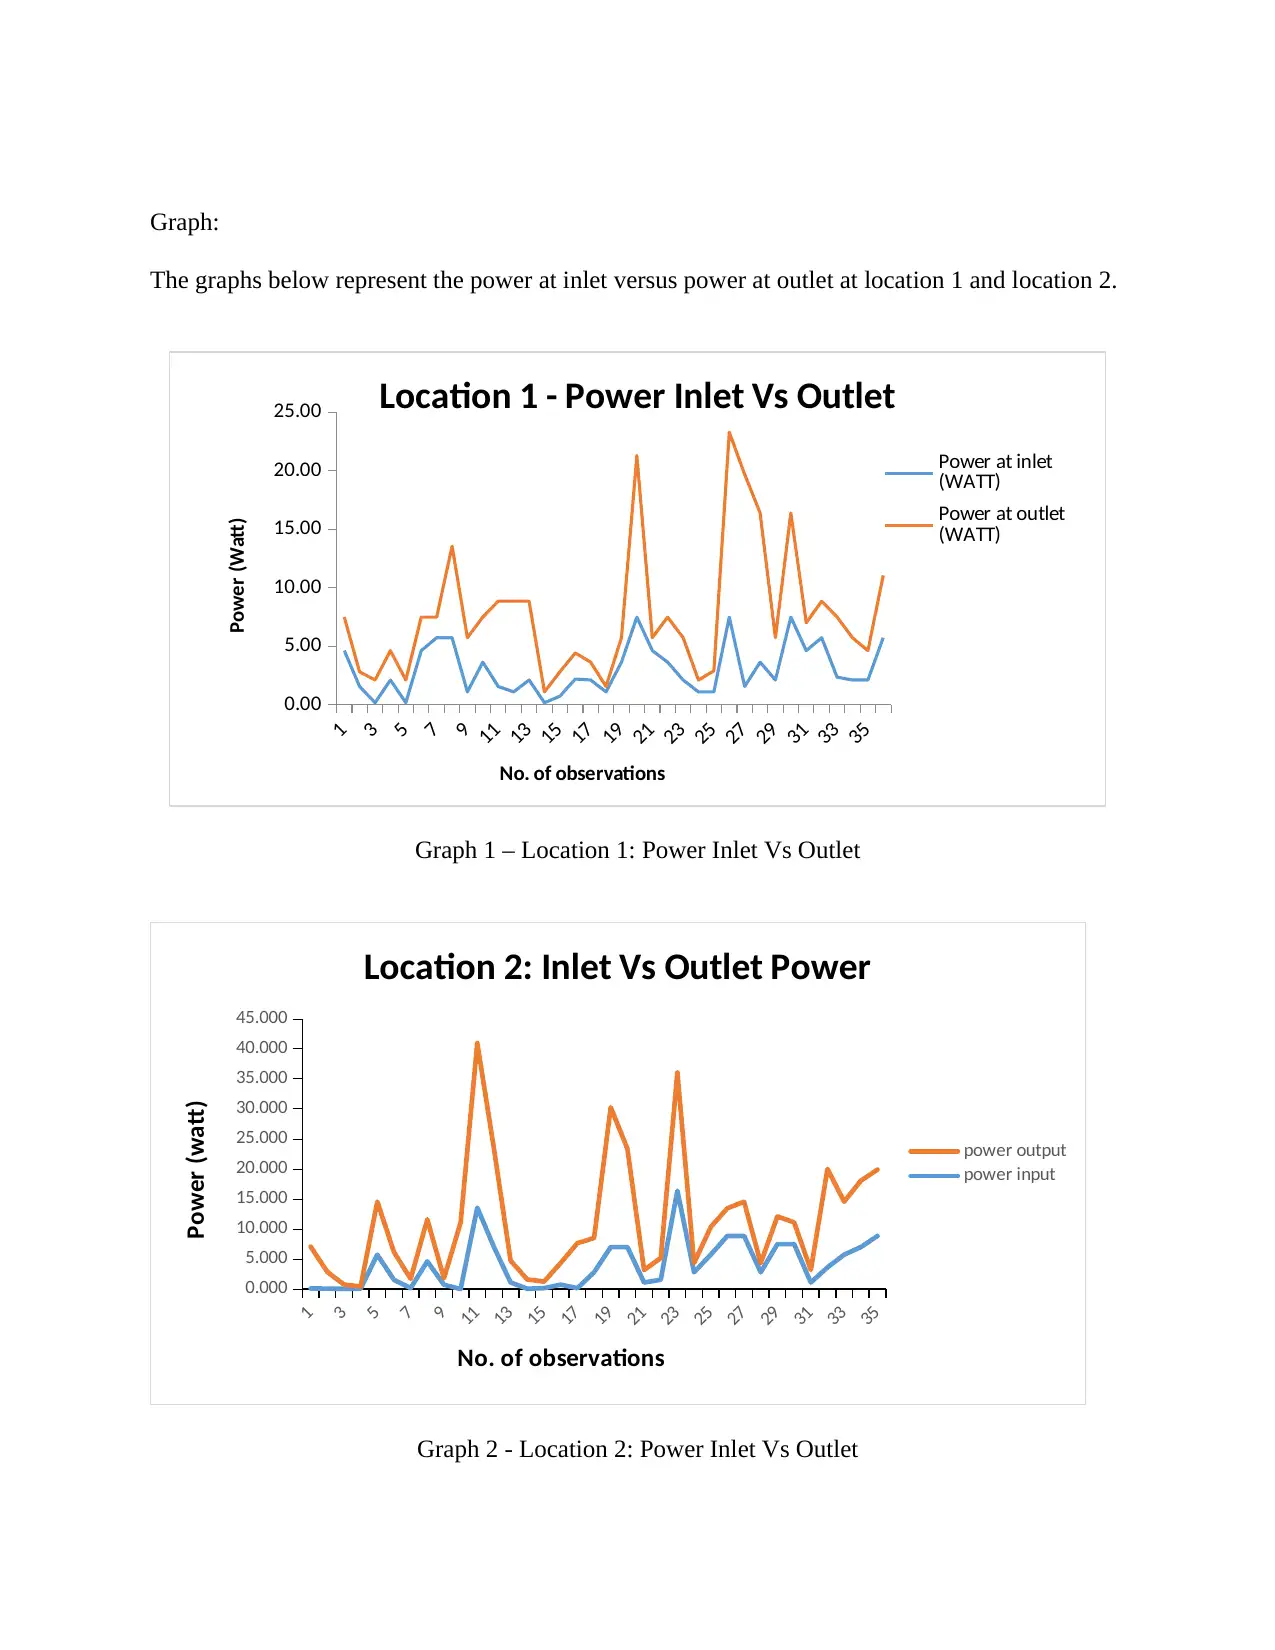
This project details the design, construction, and analysis of a wind augmentation device (WAD) with a 30-degree shroud. The methodology involved 3D modeling and printing of the shroud, followed by the construction of a full-scale WAD using galvanized steel. Prototypes were tested to optimize turbulence flow, and the final design measured 60 inches in length, 50 inches outlet diameter, and 72 inches inlet diameter. Aerodynamic principles, similar to those used in rocket nose cones, were applied to optimize performance. Cones were inserted to enhance airflow. Experiments were conducted at two locations, measuring inlet and outlet wind velocities using anemometers. Data analysis utilized IBM SPSS Statistics 22 software, employing t-tests to compare input and output power. Results indicated significant improvements in power output at both locations, with the outlet power mean significantly higher than the inlet power mean. The findings were compared with the Primus AIR 40 wind turbine specifications, suggesting that the WAD could enable operation at lower cut-in speeds, enhancing the turbine's efficiency. Graphs illustrating power inlet versus outlet were also presented.
tabler-icon-diamond-filled.svg

Contribute Materials

Your contribution can guide someone’s learning journey. Share your documents today.
Document Page
Methodology
The authors of this paper have modeled and 3D printed three different custom constructed
shrouds with inlet angle 20,25,30.Figure 1 shows the modeled 30-degree shroud design.
Figure 1 – Designed and 3D Modelled 30 degree shroud
The shroud with 30-degree angle was selected as it delivers significantly improved performance
and power efficiency when compared to other shrouded wind augmentation devices with
different angles and a large wind augmentation device was manufactured using galvanized steel
as shown in Figure 2. We initially designed different prototypes with different dimensions and
analyzed the turbulence flow of the air and finalized the prototype with maximum turbulence
output as shown in figure 3. In considerations with our budget limitation, we have scaled the
prototype to the maximum dimensions possible. The device measures 60 inches in length, 50
inches outlet diameter and 72 inches inlet diameter as shown in figure 4.
tabler-icon-diamond-filled.svg

Secure Best Marks with AI Grader

Need help grading? Try our AI Grader for instant feedback on your assignments.
Document Page
Figure 2 – Wind Augmentation Device
Figure 3- Turbulence flow observed in the prototype
Document Page
Figure 4– Schematic Figure of the device
While considering the shape and size of the inlet cone the authors followed the aerodynamic
design of the of the nose cone section of rocket and missile to get the best optimal performance.
The authors have chosen to adapt the conical nose cone shape design considering their optimal
performance output and ease of construction.
Source: NASA
Document Page
As the outer diameter of the shroud is 50 inches we decided to go try sizes of cones in the
shroud. For the initial testing, we consider the Radius as R and the calculated the dimensions of
the cone.
A cone of 20 inches height and 10 inches diameter is inserted into the shroud as shown in Figure
5. The cone was shaped and constructed to allow the incoming air flow for greater output.
Figure 5 – Wind Augmentation Device With Cone
tabler-icon-diamond-filled.svg

Secure Best Marks with AI Grader

Need help grading? Try our AI Grader for instant feedback on your assignments.
Document Page
Figure 6 – Schematic Design of cone section
Two optimal locations generated high wind flow at XXX University, parking lot to conduct the
experiment. The inlet and outlet wind velocities are collected using two anemometers at inlet and
outlet as shown in Figure 7 for data collection.
Figure 7 – Wind Data Collection
Document Page
A total of 72 readings 36 for each inlet and outlet wind velocities are recorded at two different
locations . The theoretical power values are calculated using the formula p= 1
2 ρav3
utilizing the input and output velocities recorded individually at two different locations. The
obtained power is analyzed using a statistical software called IBM SPSS Statistics. In SPSS, t-
test analysis is performed to compare the power input and power output,if there exists any
significant difference between them.
Data Analysis:
The authors of this paper used IBM SPSS statistics 22 software to conduct the statistical analysis
of the data collected at two different locations. T- test was utilized to compare the means
between the input power and output power at each location individually and determine if there
exists any significant difference between the input power and output power.
Location 1
Table 1 represents the descriptive statistics of the t-test analysis. The mean column in the Table
1 shows that the mean value for the out power (N=36,μ=7.7225)was higher when compared to
the input power mean(N= 36, μ=3.0222), which signifies that the authors of this research could
successfully utilize the custom constructed shroud to improve the power output from the
available input wind.
Table 1 –Descriptive Statistics
Datapoint
N Mean Std.
Deviation
Std.
Error
Mean
Powe
r
Inlet
power 36 3.02 2.16 0.36
Outlet
power 36 7.72 5.59 0.93
Table 2 represents the Independent sample t-test of the analysis. Table 2 shows that according to
Levene's Test the data collected possess unequal variances as the p-value is 0.002 (<0.05) and
also there exists significant differences between output and input power as two-tailed p-values in
table 2 is 0.000(<0.05). From the t-test analysis, the authors of this paper were successful in
increasing the power efficiency of the wind from the available wind at Location1.
Document Page
Table 2 – t-Test For Equality of Means
Levene's
Test t-test for Equality of Means
F Sig. t df
Sig.
(2-
tailed)
Mean
Differ
ence
Std.
Error
Differe
nce
95%
Confidence
Interval of
the
Difference
Low
er
Upp
er
Pow
er
Equal
varianc
es
assume
d
10.74 0.00 -4.71 70.00 0.00 -4.70 1.00 -6.69 -2.71
Equal
varianc
es not
assume
d
-
4.71 45.22 0.00 -4.70 1.00 -6.71 -2.69
Location 2
The descriptive statistics for location 2 is represented by Table 3. The mean section in table 3
reveals that the mean value for the inlet power and outlet power. Outlet power mean value
(N=36,μ=8.5463) is higher when compared to the inlet power mean value (N= 36, μ=4.8514),
which signifies that the power output can be amplified by the utilization of 30° custom
constructed shroud.
Table 3 – Statistical Analysis
Datapoint N Mean Std.
Deviation
Std.
Error
Mean
Power
Inlet
power 36 4.48 4.85 0.81
Outlet
power 36 8.55 10.40 1.73
The Independent sample t-Test for the readings recorded at location 2 is represented by Table 4.
The data collected at location 2 has unequal variances according to the Levene’s test which state
that the data possessing unequal variance (p<0.05) violate homogeneity of variances. The two-
tabler-icon-diamond-filled.svg

Paraphrase This Document

Need a fresh take? Get an instant paraphrase of this document with our AI Paraphraser
Document Page
tailed sig. (p-value) in Table 4 reveals that there exist significant differences between output and
input power as p-value is 0.037(<0.05). The t-test for equality of means data results signifies that
there is a significant difference between the wind power at inlet and outlet sections of the shroud
recorded at location 2.
Table 4 – t-Test for Equality of Means
Levene's Test
for Equality
of Variances t-test for Equality of Means
F Sig. t df
Sig. (2-
tailed)
Mea
n
Diff
eren
ce
Std.
Error
Differ
ence
95%
Confidence
Interval of
the
Difference
Lowe
r
Uppe
r
Power Equal
varian
ces
assum
ed
4.68 0.03 -2.12 70.00 0.04 -4.06 1.91 -7.88 -0.25
Equal
varian
ces not
assum
ed
-2.12 49.55 0.04 -4.06 1.91 -7.90 -0.22
The researchers of this paper used the Primus AIR 40 wind turbine manufactured by Primus
Wind Power company as a reference to compare the theoretical efficiency in the power they
achieved using the shroud. The technical specifications of the wind turbine provided by the
manufacturer included that the wind speed operating range of the turbine to be between 3.1 - 22
m/s. Beltz's law states that the maximum kinetic energy a wind turbine can utilize is 59.3% from
the available wind [15]. One of the data values collected by the authors recorded outlet velocity as
3.37 m/s and the inlet velocity was 2.66 m/s. This shows that the Primus AIR 40 wind turbine if
installed within the wind augmentation shroud system designed by the authors can operate at
lower cut-in speeds (2.66 m/s) than actually specified by the manufacturer (3.1 m/s).
Document Page
Graph:
The graphs below represent the power at inlet versus power at outlet at location 1 and location 2.
1
3
5
7
9
11
13
15
17
19
21
23
25
27
29
31
33
35
0.00
5.00
10.00
15.00
20.00
25.00 Location 1 - Power Inlet Vs Outlet
Power at inlet
(WATT)
Power at outlet
(WATT)
No. of observations
Power (Watt)
Graph 1 – Location 1: Power Inlet Vs Outlet
1
3
5
7
9
11
13
15
17
19
21
23
25
27
29
31
33
35
0.000
5.000
10.000
15.000
20.000
25.000
30.000
35.000
40.000
45.000
Location 2: Inlet Vs Outlet Power
power output
power input
No. of observations
Power (watt)
Graph 2 - Location 2: Power Inlet Vs Outlet
Document Page
chevron_up_icon
1 out of 10
circle_padding
hide_on_mobile
zoom_out_icon
logo.png

Your All-in-One AI-Powered Toolkit for Academic Success.

Available 24*7 on WhatsApp / Email

[object Object]