Comprehensive Wind Speed Data Analysis & Linear Forecasting
VerifiedAdded on 2023/06/10
|12
|1072
|129
Report
AI Summary
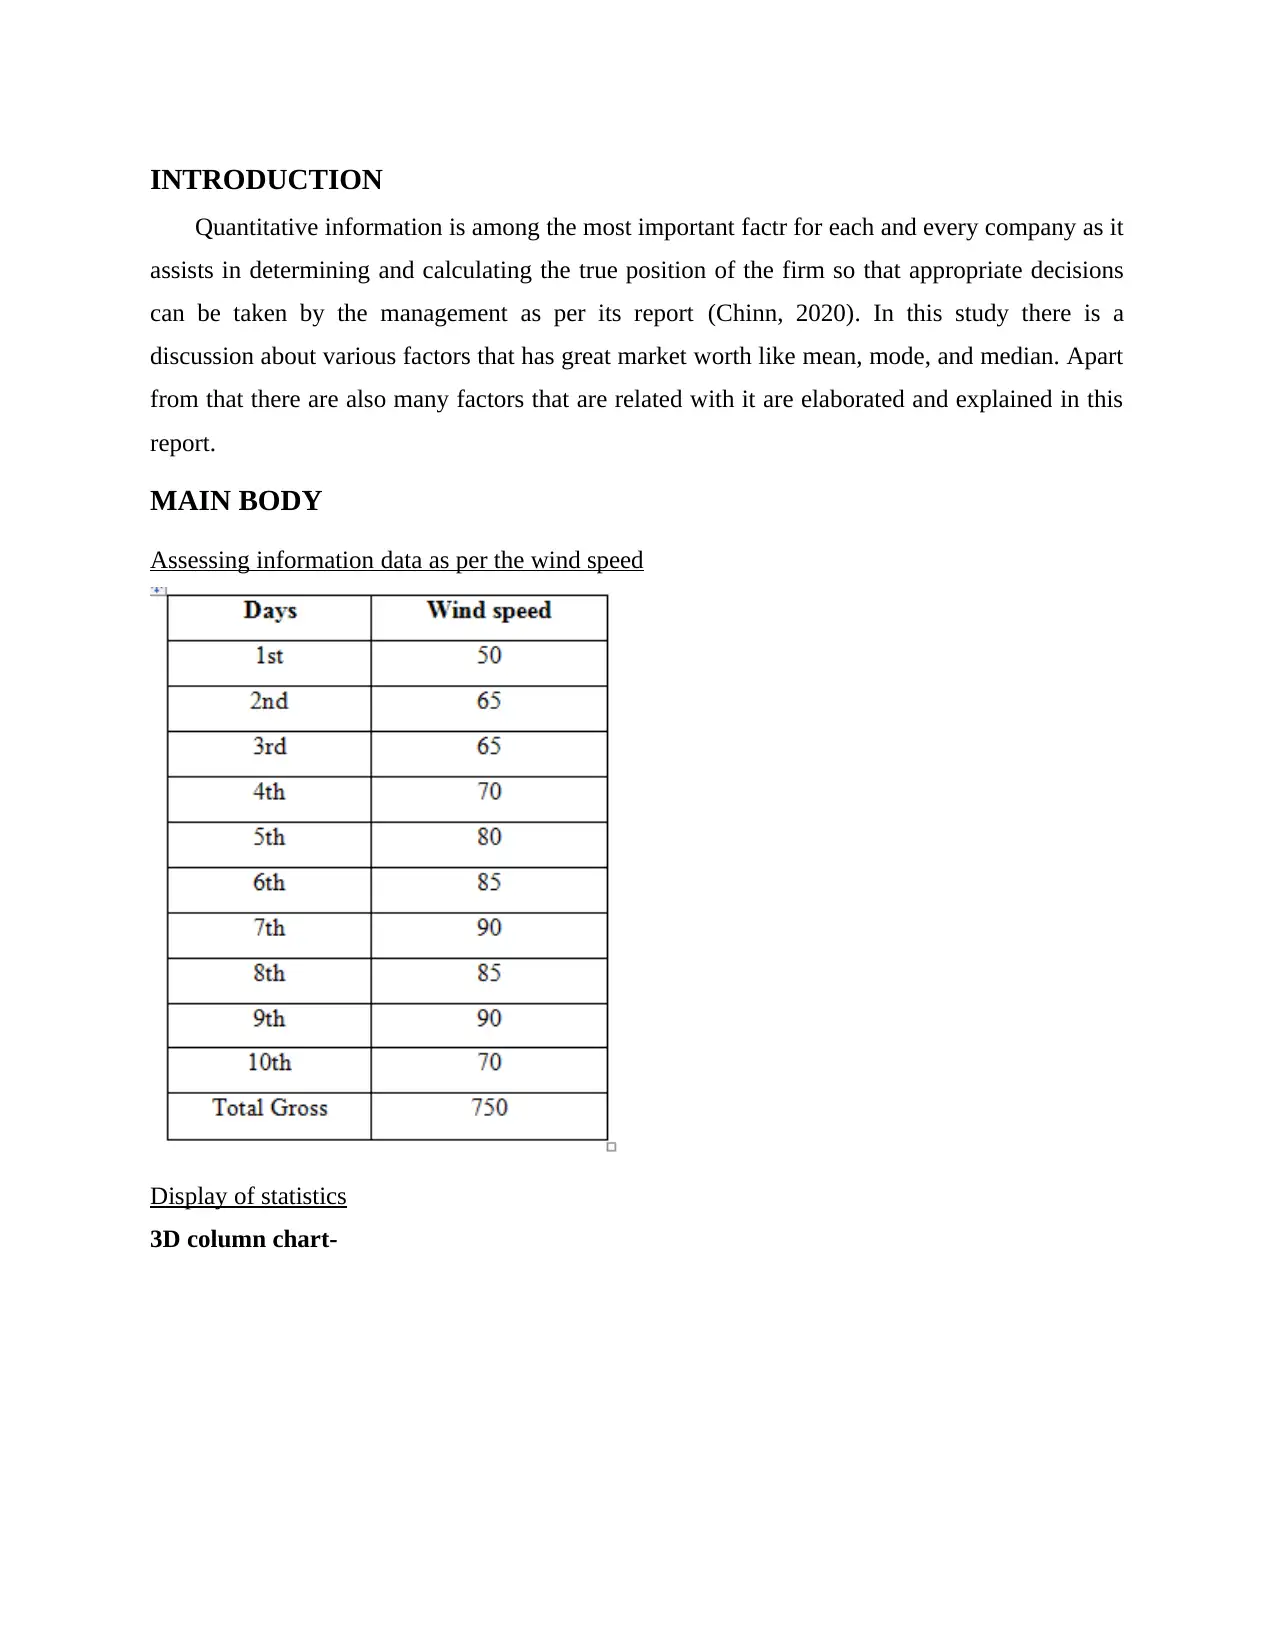
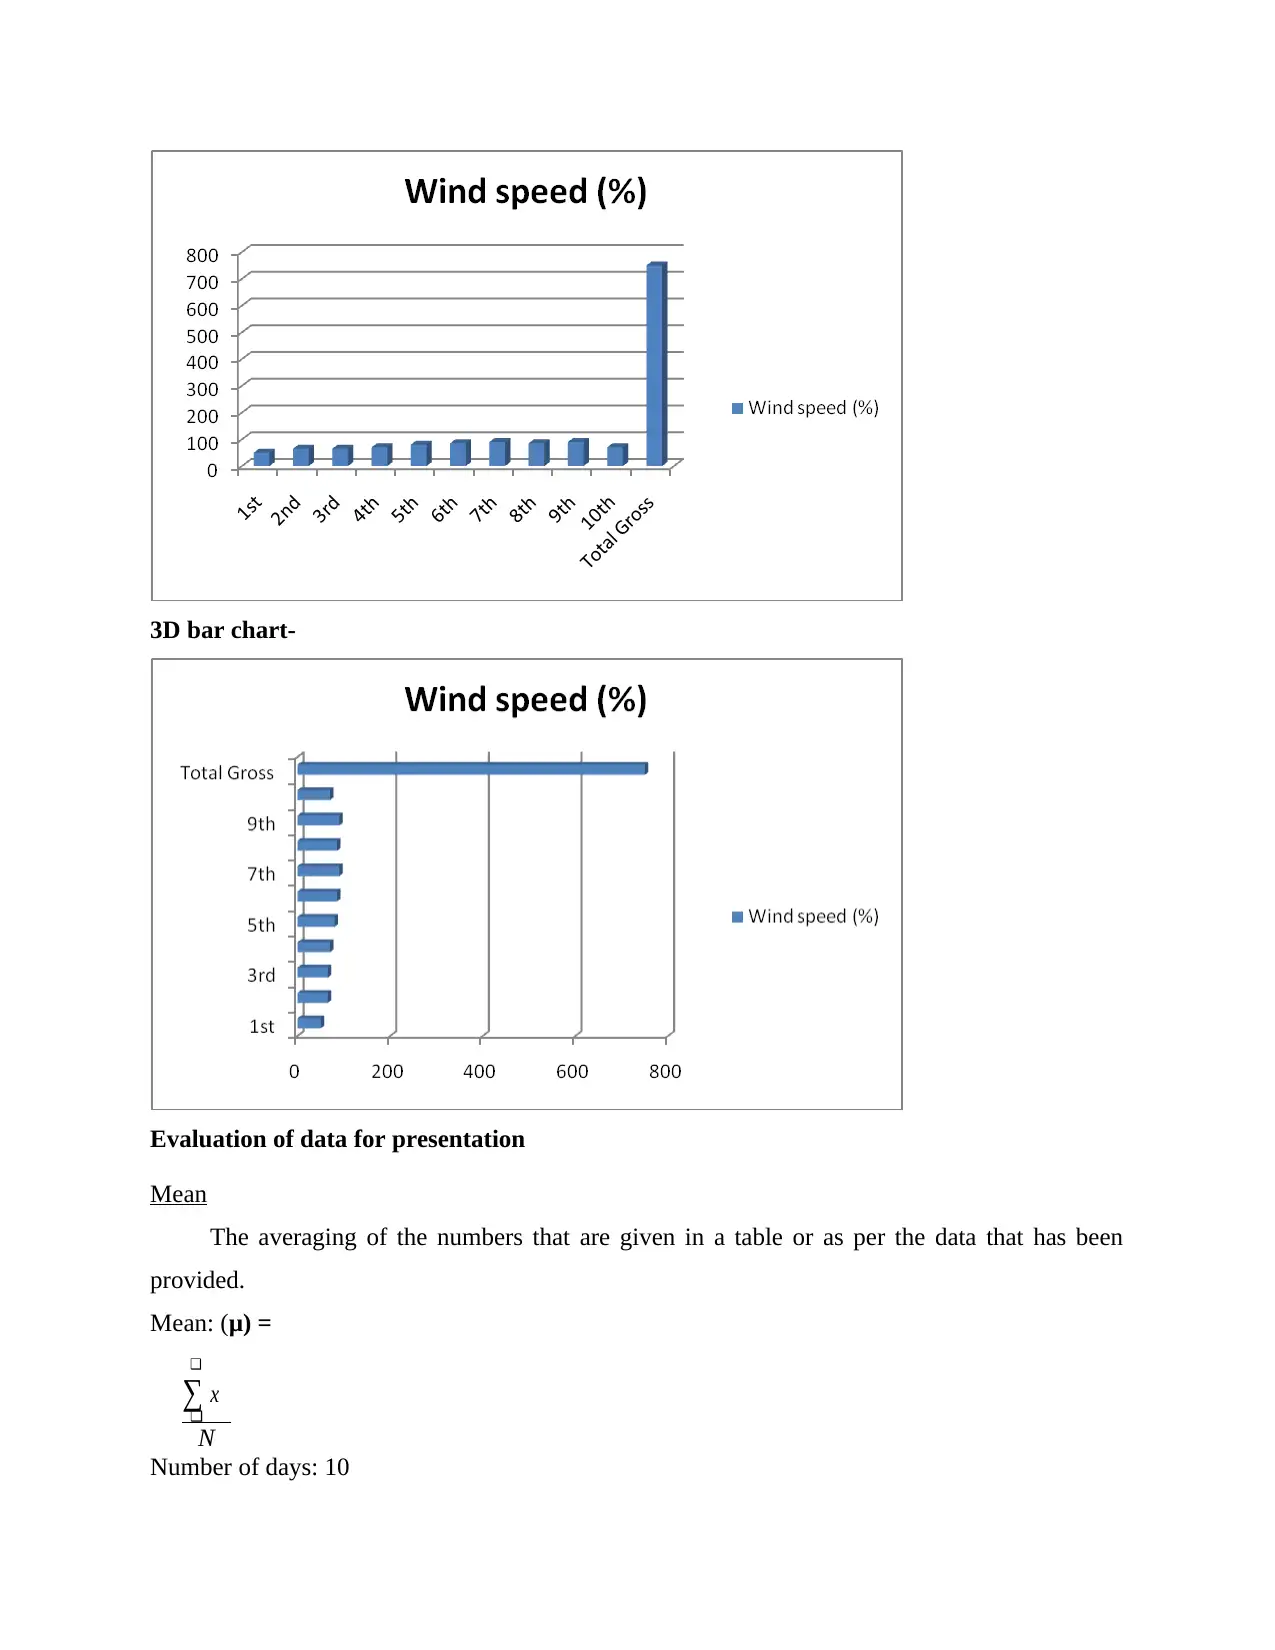
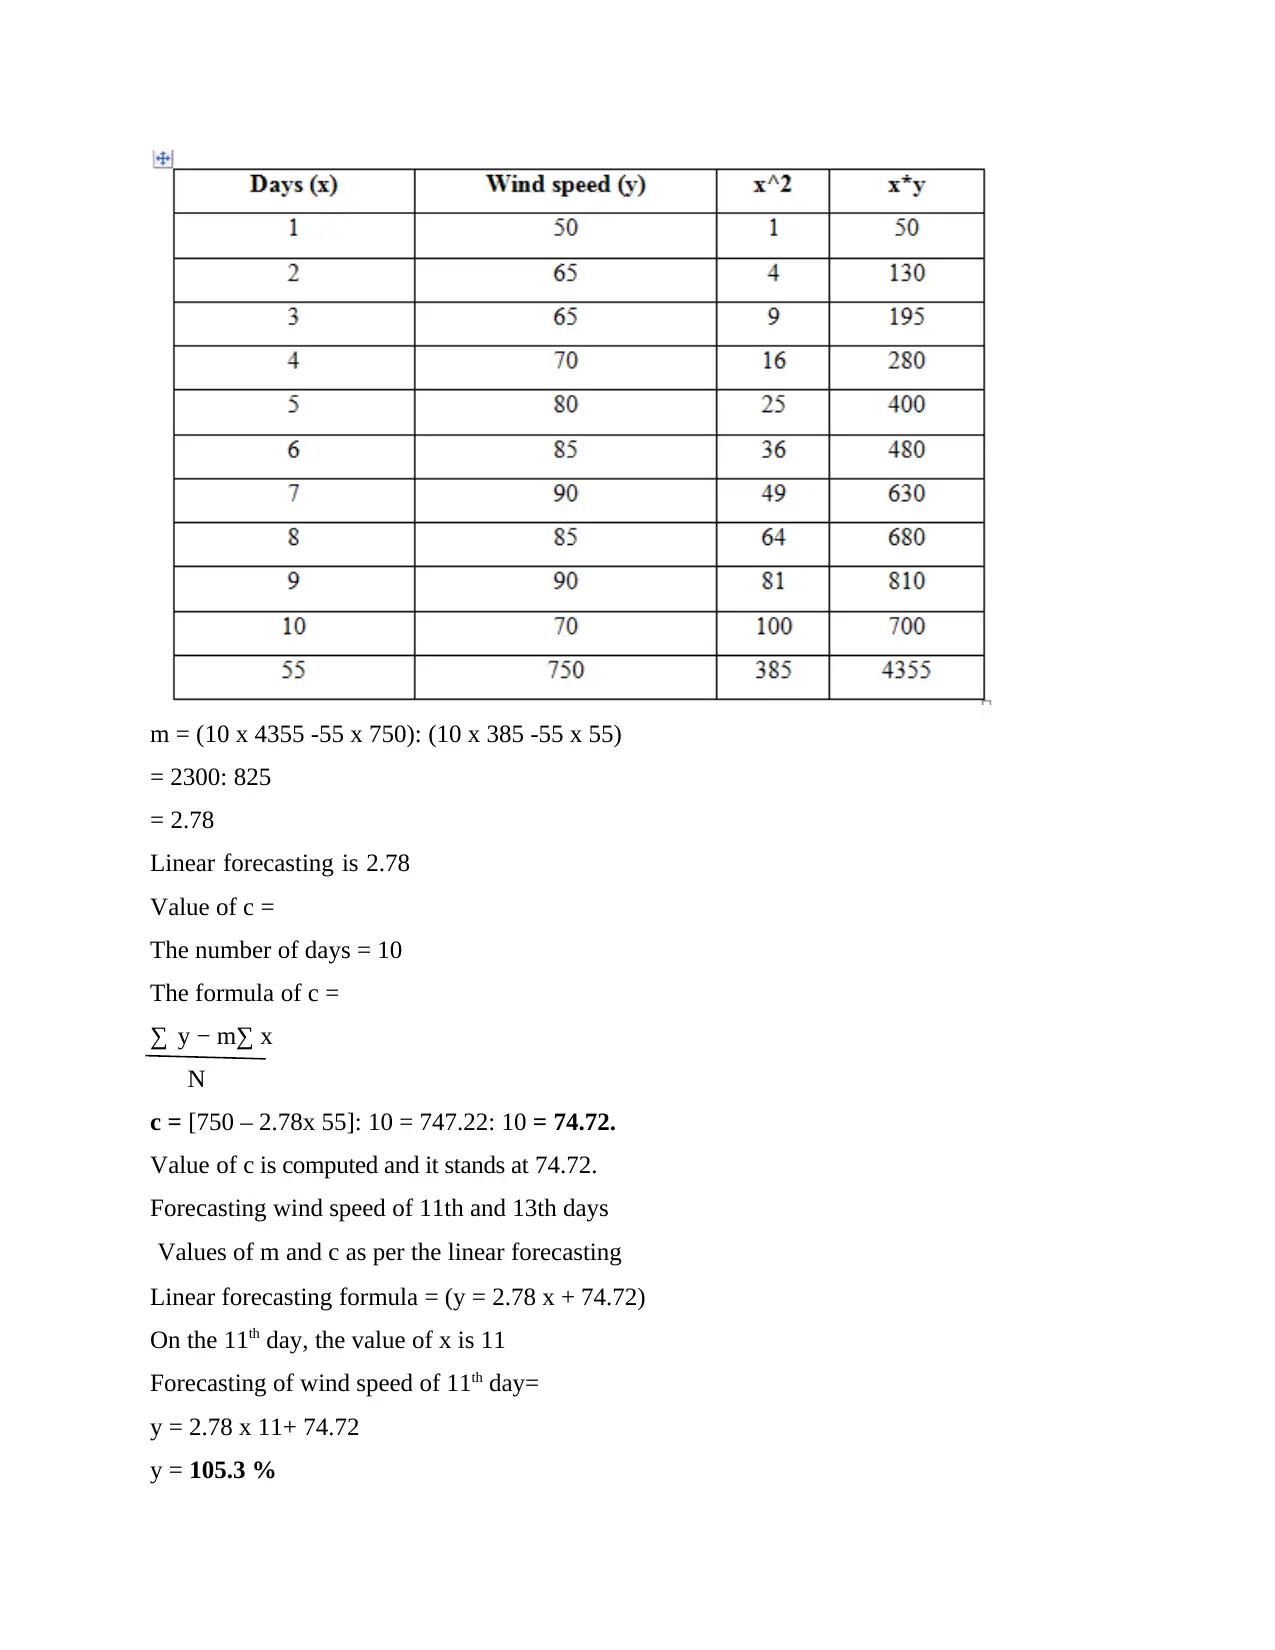
This report provides a comprehensive analysis of wind speed data using various statistical methods and linear forecasting techniques. It begins by assessing the information data as per the wind speed and displays relevant statistics using 3D column and bar charts. The report then delves into calculating and interpreting key statistical measures, including mean, mode, median, range, and standard deviation, to understand the central tendencies and variability within the dataset. Furthermore, linear forecasting is applied to predict future wind speeds, with calculations and interpretations provided for the 11th and 13th days. The conclusion highlights the importance of these analytical factors for companies in the long run, emphasizing the need for accurate calculations to aid in effective decision-making.

Data Analysis and
Forecasting
Forecasting
Paraphrase This Document
Need a fresh take? Get an instant paraphrase of this document with our AI Paraphraser

Contents
Contents...........................................................................................................................................2
INTRODUCTION...........................................................................................................................1
MAIN BODY..................................................................................................................................1
Assessing information data as per the wind speed......................................................................1
Display of statistics......................................................................................................................1
Mean............................................................................................................................................2
Mode............................................................................................................................................3
Median.........................................................................................................................................3
Range...........................................................................................................................................4
Standard Deviation......................................................................................................................5
Linear Forecasting.......................................................................................................................6
CONCLUSION................................................................................................................................8
REFERENCES................................................................................................................................9

⊘ This is a preview!⊘
Do you want full access?
Subscribe today to unlock all pages.

Trusted by 1+ million students worldwide

INTRODUCTION
Quantitative information is among the most important factr for each and every company as it
assists in determining and calculating the true position of the firm so that appropriate decisions
can be taken by the management as per its report (Chinn, 2020). In this study there is a
discussion about various factors that has great market worth like mean, mode, and median. Apart
from that there are also many factors that are related with it are elaborated and explained in this
report.
MAIN BODY
Assessing information data as per the wind speed
Display of statistics
3D column chart-
Paraphrase This Document
Need a fresh take? Get an instant paraphrase of this document with our AI Paraphraser

3D bar chart-
Evaluation of data for presentation
Mean
The averaging of the numbers that are given in a table or as per the data that has been
provided.
Mean: (μ) =
❑
∑ x
❑
N
Number of days: 10
Evaluation of data for presentation
Mean
The averaging of the numbers that are given in a table or as per the data that has been
provided.
Mean: (μ) =
❑
∑ x
❑
N
Number of days: 10

Observing the wind speed: 750
Mean (μ): 750: 10 = 75 %
From the computations that has been done above it can be seen that the mean of the given
dataset is 75 as the total was 750 and the numbers were 10 so after dividing that we got 75 as the
answer.
Mode
It is one of the basic aspect of the statistics as it is the number which appears many a times
in the data and thus it is regarded as the number that has the highest number of frequency in the
given series and thus is called as mode (Hodge and Cobb, 2019).
Number of days =10
Wind speed = 50, 65, 65, 70, 80, 85, 90, 85, 90, 70
Mode = 65%, 70%, 85% and 90%.
As there can be more than one mode or even in certain situations there can be no mode and
thus in the given series there is 4 mode that is 60, 70, 85, and 90 as per the calculations that are
done above.
Median
It is the mid value of any series that is calculated after arranging the data set in a proper
order and thus it calculations are shown below in an effective and efficient manner.
Formula for median = number of terms +1 divided by 2
⊘ This is a preview!⊘
Do you want full access?
Subscribe today to unlock all pages.

Trusted by 1+ million students worldwide

The number of days = 10
Median value of days = (10+ 1): 2 = 11/ 2= 5.5 %
Average median = (upper value + lower value): 2 = [70+80]: 2 = 75 %
It can be seen from the above calculations that the median of the given statistics is 75 after
arranging the series in a manner that is appropriate as per the statistics standards.
Range
It is the difference between the highest and the lowest number of the given data series and
thus is very easy and simple to calculate but it is very useful and beneficial for the company in
the long term scenario (LaDonna, Taylor and Lingard, 2018). Below is the calculation of range
that has been done as per the requirements of the industry.
Range = (Largest value – smallest value)
Key Findings
Largest value of wind speed = 90 %
Smallest value of wind speed = 50%
Range = [90 – 50] = 40%
Paraphrase This Document
Need a fresh take? Get an instant paraphrase of this document with our AI Paraphraser

Standard Deviation
It is the deviation that is considered from the data set and thus is very useful and has many
advantages in the current sector situation and therefore its calculation is shown below (Wang and
Chen, 2019).
Standard deviation (σ) =
x
❑
∑(¿−μ)
2
❑
N
❑√ ¿
Days Wind speed (%) Mean (μ) (x-μ) (x-μ)^2
1st 50 75 (50-75)=-25 625
2nd 65 75 (65-75)=-10 100
3rd 65 75 (65-75)-10 100
4th 70 75 (70-75)=-5 25
10th 70 75 (70-75)=-5 25
5th 80 75 (80-75)=5 25
6th 85 75 (85-75)=10 100
8th 85 75 (85-75)=10 100
7th 90 75 (90-75)=15 225
9th 90 75 (90-75)=15 225
Total Gross 750 0 1550
= √ [1550:10]
= 12.44 %

Linear Forecasting
Linear forecasting= (y = mx + c)
Value for m
Number of days= 10
Formulae of m =
∑ x ¿ 2
N ∑ x2−¿ N ∑ xy−∑x ∑ y
¿
Linear forecasting= (y = mx + c)
Value for m
Number of days= 10
Formulae of m =
∑ x ¿ 2
N ∑ x2−¿ N ∑ xy−∑x ∑ y
¿
⊘ This is a preview!⊘
Do you want full access?
Subscribe today to unlock all pages.

Trusted by 1+ million students worldwide

m = (10 x 4355 -55 x 750): (10 x 385 -55 x 55)
= 2300: 825
= 2.78
Linear forecasting is 2.78
Value of c =
The number of days = 10
The formula of c =
∑ y − m∑ x
N
c = [750 – 2.78x 55]: 10 = 747.22: 10 = 74.72.
Value of c is computed and it stands at 74.72.
Forecasting wind speed of 11th and 13th days
Values of m and c as per the linear forecasting
Linear forecasting formula = (y = 2.78 x + 74.72)
On the 11th day, the value of x is 11
Forecasting of wind speed of 11th day=
y = 2.78 x 11+ 74.72
y = 105.3 %
Paraphrase This Document
Need a fresh take? Get an instant paraphrase of this document with our AI Paraphraser

13th day, the value of x is 13
Forecasting of wind speed of 13th day=
y = 2.78 x 13+ 74.72
y = 110.86 %
CONCLUSION
From the above report it can be concluded that there are a lot of factors that possess a lot if
value for the company in the long run and thus all the aspects like mean, mode, and median and
its related aspects has to be calculated in an accurate manner and thus helping the firm in the
market.

REFERENCES
Books and journals
Books and journals
⊘ This is a preview!⊘
Do you want full access?
Subscribe today to unlock all pages.

Trusted by 1+ million students worldwide
1 out of 12
Related Documents
Your All-in-One AI-Powered Toolkit for Academic Success.
+13062052269
info@desklib.com
Available 24*7 on WhatsApp / Email
Unlock your academic potential
Copyright © 2020–2025 A2Z Services. All Rights Reserved. Developed and managed by ZUCOL.


