The Role and Possibilities of Wind Energy in Australia
VerifiedAdded on 2021/05/27
|26
|4616
|54
Report
AI Summary
This research report focuses on the role and possibilities of wind energy in various production sectors of Australia. The report highlights the increasing efficiency of wind energy in many areas of Australia, emphasizing its renewable, sustainable, and eco-friendly characteristics. It explores the use of wind turbines and machines as mediums for harnessing wind energy, crucial for combating global warming and environmental pollution. The study examines the influence of wind energy on the electric supply sector through primary and secondary research methods, including questionnaire-based data analysis. Despite the growing interest, the research reveals that the Australian government's investment in wind energy production has been limited. The analysis includes discussions on population selection, sample drawing, survey questionnaires, data description, and analysis, covering both categorical and numerical variables. The report concludes with an overview of wind energy's economic advantages and provides a detailed analysis of its current status and future potential in Australia.
Running head: THE ROLE AND POSSIBILITIES OF WIND ENERGY IN PRODUCTION
SECTORS
The Role and Possibilities of Wind Energy in Various Production Sectors
Name of Student
Name of University
Course ID
SECTORS
The Role and Possibilities of Wind Energy in Various Production Sectors
Name of Student
Name of University
Course ID
Paraphrase This Document
Need a fresh take? Get an instant paraphrase of this document with our AI Paraphraser
1THE ROLE AND POSSIBILITIES OF WIND ENERGY IN PRODUCTION SECTORS
Abstract:
The research report focuses on the research topic – “The role and possibilities of wind energy in
various production sector of Australia”. In many places of Australia, the role and possibilities of
wind energy in production sectors are getting highly efficient. Wind energy is never-ending,
renewable, sufficient and eco-friendly. The wind-mills, wind-blades and wind machines are the
mediums of wind energy. The enhancement of wind energy is very much essential these days as
natural calamities like global warming and environment pollution are increasing rapidly. For
clean environment and proper sustainability of the environment, renewable energy resources like
wind energy is essential. Governments of different countries are following the new trend of
transportation in different segments of Australian provinces. The increment of production of
wind energy directly or indirectly influencing mainly electric supply sector. Both the primary
and secondary research sources follow that assertion. However, it is also proved by primary data
analysis (executed by questionnaire process) that Australian government neither had taken
milestone steps nor the economical investment for wind energy production. The non-renewable
energy sources are decreasing day by day in this world. Sampled people are concerned about
wind energy sources decreasing the usage of enough amount of thermos-electricity received from
coal and petroleum. It is also found that people are not fully confirmed about the fact that in near
future, wind energy sources would absolutely replace the conventional energy sources reducing
the national gross and effective expense.
2THE ROLE AND POSSIBILITIES OF WIND ENERGY IN PRODUCTION SECTORS
Table of Contents
Introduction:....................................................................................................................................3
Discussion about wind energy in Australia:....................................................................................3
Population Selection and Sample Drawing:....................................................................................4
Survey Questionnaire:.....................................................................................................................5
Data Description and Parameters:...................................................................................................5
Sampling Errors:..............................................................................................................................7
Data Validity and Reliability:..........................................................................................................8
Data Analysis:..................................................................................................................................8
Secondary Analysis:....................................................................................................................8
Primary Analysis:........................................................................................................................9
Categorical Variables:.............................................................................................................9
Numerical Variables:.............................................................................................................21
Conclusion:....................................................................................................................................24
References:....................................................................................................................................25
⊘ This is a preview!⊘
Do you want full access?
Subscribe today to unlock all pages.
Trusted by 1+ million students worldwide
3THE ROLE AND POSSIBILITIES OF WIND ENERGY IN PRODUCTION SECTORS
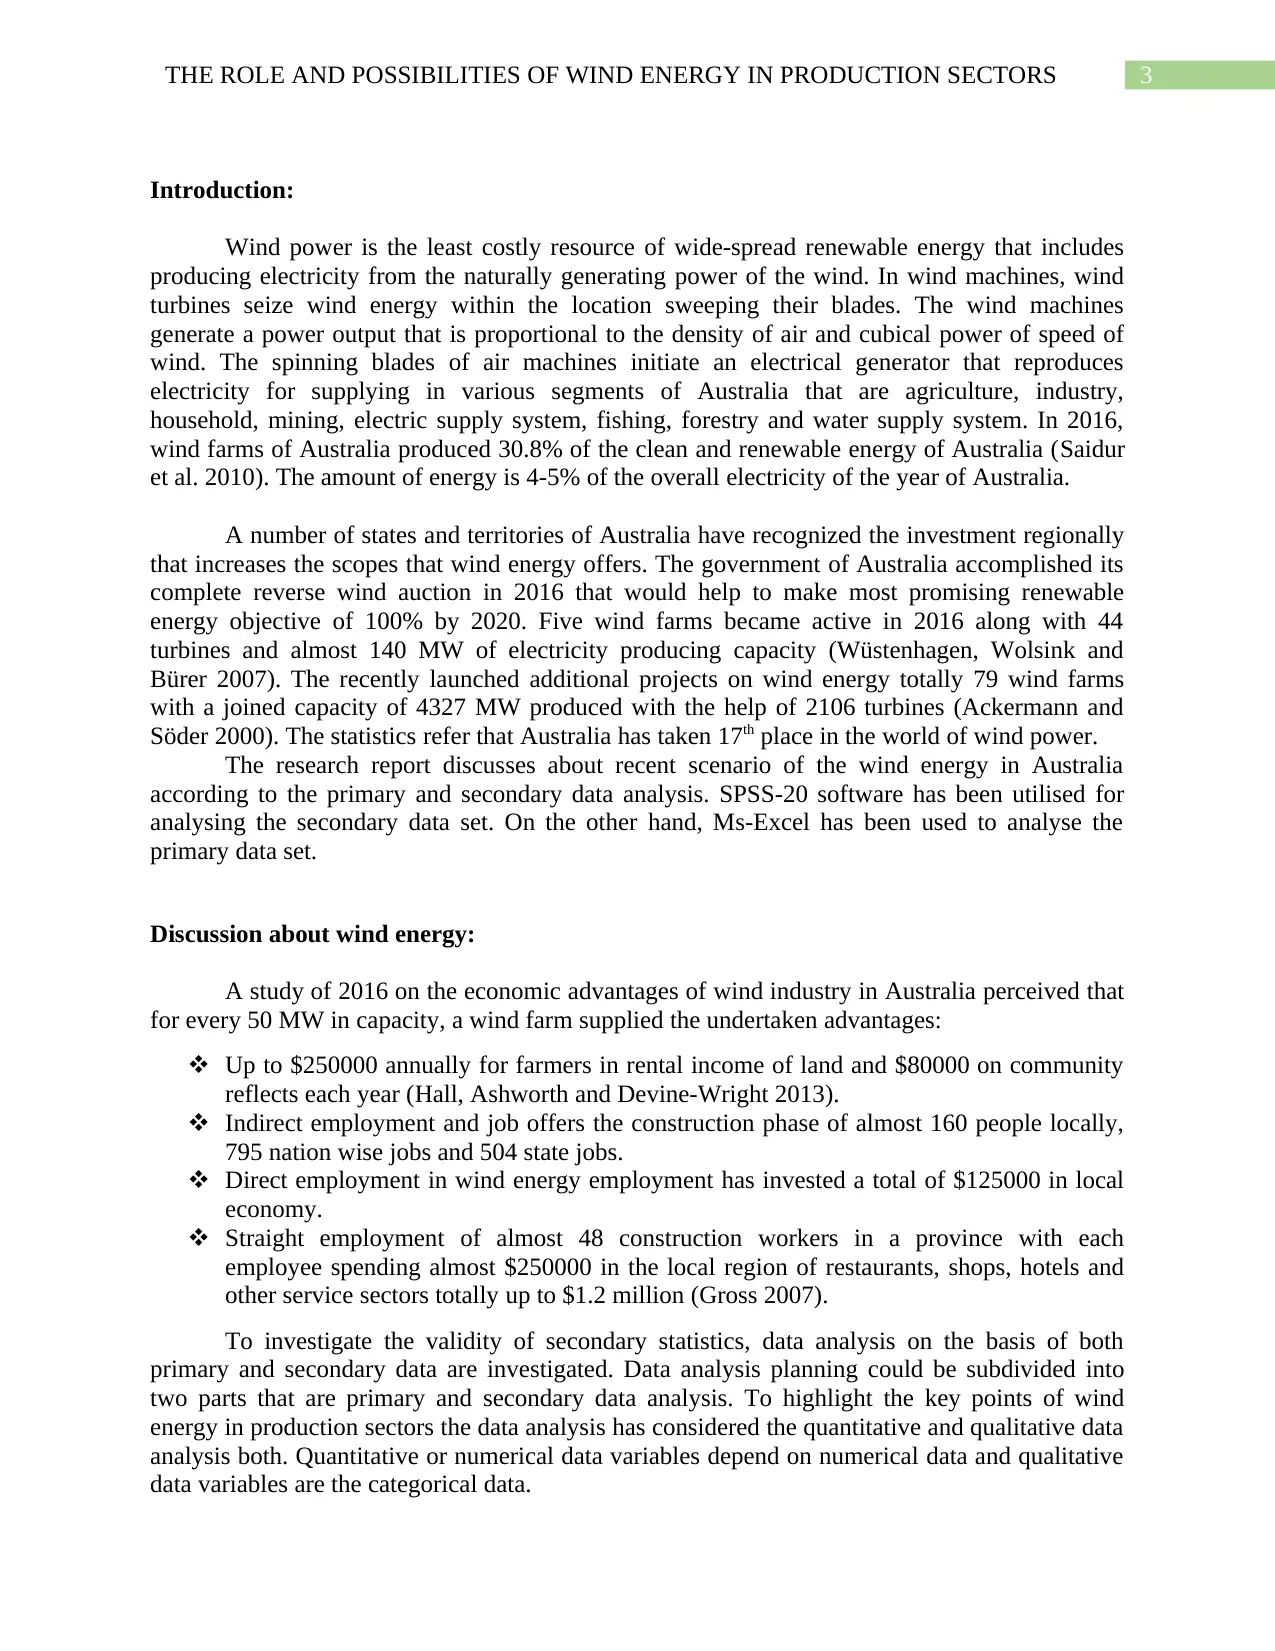
Introduction:
Wind power is the least costly resource of wide-spread renewable energy that includes
producing electricity from the naturally generating power of the wind. In wind machines, wind
turbines seize wind energy within the location sweeping their blades. The wind machines
generate a power output that is proportional to the density of air and cubical power of speed of
wind. The spinning blades of air machines initiate an electrical generator that reproduces
electricity for supplying in various segments of Australia that are agriculture, industry,
household, mining, electric supply system, fishing, forestry and water supply system. In 2016,
wind farms of Australia produced 30.8% of the clean and renewable energy of Australia (Saidur
et al. 2010). The amount of energy is 4-5% of the overall electricity of the year of Australia.
A number of states and territories of Australia have recognized the investment regionally
that increases the scopes that wind energy offers. The government of Australia accomplished its
complete reverse wind auction in 2016 that would help to make most promising renewable
energy objective of 100% by 2020. Five wind farms became active in 2016 along with 44
turbines and almost 140 MW of electricity producing capacity (Wüstenhagen, Wolsink and
Bürer 2007). The recently launched additional projects on wind energy totally 79 wind farms
with a joined capacity of 4327 MW produced with the help of 2106 turbines (Ackermann and
Söder 2000). The statistics refer that Australia has taken 17th place in the world of wind power.
The research report discusses about recent scenario of the wind energy in Australia
according to the primary and secondary data analysis. SPSS-20 software has been utilised for
analysing the secondary data set. On the other hand, Ms-Excel has been used to analyse the
primary data set.
Discussion about wind energy:
A study of 2016 on the economic advantages of wind industry in Australia perceived that
for every 50 MW in capacity, a wind farm supplied the undertaken advantages:
Up to $250000 annually for farmers in rental income of land and $80000 on community
reflects each year (Hall, Ashworth and Devine-Wright 2013).
Indirect employment and job offers the construction phase of almost 160 people locally,
795 nation wise jobs and 504 state jobs.
Direct employment in wind energy employment has invested a total of $125000 in local
economy.
Straight employment of almost 48 construction workers in a province with each
employee spending almost $250000 in the local region of restaurants, shops, hotels and
other service sectors totally up to $1.2 million (Gross 2007).
To investigate the validity of secondary statistics, data analysis on the basis of both
primary and secondary data are investigated. Data analysis planning could be subdivided into
two parts that are primary and secondary data analysis. To highlight the key points of wind
energy in production sectors the data analysis has considered the quantitative and qualitative data
analysis both. Quantitative or numerical data variables depend on numerical data and qualitative
data variables are the categorical data.
Paraphrase This Document
Need a fresh take? Get an instant paraphrase of this document with our AI Paraphraser
4THE ROLE AND POSSIBILITIES OF WIND ENERGY IN PRODUCTION SECTORS
In this research, the researcher used the primary data gathered from target population. In
survey method with the help of questionnaire, the responses are collected from the target
population. Primary data collection technique is not costly but greater time taking. The
questionnaire consists close-ended questions only. The researcher also used the secondary data
analysis gathered from target population. The data about wind energy is collected from
“Aus.gov” website. The data source is authentic; however, the researcher is unable to produce
full assurance of the secondary data set.
Population Selection and Sample Drawing:
Most of the Australians expect the prosperity of wind power. It is therefore very much
vital for wind farm organizations for engaging in stable loyalty and satisfaction with people
dwelling in the neighbourhood of wind energy projects. The aiming population signifies defined
segment within larger population that are placed to serve as a primary data resource for the
research purpose. The population selected for data analysis is the sample of randomly chosen 50
samples. With the help of questionnaire method, 35 samples were selected for analysis as the
data should be free from missing values. The population is hance the community of Australia and
the sample has the individuals of each community. The samples are primary data in nature. The
data is created with the help of sample-drawing process. The assigned data is the representative
of sampling scheme for determining the number of physical samples according to the sampling
scheme (Tongco 2007).
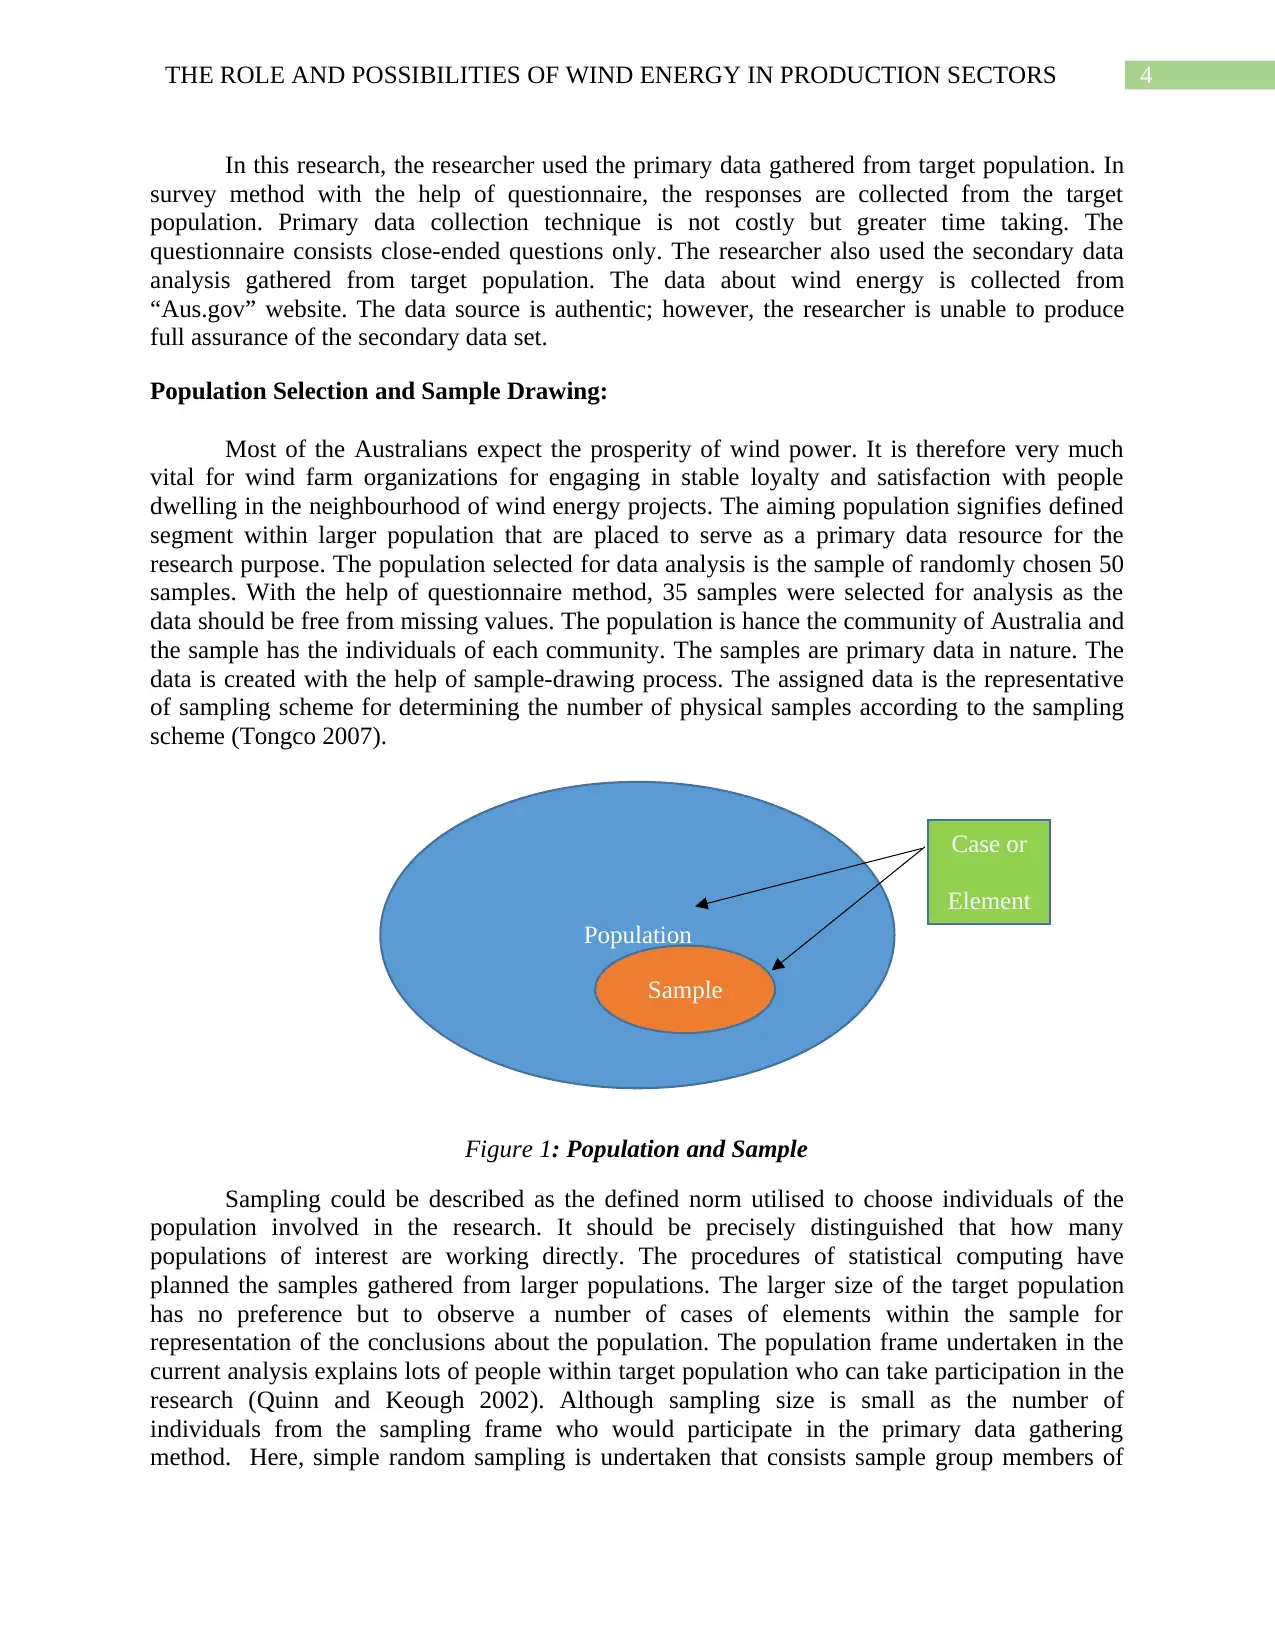
Figure 1: Population and Sample
Sampling could be described as the defined norm utilised to choose individuals of the
population involved in the research. It should be precisely distinguished that how many
populations of interest are working directly. The procedures of statistical computing have
planned the samples gathered from larger populations. The larger size of the target population
has no preference but to observe a number of cases of elements within the sample for
representation of the conclusions about the population. The population frame undertaken in the
current analysis explains lots of people within target population who can take participation in the
research (Quinn and Keough 2002). Although sampling size is small as the number of
individuals from the sampling frame who would participate in the primary data gathering
method. Here, simple random sampling is undertaken that consists sample group members of
Population
Sample
Case or
Element
In this research, the researcher used the primary data gathered from target population. In
survey method with the help of questionnaire, the responses are collected from the target
population. Primary data collection technique is not costly but greater time taking. The
questionnaire consists close-ended questions only. The researcher also used the secondary data
analysis gathered from target population. The data about wind energy is collected from
“Aus.gov” website. The data source is authentic; however, the researcher is unable to produce
full assurance of the secondary data set.
Population Selection and Sample Drawing:
Most of the Australians expect the prosperity of wind power. It is therefore very much
vital for wind farm organizations for engaging in stable loyalty and satisfaction with people
dwelling in the neighbourhood of wind energy projects. The aiming population signifies defined
segment within larger population that are placed to serve as a primary data resource for the
research purpose. The population selected for data analysis is the sample of randomly chosen 50
samples. With the help of questionnaire method, 35 samples were selected for analysis as the
data should be free from missing values. The population is hance the community of Australia and
the sample has the individuals of each community. The samples are primary data in nature. The
data is created with the help of sample-drawing process. The assigned data is the representative
of sampling scheme for determining the number of physical samples according to the sampling
scheme (Tongco 2007).
Figure 1: Population and Sample
Sampling could be described as the defined norm utilised to choose individuals of the
population involved in the research. It should be precisely distinguished that how many
populations of interest are working directly. The procedures of statistical computing have
planned the samples gathered from larger populations. The larger size of the target population
has no preference but to observe a number of cases of elements within the sample for
representation of the conclusions about the population. The population frame undertaken in the
current analysis explains lots of people within target population who can take participation in the
research (Quinn and Keough 2002). Although sampling size is small as the number of
individuals from the sampling frame who would participate in the primary data gathering
method. Here, simple random sampling is undertaken that consists sample group members of
Population
Sample
Case or
Element
5THE ROLE AND POSSIBILITIES OF WIND ENERGY IN PRODUCTION SECTORS
random variables. The advantage of it is very effective if all aspects take part in the data
collection. However, sampling error at high level is present in this case.
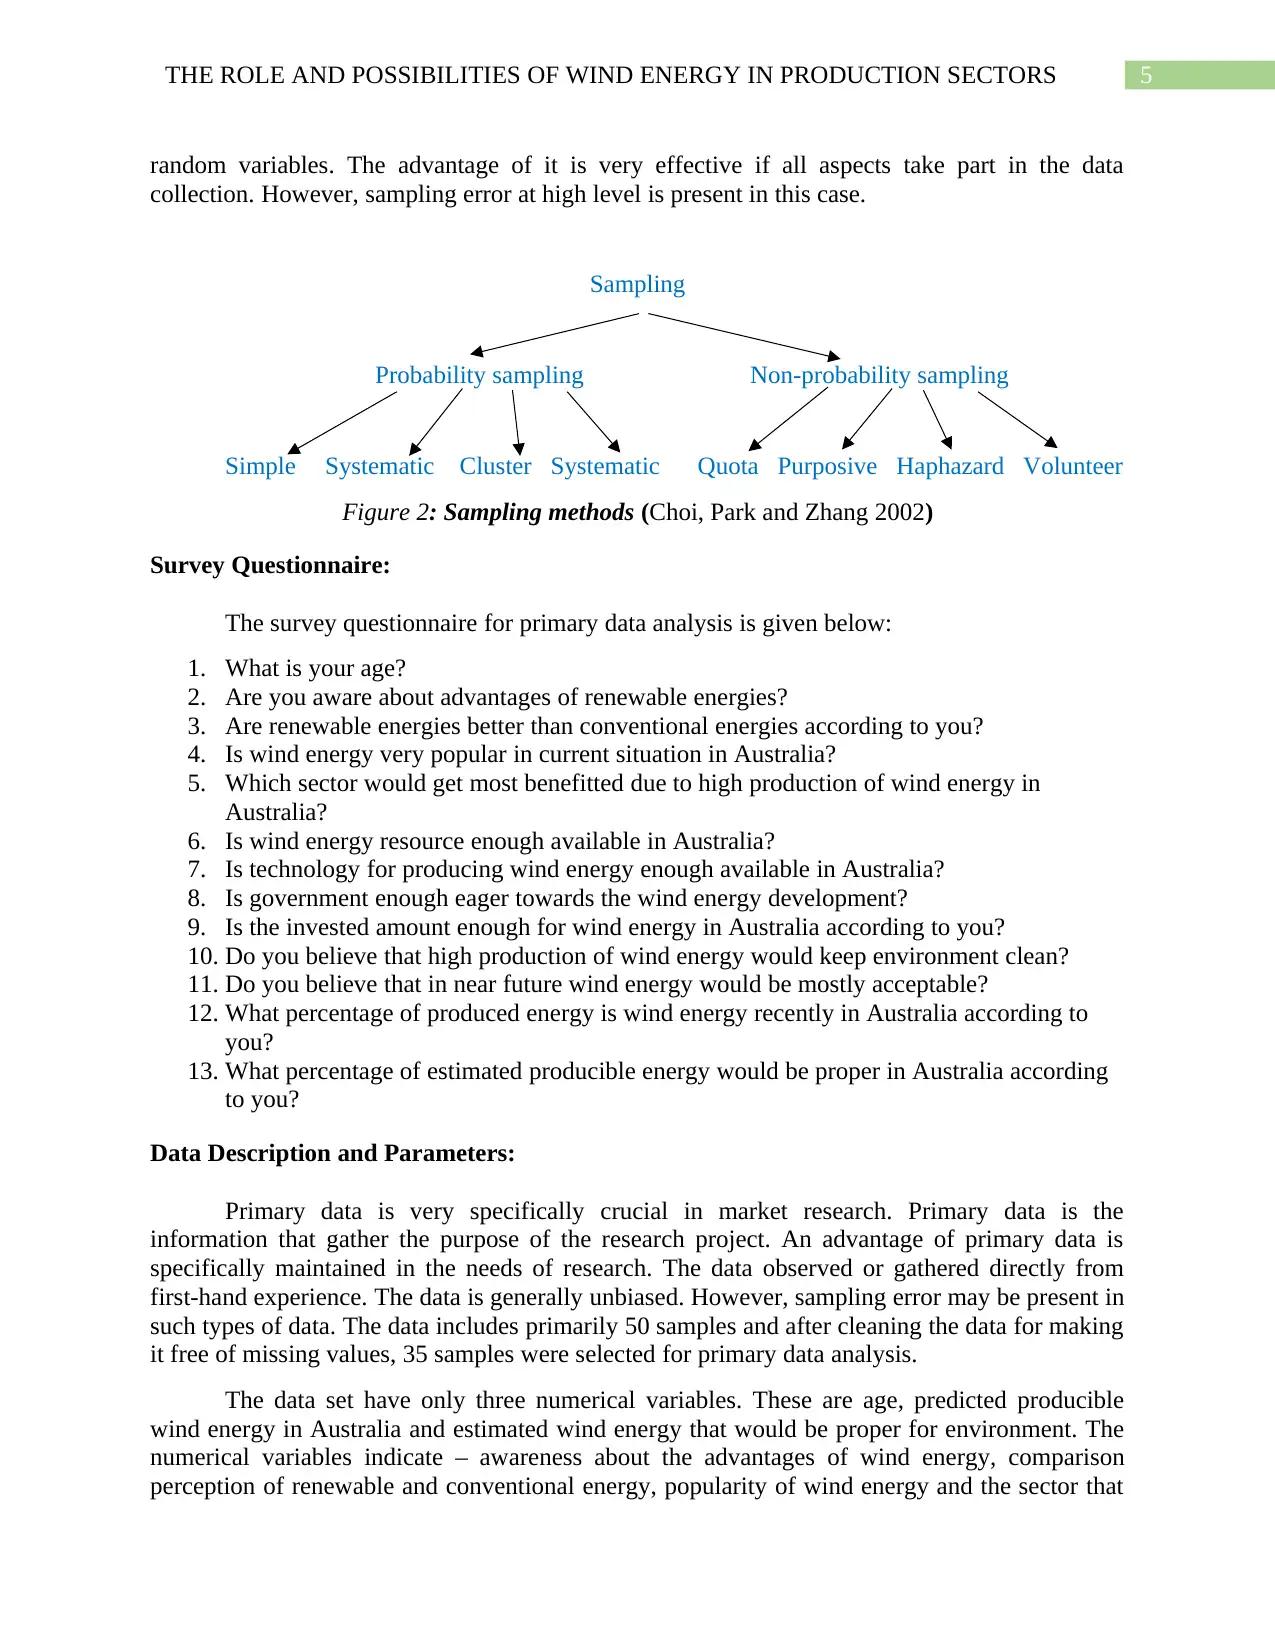
Sampling
Probability sampling Non-probability sampling
Simple Systematic Cluster Systematic Quota Purposive Haphazard Volunteer
Figure 2: Sampling methods (Choi, Park and Zhang 2002)
Survey Questionnaire:
The survey questionnaire for primary data analysis is given below:
1. What is your age?
2. Are you aware about advantages of renewable energies?
3. Are renewable energies better than conventional energies according to you?
4. Is wind energy very popular in current situation in Australia?
5. Which sector would get most benefitted due to high production of wind energy in
Australia?
6. Is wind energy resource enough available in Australia?
7. Is technology for producing wind energy enough available in Australia?
8. Is government enough eager towards the wind energy development?
9. Is the invested amount enough for wind energy in Australia according to you?
10. Do you believe that high production of wind energy would keep environment clean?
11. Do you believe that in near future wind energy would be mostly acceptable?
12. What percentage of produced energy is wind energy recently in Australia according to
you?
13. What percentage of estimated producible energy would be proper in Australia according
to you?
Data Description and Parameters:
Primary data is very specifically crucial in market research. Primary data is the
information that gather the purpose of the research project. An advantage of primary data is
specifically maintained in the needs of research. The data observed or gathered directly from
first-hand experience. The data is generally unbiased. However, sampling error may be present in
such types of data. The data includes primarily 50 samples and after cleaning the data for making
it free of missing values, 35 samples were selected for primary data analysis.
The data set have only three numerical variables. These are age, predicted producible
wind energy in Australia and estimated wind energy that would be proper for environment. The
numerical variables indicate – awareness about the advantages of wind energy, comparison
perception of renewable and conventional energy, popularity of wind energy and the sector that
random variables. The advantage of it is very effective if all aspects take part in the data
collection. However, sampling error at high level is present in this case.
Sampling
Probability sampling Non-probability sampling
Simple Systematic Cluster Systematic Quota Purposive Haphazard Volunteer
Figure 2: Sampling methods (Choi, Park and Zhang 2002)
Survey Questionnaire:
The survey questionnaire for primary data analysis is given below:
1. What is your age?
2. Are you aware about advantages of renewable energies?
3. Are renewable energies better than conventional energies according to you?
4. Is wind energy very popular in current situation in Australia?
5. Which sector would get most benefitted due to high production of wind energy in
Australia?
6. Is wind energy resource enough available in Australia?
7. Is technology for producing wind energy enough available in Australia?
8. Is government enough eager towards the wind energy development?
9. Is the invested amount enough for wind energy in Australia according to you?
10. Do you believe that high production of wind energy would keep environment clean?
11. Do you believe that in near future wind energy would be mostly acceptable?
12. What percentage of produced energy is wind energy recently in Australia according to
you?
13. What percentage of estimated producible energy would be proper in Australia according
to you?
Data Description and Parameters:
Primary data is very specifically crucial in market research. Primary data is the
information that gather the purpose of the research project. An advantage of primary data is
specifically maintained in the needs of research. The data observed or gathered directly from
first-hand experience. The data is generally unbiased. However, sampling error may be present in
such types of data. The data includes primarily 50 samples and after cleaning the data for making
it free of missing values, 35 samples were selected for primary data analysis.
The data set have only three numerical variables. These are age, predicted producible
wind energy in Australia and estimated wind energy that would be proper for environment. The
numerical variables indicate – awareness about the advantages of wind energy, comparison
perception of renewable and conventional energy, popularity of wind energy and the sector that
⊘ This is a preview!⊘
Do you want full access?
Subscribe today to unlock all pages.
Trusted by 1+ million students worldwide
6THE ROLE AND POSSIBILITIES OF WIND ENERGY IN PRODUCTION SECTORS
would be most beneficial from high production of wind energy. Besides, several facts such as
validity of enough energy resource in Australia, technology of producing energy in Australia,
eagerness of government towards the upliftment of wind energy production, sufficiency of wind
energy, cleanliness of renewable energies such as wind energy and consideration of people about
the popularity of wind energy in near future.
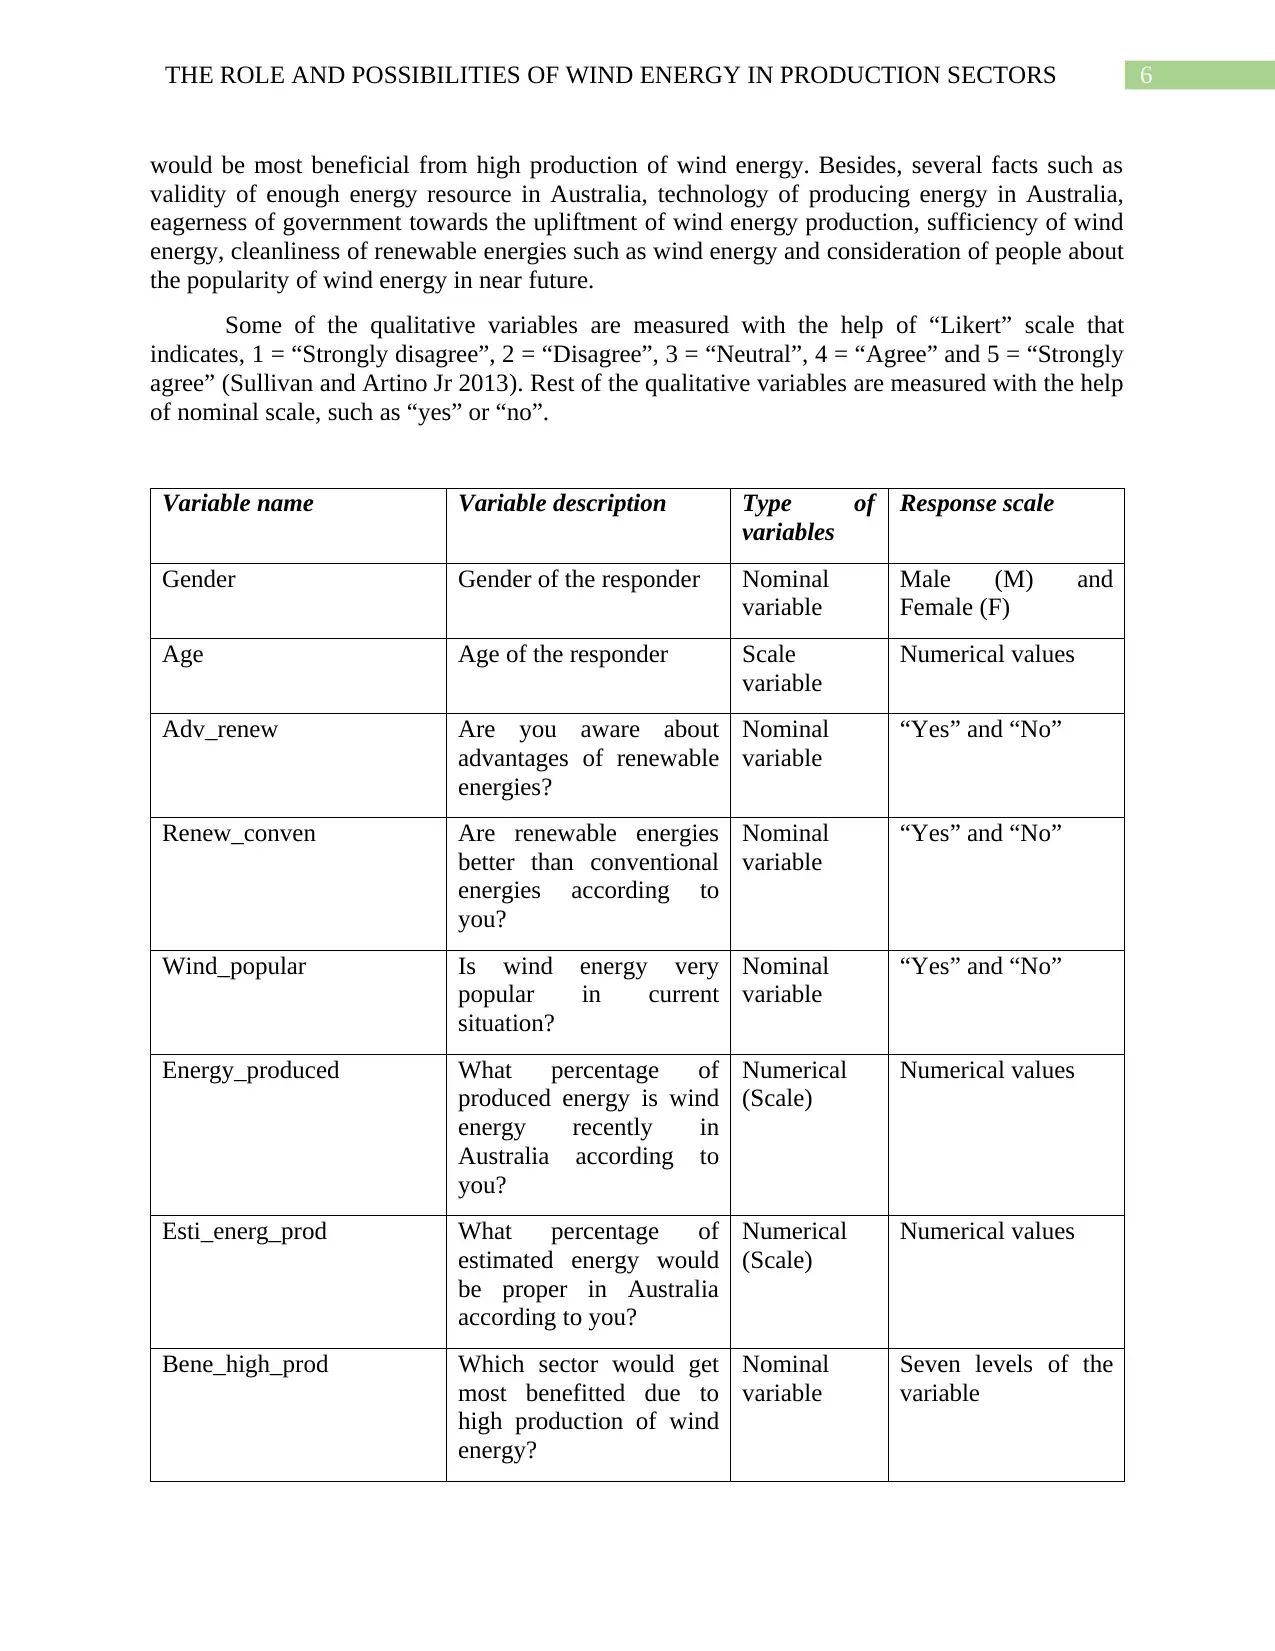
Some of the qualitative variables are measured with the help of “Likert” scale that
indicates, 1 = “Strongly disagree”, 2 = “Disagree”, 3 = “Neutral”, 4 = “Agree” and 5 = “Strongly
agree” (Sullivan and Artino Jr 2013). Rest of the qualitative variables are measured with the help
of nominal scale, such as “yes” or “no”.
Variable name Variable description Type of
variables
Response scale
Gender Gender of the responder Nominal
variable
Male (M) and
Female (F)
Age Age of the responder Scale
variable
Numerical values
Adv_renew Are you aware about
advantages of renewable
energies?
Nominal
variable
“Yes” and “No”
Renew_conven Are renewable energies
better than conventional
energies according to
you?
Nominal
variable
“Yes” and “No”
Wind_popular Is wind energy very
popular in current
situation?
Nominal
variable
“Yes” and “No”
Energy_produced What percentage of
produced energy is wind
energy recently in
Australia according to
you?
Numerical
(Scale)
Numerical values
Esti_energ_prod What percentage of
estimated energy would
be proper in Australia
according to you?
Numerical
(Scale)
Numerical values
Bene_high_prod Which sector would get
most benefitted due to
high production of wind
energy?
Nominal
variable
Seven levels of the
variable
would be most beneficial from high production of wind energy. Besides, several facts such as
validity of enough energy resource in Australia, technology of producing energy in Australia,
eagerness of government towards the upliftment of wind energy production, sufficiency of wind
energy, cleanliness of renewable energies such as wind energy and consideration of people about
the popularity of wind energy in near future.
Some of the qualitative variables are measured with the help of “Likert” scale that
indicates, 1 = “Strongly disagree”, 2 = “Disagree”, 3 = “Neutral”, 4 = “Agree” and 5 = “Strongly
agree” (Sullivan and Artino Jr 2013). Rest of the qualitative variables are measured with the help
of nominal scale, such as “yes” or “no”.
Variable name Variable description Type of
variables
Response scale
Gender Gender of the responder Nominal
variable
Male (M) and
Female (F)
Age Age of the responder Scale
variable
Numerical values
Adv_renew Are you aware about
advantages of renewable
energies?
Nominal
variable
“Yes” and “No”
Renew_conven Are renewable energies
better than conventional
energies according to
you?
Nominal
variable
“Yes” and “No”
Wind_popular Is wind energy very
popular in current
situation?
Nominal
variable
“Yes” and “No”
Energy_produced What percentage of
produced energy is wind
energy recently in
Australia according to
you?
Numerical
(Scale)
Numerical values
Esti_energ_prod What percentage of
estimated energy would
be proper in Australia
according to you?
Numerical
(Scale)
Numerical values
Bene_high_prod Which sector would get
most benefitted due to
high production of wind
energy?
Nominal
variable
Seven levels of the
variable
Paraphrase This Document
Need a fresh take? Get an instant paraphrase of this document with our AI Paraphraser
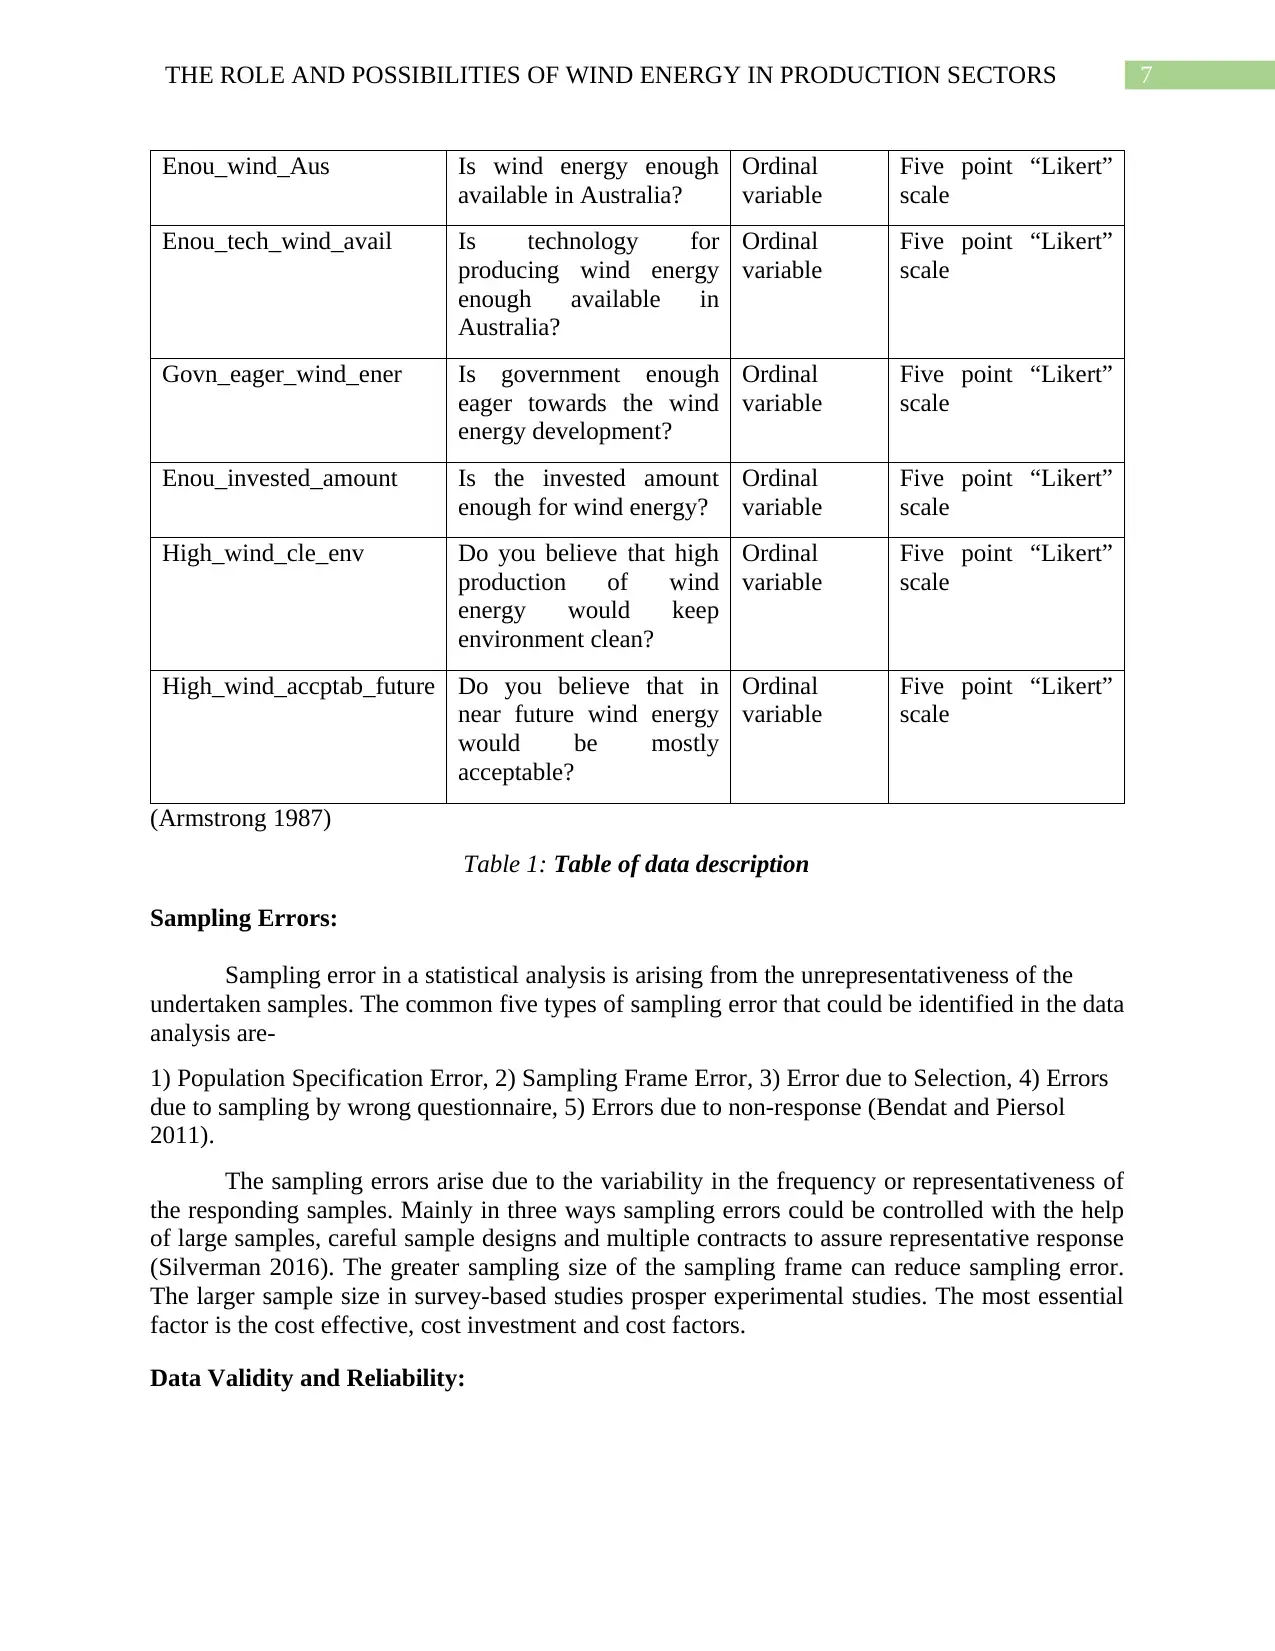
7THE ROLE AND POSSIBILITIES OF WIND ENERGY IN PRODUCTION SECTORS
Enou_wind_Aus Is wind energy enough
available in Australia?
Ordinal
variable
Five point “Likert”
scale
Enou_tech_wind_avail Is technology for
producing wind energy
enough available in
Australia?
Ordinal
variable
Five point “Likert”
scale
Govn_eager_wind_ener Is government enough
eager towards the wind
energy development?
Ordinal
variable
Five point “Likert”
scale
Enou_invested_amount Is the invested amount
enough for wind energy?
Ordinal
variable
Five point “Likert”
scale
High_wind_cle_env Do you believe that high
production of wind
energy would keep
environment clean?
Ordinal
variable
Five point “Likert”
scale
High_wind_accptab_future Do you believe that in
near future wind energy
would be mostly
acceptable?
Ordinal
variable
Five point “Likert”
scale
(Armstrong 1987)
Table 1: Table of data description
Sampling Errors:
Sampling error in a statistical analysis is arising from the unrepresentativeness of the
undertaken samples. The common five types of sampling error that could be identified in the data
analysis are-
1) Population Specification Error, 2) Sampling Frame Error, 3) Error due to Selection, 4) Errors
due to sampling by wrong questionnaire, 5) Errors due to non-response (Bendat and Piersol
2011).
The sampling errors arise due to the variability in the frequency or representativeness of
the responding samples. Mainly in three ways sampling errors could be controlled with the help
of large samples, careful sample designs and multiple contracts to assure representative response
(Silverman 2016). The greater sampling size of the sampling frame can reduce sampling error.
The larger sample size in survey-based studies prosper experimental studies. The most essential
factor is the cost effective, cost investment and cost factors.
Data Validity and Reliability:
8THE ROLE AND POSSIBILITIES OF WIND ENERGY IN PRODUCTION SECTORS
The two terms data validity and reliability are often used interchangeably when these are
not related to the research statistics. Critics of statistics use the terms that indicate the various
properties of experimental or statistical process (Noble and Smith 2015). Reliability is the
measure of consistency that takes the equal personality test claimed. The validity is the measure
of authenticity of data used for analysis. Reliability and validity are independent of each other. It
is notable fact that a measurement may be valid but not reliable.
The concept behind reliability of any significant outcomes must be more than findings of
inherently repetition. The data set has replicability and universal approach (Drost 2011). The
statistical tools perform time critical experiment. The data set is neither manipulated nor
transformed deliberately for the purpose of data analysis. The social experiment concerns about
reliability and robustness of the data set.
Data Analysis:
Descriptive data analysis are short descriptive coefficients that condense the given data
set that can either be a representation of the whole population or a sample of the population.
Quantitative or numerical variables are summarized by descriptive or summary statistics process.
Categorical or qualitative variables are summarized by frequency tables and respective diagrams.
The descriptive analysis as well as correlation analysis are executed here.
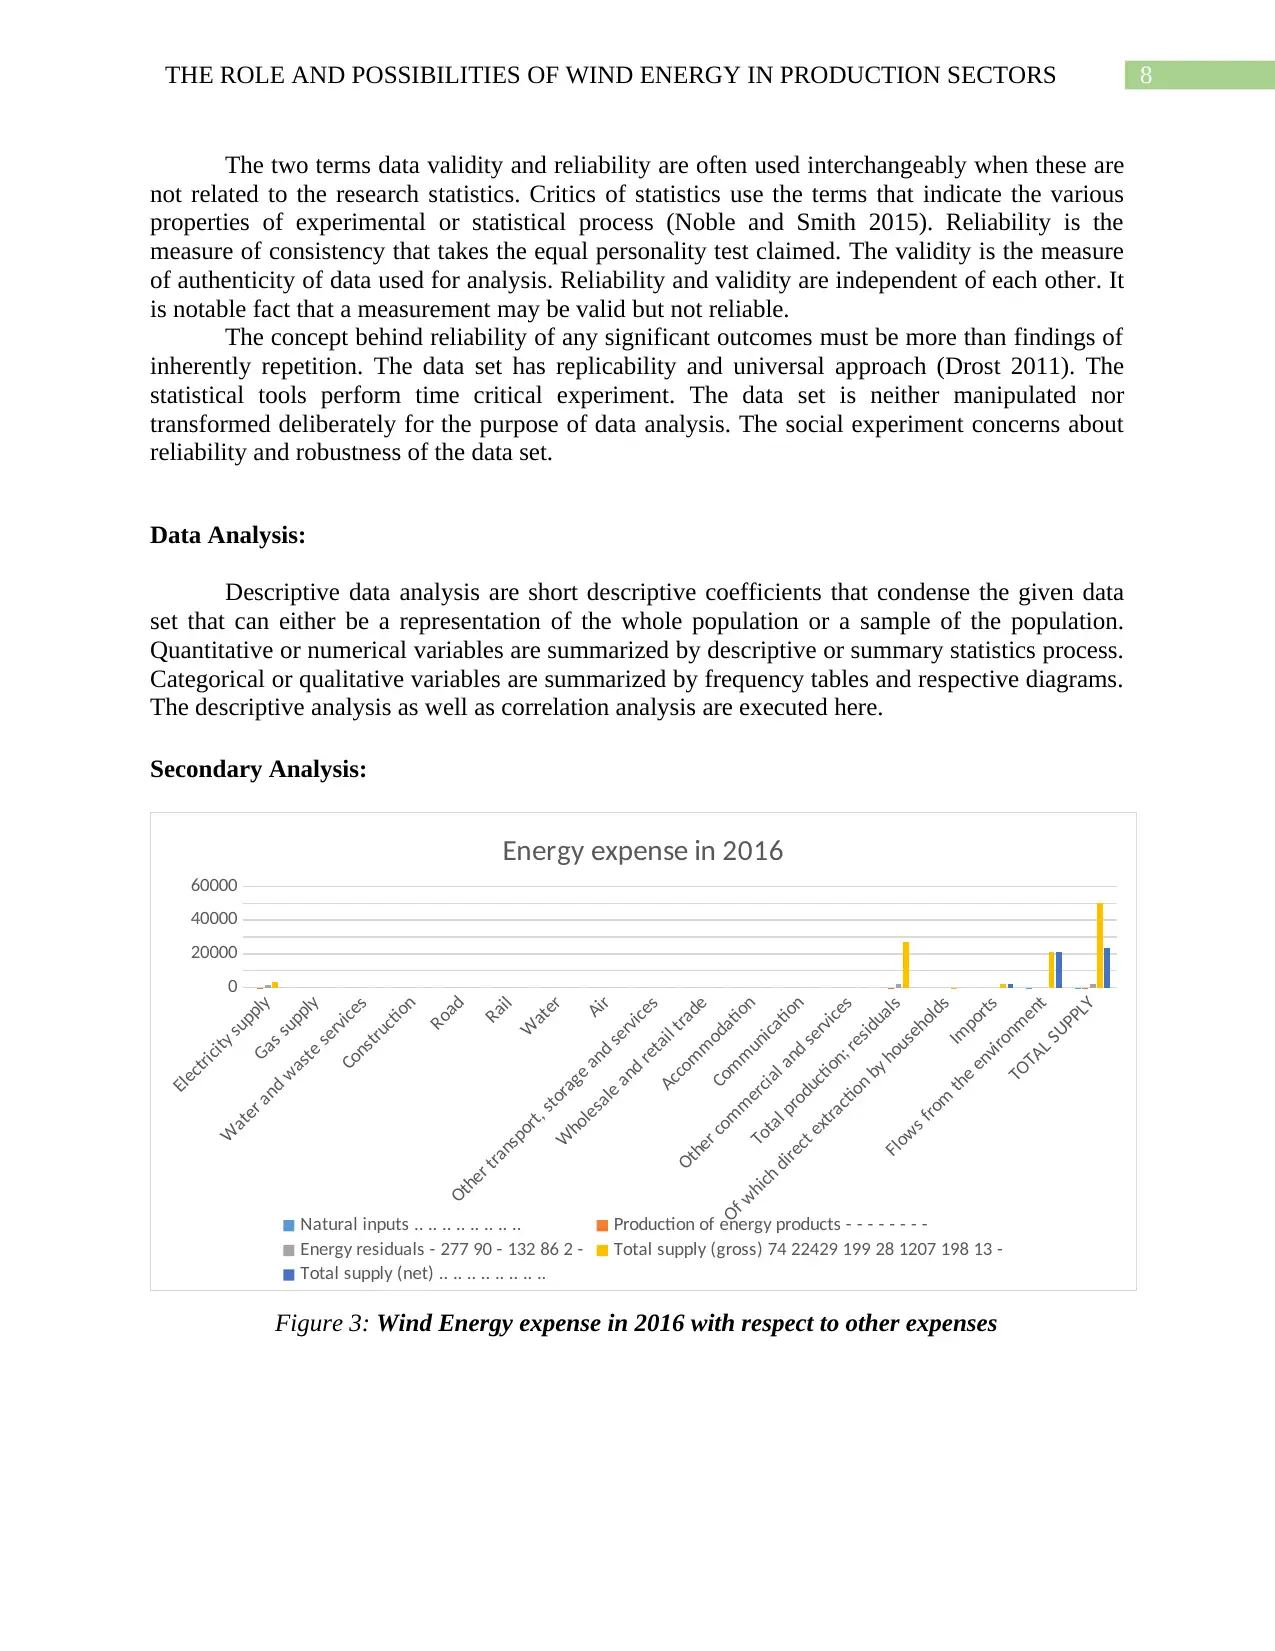
Secondary Analysis:
Electricity supply
Gas supply
Water and waste services
Construction
Road
Rail
Water
Air
Other transport, storage and services
Wholesale and retail trade
Accommodation
Communication
Other commercial and services
Total production; residuals
Of which direct extraction by households
Imports
Flows from the environment
TOTAL SUPPLY
0
20000
40000
60000
Energy expense in 2016
Natural inputs .. .. .. .. .. .. .. .. Production of energy products - - - - - - - -
Energy residuals - 277 90 - 132 86 2 - Total supply (gross) 74 22429 199 28 1207 198 13 -
Total supply (net) .. .. .. .. .. .. .. ..
Figure 3: Wind Energy expense in 2016 with respect to other expenses
The two terms data validity and reliability are often used interchangeably when these are
not related to the research statistics. Critics of statistics use the terms that indicate the various
properties of experimental or statistical process (Noble and Smith 2015). Reliability is the
measure of consistency that takes the equal personality test claimed. The validity is the measure
of authenticity of data used for analysis. Reliability and validity are independent of each other. It
is notable fact that a measurement may be valid but not reliable.
The concept behind reliability of any significant outcomes must be more than findings of
inherently repetition. The data set has replicability and universal approach (Drost 2011). The
statistical tools perform time critical experiment. The data set is neither manipulated nor
transformed deliberately for the purpose of data analysis. The social experiment concerns about
reliability and robustness of the data set.
Data Analysis:
Descriptive data analysis are short descriptive coefficients that condense the given data
set that can either be a representation of the whole population or a sample of the population.
Quantitative or numerical variables are summarized by descriptive or summary statistics process.
Categorical or qualitative variables are summarized by frequency tables and respective diagrams.
The descriptive analysis as well as correlation analysis are executed here.
Secondary Analysis:
Electricity supply
Gas supply
Water and waste services
Construction
Road
Rail
Water
Air
Other transport, storage and services
Wholesale and retail trade
Accommodation
Communication
Other commercial and services
Total production; residuals
Of which direct extraction by households
Imports
Flows from the environment
TOTAL SUPPLY
0
20000
40000
60000
Energy expense in 2016
Natural inputs .. .. .. .. .. .. .. .. Production of energy products - - - - - - - -
Energy residuals - 277 90 - 132 86 2 - Total supply (gross) 74 22429 199 28 1207 198 13 -
Total supply (net) .. .. .. .. .. .. .. ..
Figure 3: Wind Energy expense in 2016 with respect to other expenses
⊘ This is a preview!⊘
Do you want full access?
Subscribe today to unlock all pages.
Trusted by 1+ million students worldwide
9THE ROLE AND POSSIBILITIES OF WIND ENERGY IN PRODUCTION SECTORS
The wind energy expense in 2016 with respect to other expenses displays that expense of wind
energy is significantly smaller than total supply. The amount of supply of wind energy in 2016
with respect to other expenses displays that expense of wind energy is significantly very
insignificant than total supply amount. The produced wind energy is highlighted in electricity
supply.
Agriculture, forestry and fishing
Mining
Food, beverages, textiles
Wood, paper, printing
Petroleum and chemical products
Iron and steel
Non-ferrous metals
Other manufacturing
Electricity supply
Gas supply
Water and waste services
Construction
Road
Rail
Water
Air
Other transport, storage and services
Wholesale and retail trade
Accommodation
Communication
Other commercial and services
Total use by industry
Consumption by households
Consumption by government
Changes in inventories
Exports
Flows to the environment
Total use
0
10
20
30
40
50
Expense of wind energy in 2016
Energy from natural inputs Transformation of energy products End use of energy products
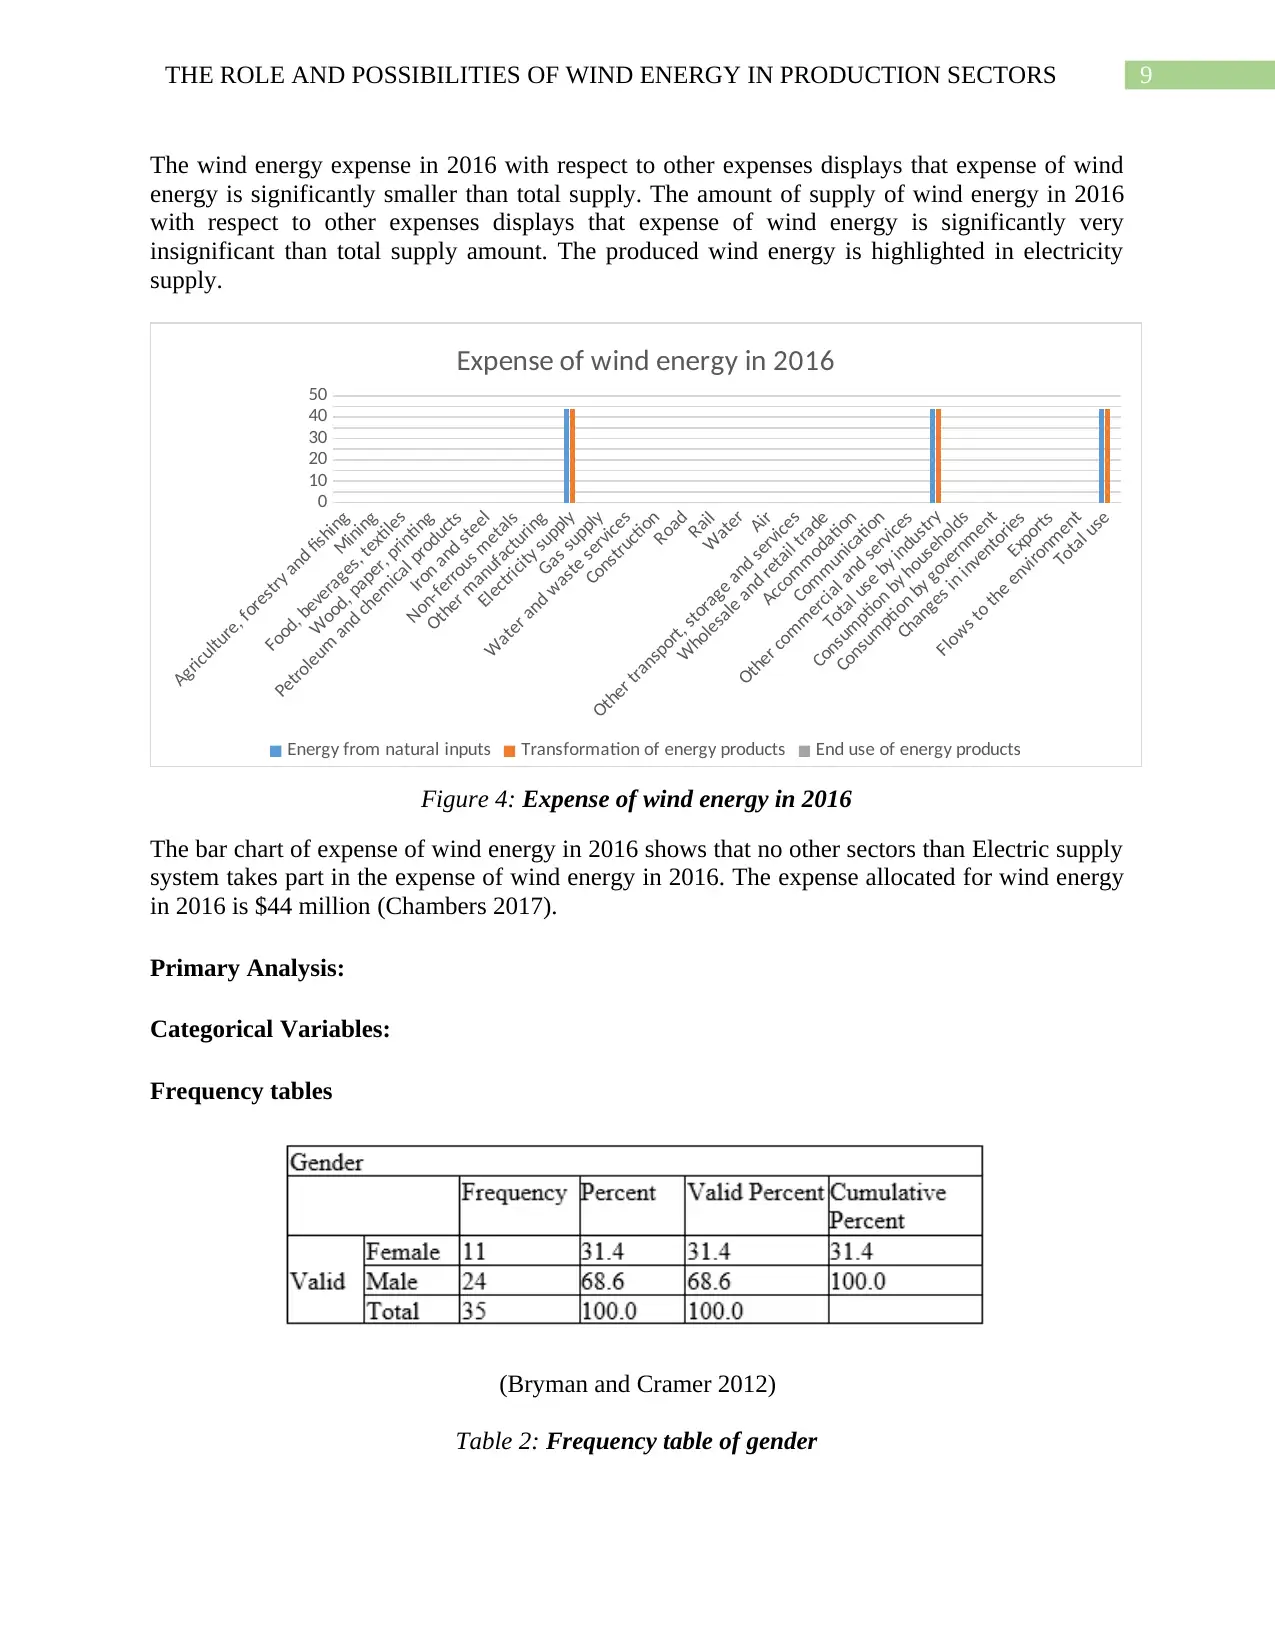
Figure 4: Expense of wind energy in 2016
The bar chart of expense of wind energy in 2016 shows that no other sectors than Electric supply
system takes part in the expense of wind energy in 2016. The expense allocated for wind energy
in 2016 is $44 million (Chambers 2017).
Primary Analysis:
Categorical Variables:
Frequency tables
(Bryman and Cramer 2012)
Table 2: Frequency table of gender
The wind energy expense in 2016 with respect to other expenses displays that expense of wind
energy is significantly smaller than total supply. The amount of supply of wind energy in 2016
with respect to other expenses displays that expense of wind energy is significantly very
insignificant than total supply amount. The produced wind energy is highlighted in electricity
supply.
Agriculture, forestry and fishing
Mining
Food, beverages, textiles
Wood, paper, printing
Petroleum and chemical products
Iron and steel
Non-ferrous metals
Other manufacturing
Electricity supply
Gas supply
Water and waste services
Construction
Road
Rail
Water
Air
Other transport, storage and services
Wholesale and retail trade
Accommodation
Communication
Other commercial and services
Total use by industry
Consumption by households
Consumption by government
Changes in inventories
Exports
Flows to the environment
Total use
0
10
20
30
40
50
Expense of wind energy in 2016
Energy from natural inputs Transformation of energy products End use of energy products
Figure 4: Expense of wind energy in 2016
The bar chart of expense of wind energy in 2016 shows that no other sectors than Electric supply
system takes part in the expense of wind energy in 2016. The expense allocated for wind energy
in 2016 is $44 million (Chambers 2017).
Primary Analysis:
Categorical Variables:
Frequency tables
(Bryman and Cramer 2012)
Table 2: Frequency table of gender
Paraphrase This Document
Need a fresh take? Get an instant paraphrase of this document with our AI Paraphraser
10THE ROLE AND POSSIBILITIES OF WIND ENERGY IN PRODUCTION SECTORS
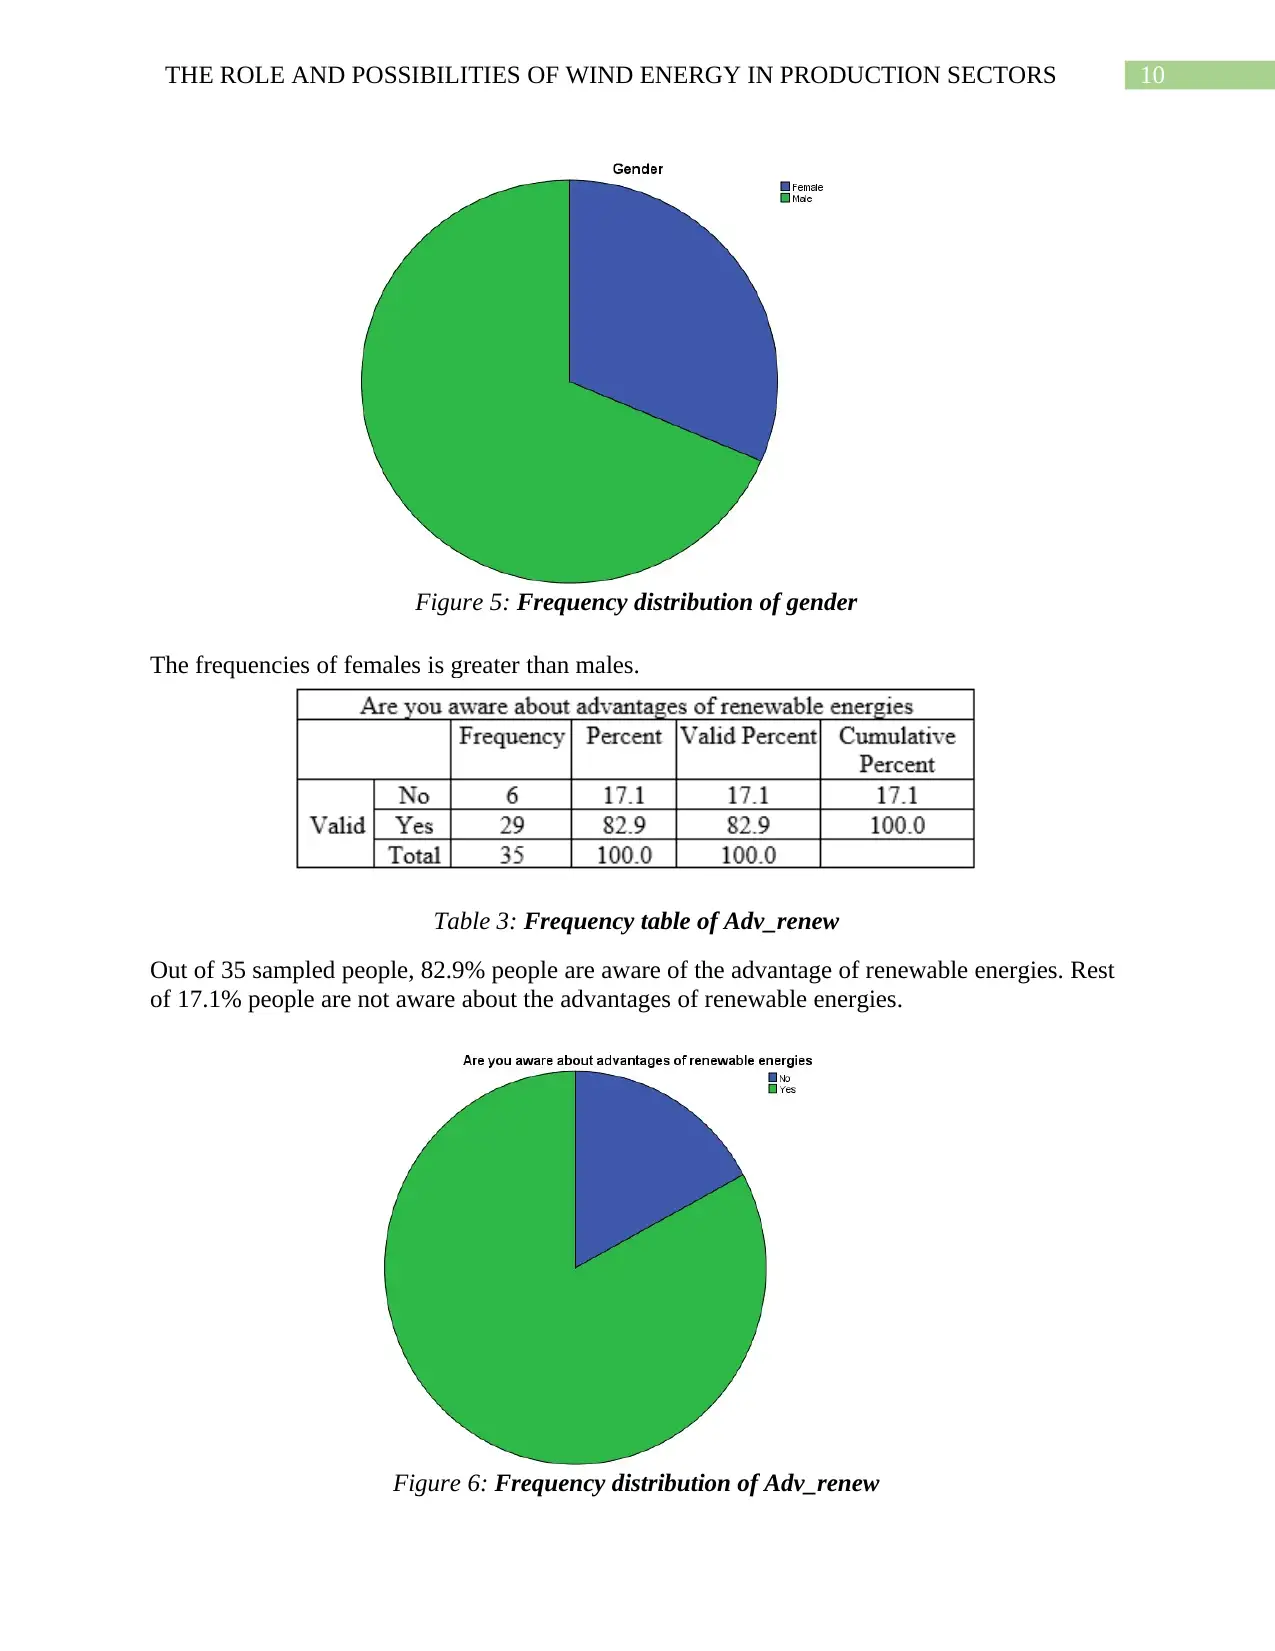
Figure 5: Frequency distribution of gender
The frequencies of females is greater than males.
Table 3: Frequency table of Adv_renew
Out of 35 sampled people, 82.9% people are aware of the advantage of renewable energies. Rest
of 17.1% people are not aware about the advantages of renewable energies.
Figure 6: Frequency distribution of Adv_renew
11THE ROLE AND POSSIBILITIES OF WIND ENERGY IN PRODUCTION SECTORS
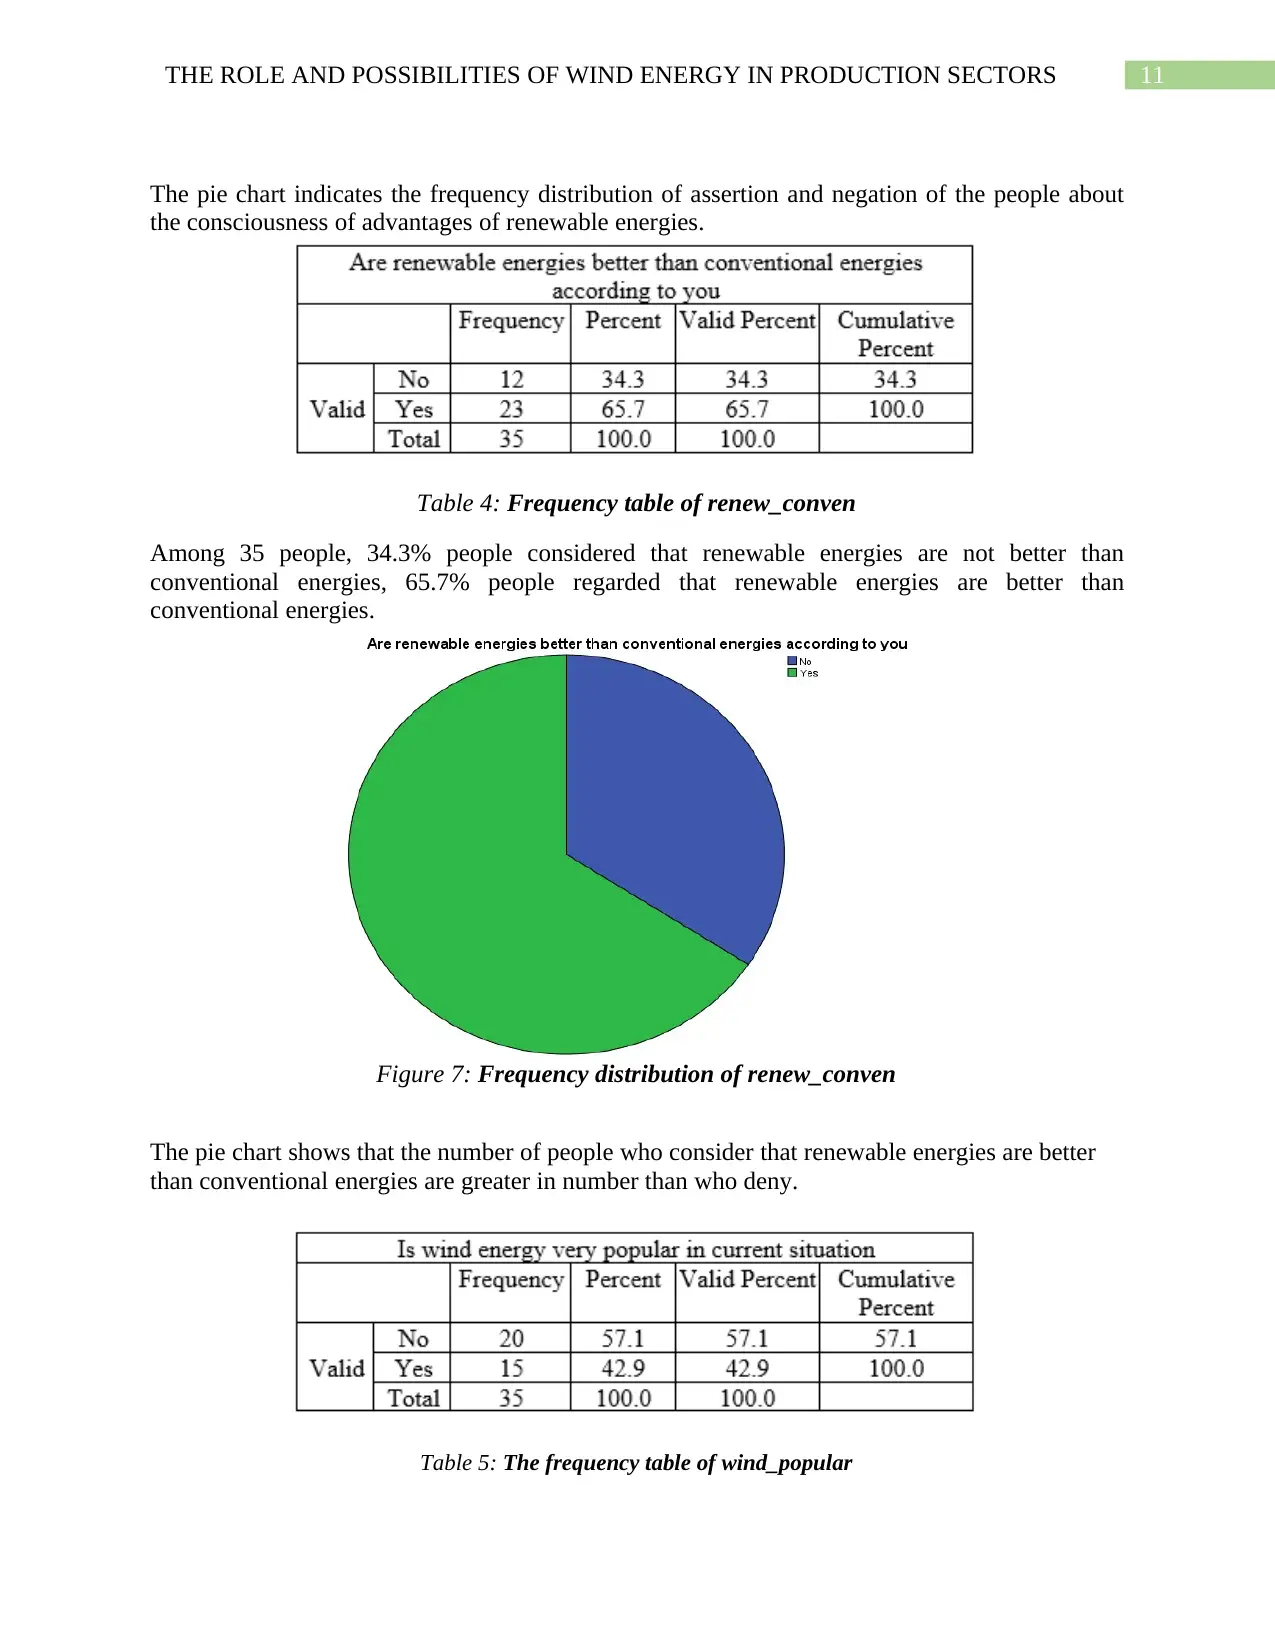
The pie chart indicates the frequency distribution of assertion and negation of the people about
the consciousness of advantages of renewable energies.
Table 4: Frequency table of renew_conven
Among 35 people, 34.3% people considered that renewable energies are not better than
conventional energies, 65.7% people regarded that renewable energies are better than
conventional energies.
Figure 7: Frequency distribution of renew_conven
The pie chart shows that the number of people who consider that renewable energies are better
than conventional energies are greater in number than who deny.
Table 5: The frequency table of wind_popular
⊘ This is a preview!⊘
Do you want full access?
Subscribe today to unlock all pages.
Trusted by 1+ million students worldwide
1 out of 26
Related Documents


Your All-in-One AI-Powered Toolkit for Academic Success.
+13062052269
info@desklib.com
Available 24*7 on WhatsApp / Email
![[object Object]](/_next/static/media/star-bottom.7253800d.svg)
Unlock your academic potential
Copyright © 2020–2026 A2Z Services. All Rights Reserved. Developed and managed by ZUCOL.