Numeracy and Data Analysis Report: Edinburgh Wind Speed Analysis

Verified

Added on  2021/02/20

|9
|1436
|59
Report
AI Summary
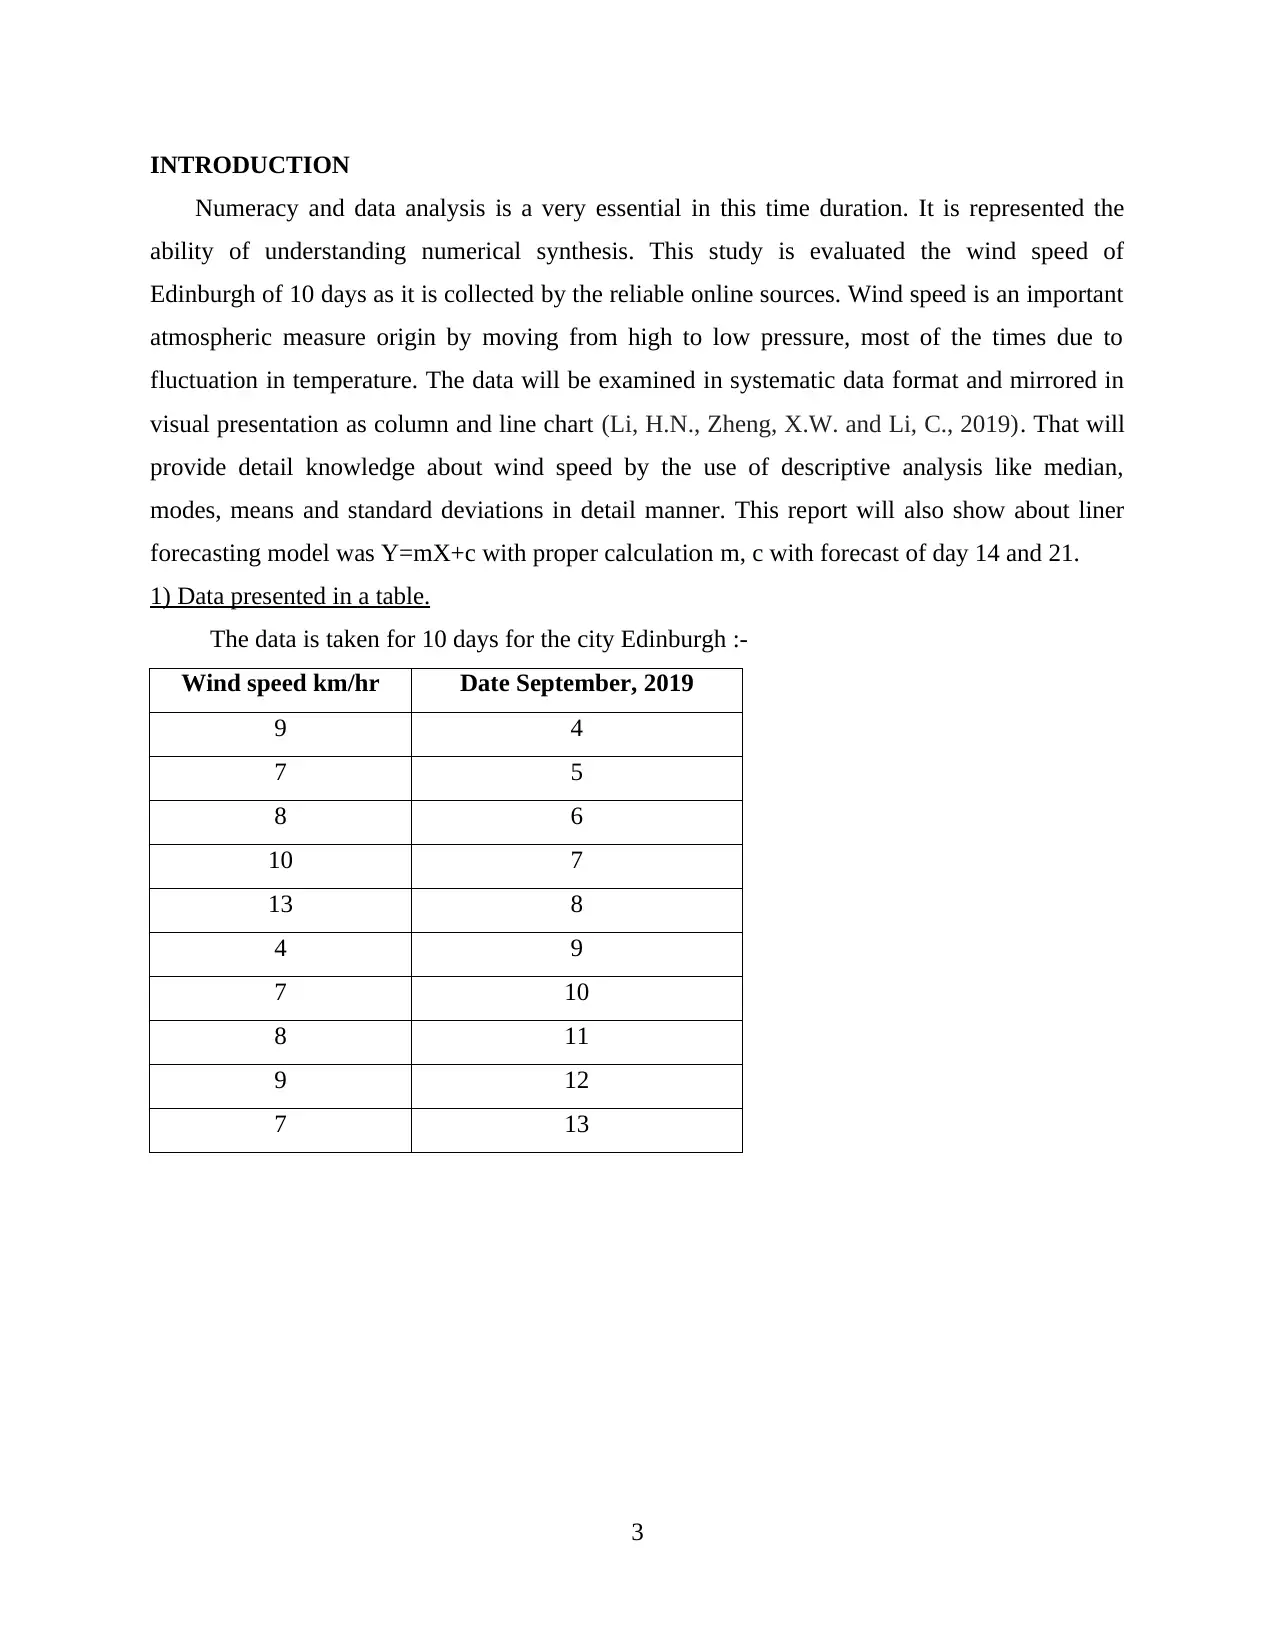
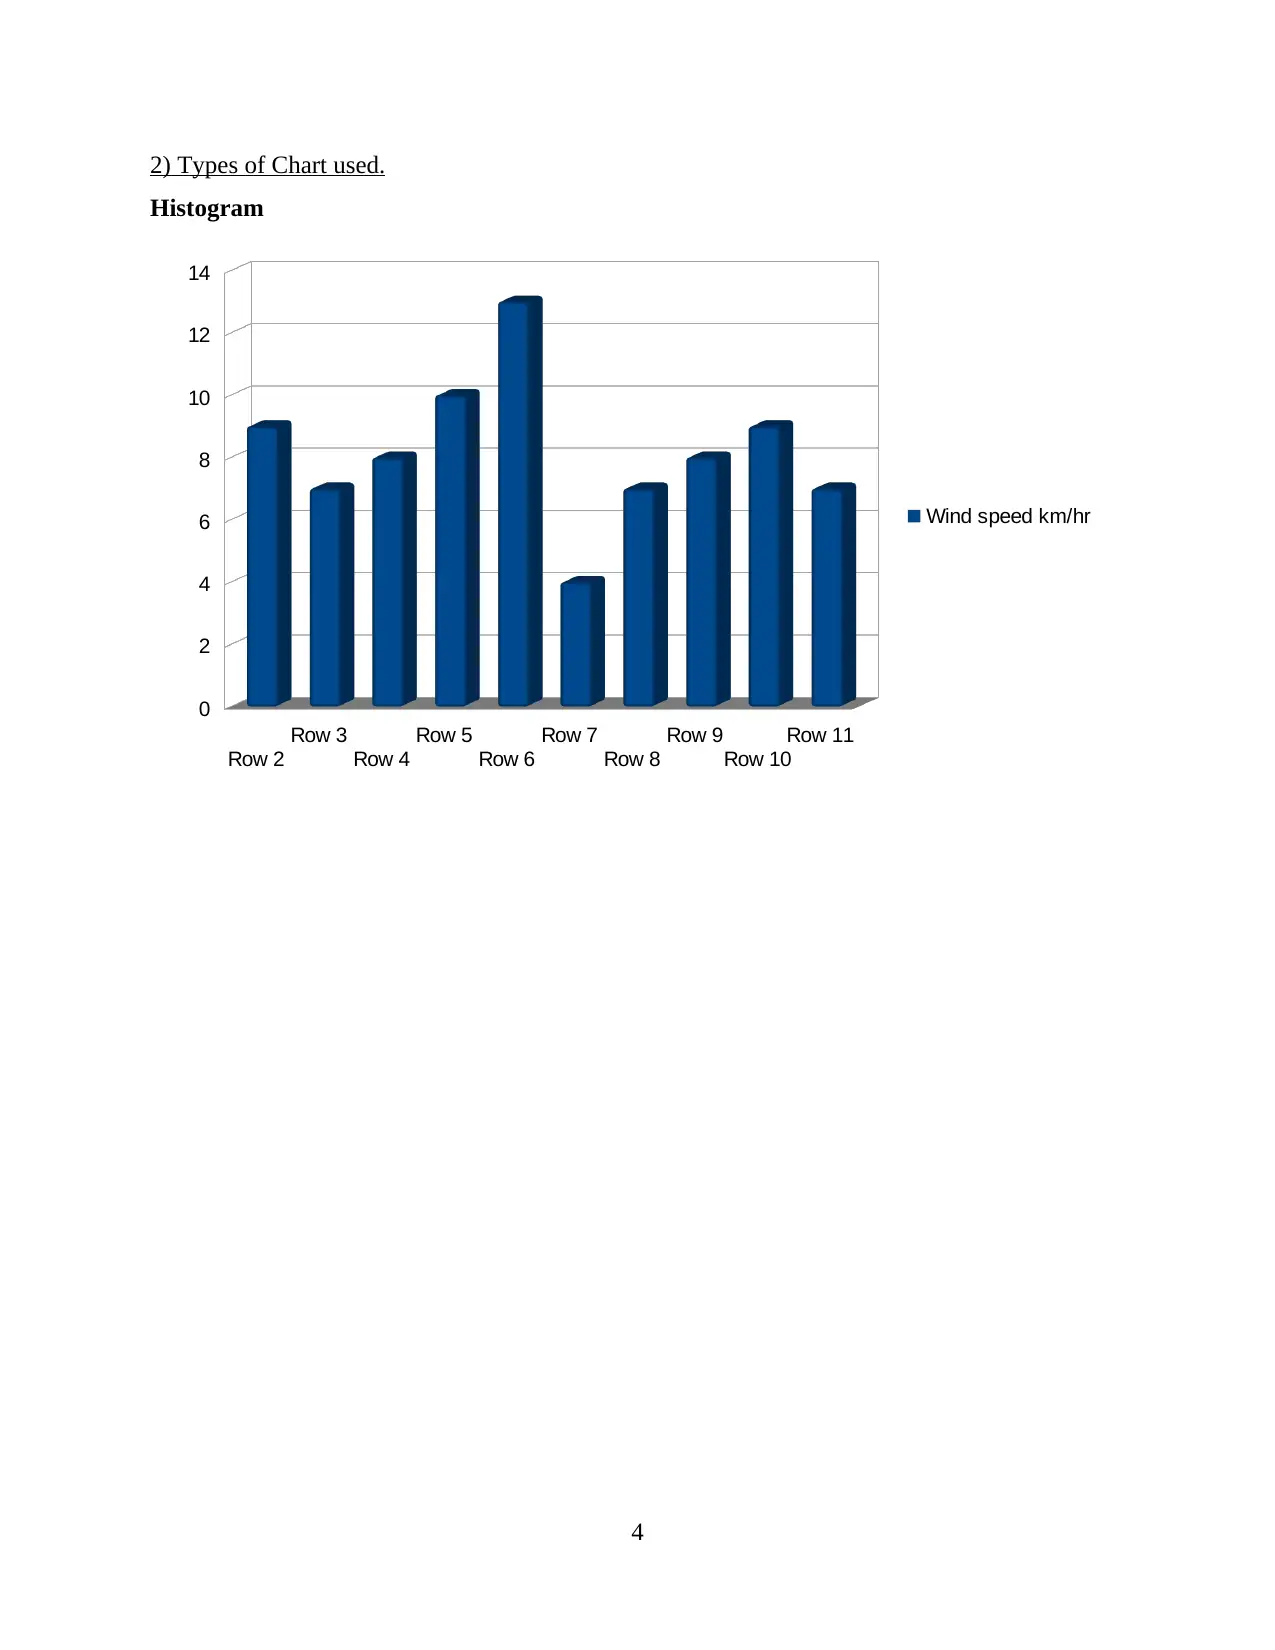
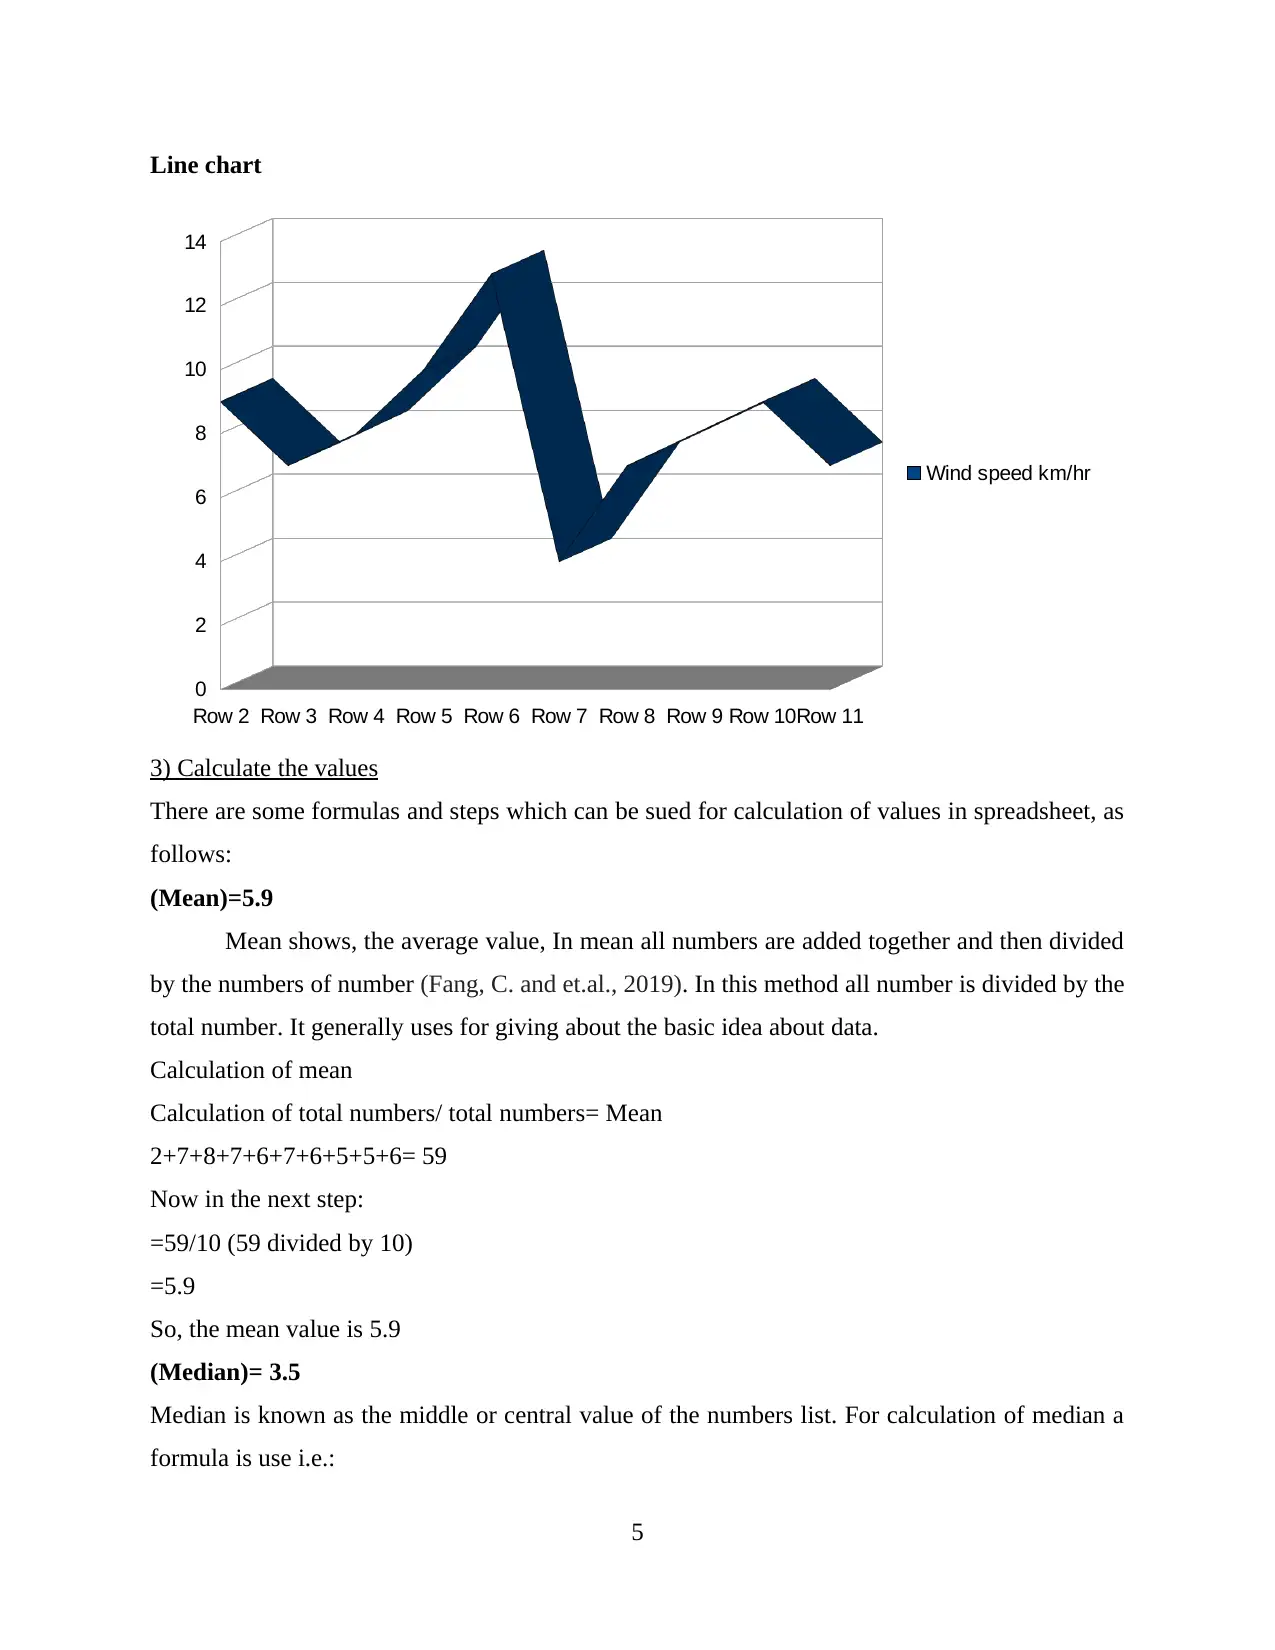
This report presents an analysis of wind speed data collected over 10 days in Edinburgh. It begins with a tabular presentation of the data and utilizes both column and line charts for visual representation. The report then delves into descriptive statistical analysis, calculating the mean, median, mode, range, and standard deviation of the wind speed. Furthermore, it employs a linear forecasting model (Y=mX+c) to predict wind speeds for days 14 and 21, detailing the calculations for determining the values of 'm' and 'c'. The analysis concludes with a summary of findings and a discussion of the importance of numeracy and data analysis in understanding atmospheric measures and forecasting trends. The report uses relevant references to support its analysis.
tabler-icon-diamond-filled.svg

Contribute Materials

Your contribution can guide someone’s learning journey. Share your documents today.
Document Page
NUMERACY AND DATA ANALYSIS
1
tabler-icon-diamond-filled.svg

Secure Best Marks with AI Grader

Need help grading? Try our AI Grader for instant feedback on your assignments.
Document Page
TABLE OF CONTENTS
INTRODUCTION ..........................................................................................................................3
1) Data presented in a table..........................................................................................................3
2) Types of Chart used.................................................................................................................4
3) Calculate the values.................................................................................................................5
4) Linear model for casting with table presentation....................................................................7
a) Calculating the value of m.......................................................................................................7
b) Calculating the value of c........................................................................................................7
c) Forecasting done on the basis of the value m and c for the day 14 and day 21.......................7
CONCLUSION ...............................................................................................................................8
REFERENCES................................................................................................................................9
2
Document Page
INTRODUCTION
Numeracy and data analysis is a very essential in this time duration. It is represented the
ability of understanding numerical synthesis. This study is evaluated the wind speed of
Edinburgh of 10 days as it is collected by the reliable online sources. Wind speed is an important
atmospheric measure origin by moving from high to low pressure, most of the times due to
fluctuation in temperature. The data will be examined in systematic data format and mirrored in
visual presentation as column and line chart (Li, H.N., Zheng, X.W. and Li, C., 2019). That will
provide detail knowledge about wind speed by the use of descriptive analysis like median,
modes, means and standard deviations in detail manner. This report will also show about liner
forecasting model was Y=mX+c with proper calculation m, c with forecast of day 14 and 21.
1) Data presented in a table.
The data is taken for 10 days for the city Edinburgh :-
Wind speed km/hr Date September, 2019
9 4
7 5
8 6
10 7
13 8
4 9
7 10
8 11
9 12
7 13
3
Document Page
2) Types of Chart used.
Histogram
4
Row 2
Row 3
Row 4
Row 5
Row 6
Row 7
Row 8
Row 9
Row 10
Row 11
0
2
4
6
8
10
12
14
Wind speed km/hr
tabler-icon-diamond-filled.svg

Secure Best Marks with AI Grader

Need help grading? Try our AI Grader for instant feedback on your assignments.
Document Page
Line chart
3) Calculate the values
There are some formulas and steps which can be sued for calculation of values in spreadsheet, as
follows:
(Mean)=5.9
Mean shows, the average value, In mean all numbers are added together and then divided
by the numbers of number (Fang, C. and et.al., 2019). In this method all number is divided by the
total number. It generally uses for giving about the basic idea about data.
Calculation of mean
Calculation of total numbers/ total numbers= Mean
2+7+8+7+6+7+6+5+5+6= 59
Now in the next step:
=59/10 (59 divided by 10)
=5.9
So, the mean value is 5.9
(Median)= 3.5
Median is known as the middle or central value of the numbers list. For calculation of median a
formula is use i.e.:
5
Row 2 Row 3 Row 4 Row 5 Row 6 Row 7 Row 8 Row 9 Row 10Row 11
0
2
4
6
8
10
12
14
Wind speed km/hr
Document Page
(N+1)/2th item
Such as:
2,5,5,6,6,6,7,7,7,8
Now median of those values is
=6+1/2
Median=7/2= 3.5
(Mode)=6
Mode is the value which is come about most often (Samalot, A.. and et.al., 2019). If in list of
numbers no number is repeated, then there is no mode in the numbers of list.
Formula for calculating mode= 1+h[(f1-f0)/(2f1-f0-f2)]
Range= 6
It is method of data set, which reflect the comparison between the smallest values and largest
values in data set. For getting individual range value, upper limit value is subtracted from the
minimum value.
Formula for range calculation:
Maximum value- Minimum value= Range
8-2=6
Standard deviation
It is used to derive the spread of the data as compare to the mean value. The higher the
value the higher are chances that the value is with mean value (Dawn, S., Tiwari, P.K. and
Goswami, A.K., 2019). Standard deviation shows the variation in the data if there is high
standard deviation it means there is high variation and if there is low SD then it means there is
low variation in the flow of wind or the wind speed.
Days (x) Days X^2
Wind speed (in
miles/h) XY
1 04/10/19 1 2 2
2 05/10/19 4 7 14
3 06/10/19 9 8 24
4 07/10/19 16 7 28
5 08/10/19 25 6 30
6 09/10/19 36 7 42
6
Document Page
7 10/10/19 49 6 42
8 11/10/19 64 5 40
9 12/10/19 81 5 45
10 13/10/19 100 6 60
55 Total 385 59 327
From the above calculation it is found that the Standard Deviation of the data is 1.66 and
the mean value of the data is 5.9, which means the wind data will flow highly with standard
deviation (Daratha, N. and et.al., 2019). From the study it is derived that the value of mean is 5.9
km/hr, median value is 6 km/hr, mode value is 6, range value is also 6 and the value of standard
deviation is 1.66 .
4) Linear model for casting with table presentation.
a) Calculating the value of m.
Details Particulars
NΣxy – Σx Σy / NΣ x^2 – (Σx)^2 m
(10 * 327) – (55 * 59) / (10 * 385) –
(55)^2 Calculation part
(3270-3245) / (3850-3025)
0.03 Solution
b) Calculating the value of c.
Details Particulars
Σy - m Σx / N c
(59 – (0.03 * 55))/10
5.74 Solution
c) Forecasting done on the basis of the value m and c for the day 14 and day 21.
Forecast of 14th day
7
tabler-icon-diamond-filled.svg

Paraphrase This Document

Need a fresh take? Get an instant paraphrase of this document with our AI Paraphraser
Document Page
= mX + C Y
0.03 (X) + 5.74 Y
14 X
0.03 (14) +5.74 Y
6.16 Solution
Forecast of 21th day
= mX + C Y
0.03(X) + 5.74 Y
21 X
0.03 (21) + 5.74 Y
6.37 Solution
From the study it is concluded that the value of m is 0.03 whereas the value of c is 53.74
and the value derived at the day 14 in the forecast is 6.16 and the value derived for the 21th day
forecast is 6.37. Which means that the speed of the wind on the day 14 th will be 6.16 km/ hr
where as the speed of the wind on 21st day will be 6.37 km/hr.
CONCLUSION
From the bases of above study it has been concluded that data analysis and numeracy are
very important for evaluation any basic detail with wind speed by using wind speed data of
Edinburgh. This report shows the wind speed and for confront any kind of disputation it also has
presentation of tabular and visual format. It has also given data set of statistics and mirrored
applications of linear forecasting model where on 14th wind speed will be 6.16 m/h and on 21st
wind speed will be 6.37 m/h.
8
Document Page
REFERENCES
Books and journals
Li, H.N., Zheng, X.W. and Li, C., 2019. Copula-based joint distribution analysis of wind speed
and direction. Journal of Engineering Mechanics. 145(5). p.04019024.
Samalot, A.. and et.al., 2019. Combined Kalman Filter and Universal Kriging to Improve Storm
Wind Speed Predictions for the Northeastern United States. Weather and
Forecasting. 34(3). pp.587-601.
Fang, C. and et.al., 2019. Vehicle–bridge coupling dynamic response of sea-crossing railway
bridge under correlated wind and wave conditions. Advances in Structural
Engineering. 22(4). pp.893-906.
Dawn, S., Tiwari, P.K. and Goswami, A.K., 2019. An Approach for Long Term Economic
Operations of Competitive Power Market by Optimal Combined Scheduling of Wind
Turbines and FACTS Controllers. Energy.
Daratha, N. and et.al., 2019. Development of Low-Cost Wind Power Estimation System in
Enggano Island Indonesia. In Advances in Interdisciplinary Engineering (pp. 173-181).
Springer, Singapore.
9
chevron_up_icon
1 out of 9
circle_padding
hide_on_mobile
zoom_out_icon
logo.png

Your All-in-One AI-Powered Toolkit for Academic Success.

Available 24*7 on WhatsApp / Email

[object Object]